|
|

This chapter contains the following sections:
Threshold Manager is a CiscoView-launched threshold management application that allows you to set thresholds and retrieve event information. Threshold Manager relies on RMON (Remote Network Monitoring) alarm and event groups supported in Cisco routers and switches.
Threshold Manager provides an easy interface to access device-specific threshold settings. Using Threshold Manager, you can set thresholds for network devices using Cisco-provided, predefined default policies. These policies can be applied automatically to target devices. Threshold Manager also supports detailed customization of threshold settings.
A threshold policy is a set of configuration data that specifies the condition for triggering a threshold event for a particular management attribute. Only policies which are applied to a device can generate events.
The term event is used to describe an event generated by the RMON agent which may or may not be triggered by a threshold crossing. An event may be signalled as a trap, a new entry in the RMON MIB log table, both, or neither. Threshold Manager displays all events captured from the log table of the RMON agent and correlates threshold-related events to the user-configured threshold policies.
A policy file contains information that tells Threshold Manager how to set thresholds for the MIB variable specified in the policy file. For more information, see the section "About Threshold Policy Files."
A profile is a group of policies.
An agent is a process in the device that handles SNMP requests.
This section describes some common tasks you may want to perform using Threshold Manager, along with a summary of the steps needed to complete the tasks. The tasks are grouped into three categories: event management, threshold policy and settings management, and miscellaneous.
| Task Description | Operations |
|---|---|
| A network segment is having congestion problems, and you want to check if any threshold events have occurred in the device close to the segment. | Open the Threshold Manager window.
Select View>Retrieve Events. View all of the displayed events. Click on the header of any column in the main window to sort the events to investigate the correlation between threshold events and the network problem. Double-click on an interesting event to bring up the Single Event View window to investigate the threshold setting that caused the event to occur. Click on Description to read the description of why this event was generated. |
| Focus on the high priority events, but there are too many events. | Open the Threshold Manager window.
Sort the events based on priority by clicking on the header of the Priority column. |
| When viewing the events, there are too many occurrences of a particular kind of event:
Modify the threshold parameters because they are set too low or too high with respect to the network baseline. | Open the Threshold Manager window.
Double-click on the event. Modify the rising and/or falling threshold parameter(s) to adjust to network baseline, so the events are generated only on exceptions. |
| Finished investigating the displayed events:
Delete some events in the box to reduce memory usage in the agent. | Open the Threshold Manager window.
Select the events and use Delete> Selected Events to delete the selected ones; or Use Delete>All Events to delete all the events. |
| Print out the events for detailed analysis and investigation. | Open the Threshold Manager window.
Make sure your printer is setup properly for the host system. Select File>Print to print out events in the window. Enter the name of the printer in the Print dialog. Click OK to print the events. |
| Task Description | Operations |
|---|---|
| Use RMON threshold capability to perform low-cost monitoring of the agent:
Prefer to monitor all of recommended thresholds on the managed agent. | Open the Threshold Manager window.
Select Config>Thresholds to bring up the Configure Thresholds window. Click Add All Policies. The thresholds are populated in the lower pane of the window based on the device configuration. Click Enforce All. All pending thresholds are downloaded to the agent, and become active thresholds. |
| Use RMON threshold capability to perform low-cost monitoring of the agent:
Do not want to overload the agent with too many active thresholds. Prefer to leverage only the interface profiles. | Open the Threshold Manager window.
Select Config>Thresholds to bring up the Configure Thresholds window. Click on the Profile title to sort the polices by profile name. Select all of the policy rows in the interface profile to be monitored. Click Add Selected Policies. The selected thresholds are populated in the lower pane of the window for all currently Up interfaces, and are marked "Pending" in the Status column. Click Enforce All. All the pending thresholds are downloaded to the agent, and become active thresholds, marked "Active" in the Status column. |
| View the current active thresholds in the managed box. | Open the Threshold Managers window.
Select Config>Thresholds to bring up the Configure Thresholds window. The lower pane of the window shows the current active threshold in the agent. The table can be sorted differently by clicking on the title of the field. |
| The CPU load of the device is too high:
Delete some thresholds to reduce load added by threshold monitoring, or Extend the sampling interval. | Open the Threshold Manager window.
Select Config>Thresholds to bring up Configure Thresholds window. Click Retrieve Thresholds to retrieve the current active thresholds from the managed agent. Check the count of the current thresholds setting to see how many thresholds are active. Select the threshold rows that are less critical to monitor. Click Delete Selected to delete the thresholds from the agent. The events associated with these deleted thresholds are removed as well. |
| Customize the threshold parameters for predefined thresholds. | Open the Threshold Manager window.
Select Config>Thresholds to bring up Configure Thresholds window. Double-click on the threshold policy you want to modify. Setup the parameters to fit your network baseline. Save the changes to disk. The changes can be saved at the global level, which can be used by all devices; or saved at the device class level, which can be used by all devices of the same device type; or saved at the device instance level, which can only be used again for this particular device. |
| Apply an interface-specific threshold only to a particular interface, instead of all interfaces. | Open the Threshold Manager window.
Select Config>Thresholds to bring up Configure Thresholds window. Double click on the threshold policy you wish to enforce to the agent. Click Continue in the Modify Threshold Policy window. Select the interface for setting the threshold from the Interface Selection dialog. Click OK to push it to the staging area. Click Enforce All to download the changes to the agent. |
| Use different threshold settings for each interface for interface-specific thresholds when the thresholds are still pending in the management station. | Open the Threshold Manager window.
Select Config>Thresholds to bring up Configure Thresholds window. Double click on a threshold row in the lower pane of the window. Modify the threshold parameters in the Modify Threshold Setting window. Click Enforce to enforce to the agent Double-click on another threshold, and repeat the steps until the threshold setting for each interface is configured properly. |
| Set thresholds for only system MIB. | Open the Threshold Manager window.
Select Config>Profiles to hide profiles other than system. In the Filter Profiles window, select profiles other than system and click on the arrow to move the profiles to the Hide Profiles box. Select Config>Thresholds to bring up Configure Thresholds window. The upper window now shows only the system policies. |
| Create a new threshold policy and save it for later use. | Open the Threshold Manager window.
Select Config>Thresholds to bring up Configure Thresholds window. Click Create New Policy. Choose the appropriate target type for the threshold to be defined. Set up all parameters for this customized threshold policy. Save this policy to the desired location by clicking the proper button representing the destination (global, device class, or host) on the right hand side of the window. |
| Adjust the event retrieving interval, because events are retrieved too frequently, and there is not that much event activity going on in this device. | Open the Threshold Manager window.
Select Config>Thresholds (Properties - Solaris) to bring up the Properties window. Set the Refresh Timer to a larger number. Click OK. |
| Task Description | Operations |
|---|---|
| Print out the current active thresholds. | Open the Threshold Manager window.
Select Config>Thresholds to bring up Configure Thresholds window. Click Print Thresholds to print thresholds listed in the lower pane window. Enter the name of the printer in the Threshold Manager Printing dialog. Click OK to print the thresholds. |
| Manage the thresholds or view the events for another device. | Use File>New... to launch another instance of Threshold Manager. |
| What does a policy mean? | Open the Threshold Manager window.
Select Config>Thresholds to bring up Configure Thresholds window. Double-click on a threshold policy that you want to learn more about. Click Description in the Modify Threshold Policy window. Threshold Manager provides help text on what this policy means. |
| Check out the general summary of the device:
Especially interested in the current interface status and other interface related information, such as interface speed. | Open the Threshold Manager window.
Select Config>Thresholds (Properties - Solaris) to bring up the Properties window. Click Retrieve in the Interface and Port pane to retrieve latest interface information of the device. |
| Use Threshold Manager to monitor more than one agent. | Bring up Threshold Manager on a device.
Set up the Event Retrieving Refresh Timer properly by using Config>Threshold->Properties. Select File>New... to invoke Threshold Manager on another agent. Iconify both Threshold Manager main windows to reduce screen real estate usage. The icon of each instance now has a title containing the name of the device being managed, along with the event count. (This feature is only available on the NT version.) |
| Learn more about Threshold Manager. | Open the Threshold Manager window.
Click Help>Help Topics. The NT version provides context sensitive help. |
When you start Threshold Manager, the Threshold Manager events list window appears, as shown in Figure 2-1.
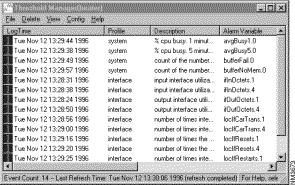
The threshold event list contains the logged events retrieved from the agent. Threshold manager retrieves events at startup time, when the user selects the View>Retrieve Events menu item, and when the refresh timer reaches a specified interval. The refresh timer is described later in this chapter.
When a threshold event is retrieved from the agent, Threshold Manager tries to correlate the information from the event with existing policies to show additional information about the event. If an event cannot be correlated back to any policy, Threshold Manager displays "undefined".
An event is displayed until you delete it, another user managing the same device deletes it, or the RMON agent reaches its event limit.
Each entry threshold in the event list contains the following fields associated with a policy:
You can sort the event list by clicking on the field headers. You can also change the width of the columns by clicking on the dividers between the field headers and stretching the column to the desired size. On Solaris systems, press the Shift key and click the middle mouse button while dragging the divider.
The following menu items appear on the Threshold Manager events window:
| File | |
| New Threshold Manager | Start a new instance of Threshold Manager. |
| Print the events listed. | |
| Print Setup (Windows NT) | Set up the printer. |
| Exit | Exit Threshold Manager. |
| Delete | |
| Delete All Events | Delete all logged events. |
| Delete Selected Events | Delete the selected logged events. |
| View | |
| Retrieve Events | Retrieve events from the agent to refresh the list view. Events are also automatically retrieved if the refresh timer is set and greater than zero. |
| Config | |
| Properties (Solaris) | Display summary device information. |
| Config Device (Solaris) | Start a dialog for configuring your device. |
| Thresholds | Start a set of dialogs which support configuration and display of threshold policies and related information. |
| Profiles | Specify which profiles are displayed. |
| Help | |
| Help Topics | Display list of online help topics. |
| About Threshold Manager | Display information about this release of Threshold Manager. |
The Single Event View window, shown in Figure 2-2, appears when you double-click on an entry in the Threshold Manager events window.
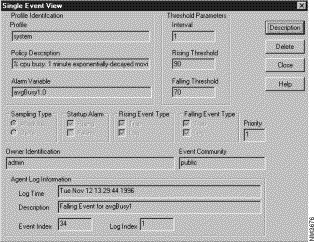
This window shows information about an event. Click the Description button to see a more detailed description of the event.
Click the Delete button to delete the event from the event log. This has the same effect as selecting the event in the events list window and selecting Delete>Selected Events.
You may want to delete events when you have finished analyzing a particular event type and no longer need to view it, or you want to decrease the number of events displayed in the events list window.
In addition to the fields described in the previous section, this window also shows the following fields:
| Interval | Interval in seconds over which the data is sampled and compared with rising and falling thresholds. |
Threshold for the sampled statistic. When the current sampled value is greater than or equal to this threshold, a single event is generated. A single event is also generated if the first sample after this entry becomes active is greater than or equal to this threshold, and the associated Startup Alarm is equal to rising. After a rising event is generated, another such event is not generated until the sampled value falls below this threshold and reaches Falling Threshold. See "Rising and Falling Events." | |
Threshold for the sampled statistic. When the current sampled value is less than or equal to this threshold, and the value at the last sampling interval was greater than this threshold, a single event is generated. A single event is also be generated if the first sample after this entry becomes active is less than or equal to this threshold and the associated Startup Alarm is equal to falling. After a falling event is generated, another such event is not generated until the sampled value rises above this threshold and reaches Rising Threshold. See "Rising and Falling Events." | |
| Sampling Type | Method of sampling the selected variable and calculating the value to be compared against the thresholds. If the value of this object is Absolute, the value of the selected variable is compared directly with the thresholds at the end of the sampling interval. If the value of this object is Delta, the value of the selected variable at the last sample is subtracted from the current value, and the difference compared with the thresholds. |
| Startup Alarm | Alarm which may be sent when this entry first becomes active. If the first sample after this entry becomes active is greater than or equal to Rising Threshold, and Startup Alarm is equal to rising, then a single rising alarm is generated. If the first sample after this entry becomes active is less than or equal to Falling Threshold, and Startup Alarm is equal to falling, then a single falling alarm is generated. |
| Rising Event Type | Notification that the agent makes about the rising event. In the case of log, an entry is made in the log table for each event. In the case of snmp-trap, an SNMP trap is sent to one or more management stations. |
| Falling Event Type | Notification that the agent makes about the falling event. In the case of log, an entry is made in the log table for each event. In the case of snmp-trap, an SNMP trap is sent to one or more management stations. |
| Owner Identification | Text string, usually the name or user ID of the person who configured this entry and is therefore using the resources assigned to it. |
| Event Community | Specifies the SNMP community to which an SNMP trap is sent. Can be any text string; default is public. |
For example, the event shown in Figure 2-2 was logged as a falling event for the MIB variable avgBusy1. This variable reports the percent CPU utilization over one minute. When this event occurred, an SNMP trap was sent and an entry was made in the log table.
Figure 2-3 shows when rising and falling events occur with the Startup Alarm set to Rising and Falling.
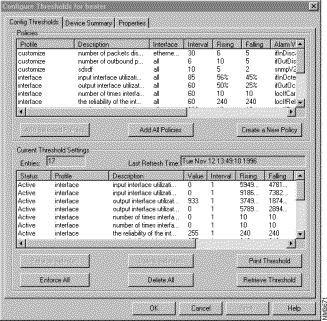
The Config Thresholds tab of the Configure Thresholds window (the Thresholds window on Solaris,) shown in Figure 2-4, allows you to modify and create policies and work with threshold settings.
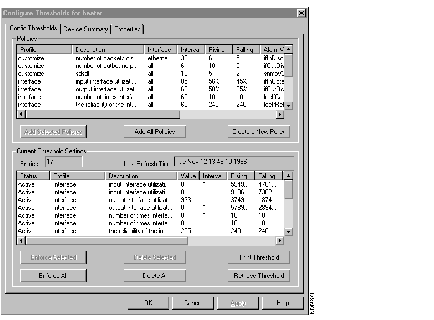
This window consists of two panes: the Policies pane and the Current Threshold Settings pane.
The Policies pane in the upper half of the window displays all policies saved in the config directory. From this list of policies, you can select one or more policies to apply to the agent using the Enforce... button. To select a policy, click on the policy. To select more than one policy, press the Shift key while clicking on each policy.
Click Add Selected Policies or Add All Policies to add selected or all policies to the staging area (the lower half of the window) for eventual enforcement to the agent.
You can also create new policies by clicking Create a New Policy. See "Creating New Threshold Policies" later in this chapter for more information.
To modify a policy, double-click on its profile name. This opens the Modify Threshold Policy window. See "Modifying Threshold Policies" later in this chapter.
The lower half of the Configure Thresholds window contains the Current Threshold Settings pane. This displays the list of threshold policies (the staging area) that are in memory (status is "Pending" or in the agent (status is "Active" or "Failed.") Threshold Manager can show complete information about an existing threshold if it was created by Threshold Manager. Otherwise, Threshold Manager may not be able to trace back all the information, and the field content displays "undefined".
Select one or more Pending policies from the staging area, and click Enforce Selected or Enforce All. This applies the policy to the agent and changes the policy status from Pending to Active (or Failed.)
To modify threshold settings for a policy, double-click on it in the lower pane. This opens the Modify Threshold Setting window. See "Modifying Threshold Settings" later in this chapter.
To delete threshold settings, select one or more policies and click Delete Selected or Delete All.This deletes threshold settings, in memory and the agent. All logs generated by these settings are also deleted.
Click Print Threshold to print all listed threshold entries.
Click Retrieve Threshold to retrieve the latest threshold settings from the agent. Any policies with a status of Pending will be lost.
You can create new threshold policies in the Create Threshold Policy window, shown in Figure 2-5.
When a new threshold policy is created, it is not enforced immediately to the agent. After you fill out and accept the input fields, save it and click the Continue button, a new policy is stored in memory with a status of Pending. You can view the new policy together with existing threshold policies.
The newly created policy can be saved to the config directory, enforced to the agent, or both. If you enforce the policy without saving it, the policy can only be used by this instance of Threshold Manager. If you save the policy, it can be used by future instances of Threshold Manager as well. Several save options are available:
For more information on policy files, see "About Threshold Policy Files" at the end of this chapter.
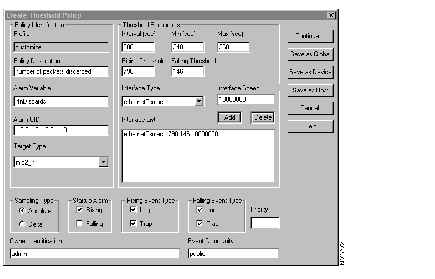
The Create Threshold Policy window has the following fields:
For example, you may want to create a threshold policy based on the SNMP MIB variable ifOutErrors, show in Figure 2-5. This variable reports the number of outbound packets that could not be transmitted because of errors.
To create a policy for this variable, perform the following steps:
Step 1 Click Create a New Policy in the Configure Thresholds window. This opens the Create Threshold Policy window.
Step 2 Enter a description such as "Number of outbound packets not transmitted."
Step 3 Enter the MIB variable name, ifOutErrors. OR
Step 4 Enter the MIB object ID 1.3.6.1.2.1.2.2.1.20.
Step 5 Select mib2_if from the Target Type drop list, since ifOutErrors is a MIB-II interface variable.
Step 6 Enter values for Interval, Min and Max, such as 30, 10 and 40. The value for Interval must be between the Min and Max values.
Step 7 Enter values for Rising and Falling Threshold, such as 60 and 5. The Falling Threshold must be less than or equal to the Rising Threshold.
Step 8 Select default from the Interface Type drop list. Interface Speed is optional.
Step 9 Select a Sampling Type of Absolute.
Step 10 Select both Rising and Falling for Startup Alarm. This generates an event if the threshold value is above the Rising Threshold or below the Falling Threshold value at the time the policy is first enforced.
Step 11 Select both Log and Trap for the Rising and Falling Event Types.
Step 12 Enter a priority of 1.
Step 13 Enter a name in the Owner Identification field. The Event Community can be changed, but leave it public for now.
Step 14 Click Save as Host to save the policy to the host-specific config directory.
Step 15 Click Continue. This opens the Interface Selection window, because ifOutErrors is an interface variable.
Step 16 Select one or more interfaces, then click OK. The policy now appears in the Current Threshold Settings pane with a status of Pending.
The action buttons in the Create Threshold Policy window are as follows:
| Continue... | Continue the process of creating a threshold setting for the policy. If a threshold MIB variable is part of an interface table, the Interface Selection dialog appears. Select one or more interfaces from this dialog. Use Shift-left mouse button to select a range of interfaces. Use Control-left mouse button to select non-consecutive individual interfaces. If the threshold MIB variable is not associated with an interface, clicking the Continue button adds the policy directly to the staging area with a status of Pending. |
| Save as Global | Save the policy to the global Threshold Directory. This means the policy can be used with all devices. The global profile directory is searched by Threshold Manager after all other host and device class-specific directories have been searched for applicable policies. |
| Save as Device Class | Save the policy to the device class-specific profile directory. This means the policy can be used with all devices in that class, for example, a Cisco 4500 is in the 4000 class. The device class-specific profile directory is searched by Threshold Manager after the host-specific directory has been searched for applicable policies. |
| Save as Host | Save the policy to the device-specific profile directory. This means the policy can only be used by the host on which the policy is saved. When searching for applicable policies for a device, Threshold Manager looks at this specific directory first. There can be at most one directory per device. The directory is named after the host name of the device. |
Note that saving a policy does not enforce it, nor does enforcing a policy save it.
The Modify Threshold Policy window lets you modify threshold parameters for policies not yet in memory or enforced to the agent. To modify a policy, double-click on it in the Policies Pane. This opens the Modify Threshold Policy window, shown in Figure 2-6.
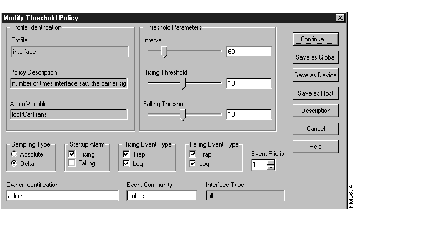
The Modify Threshold Policy window contains the following fields:
| Profile | Name of the threshold profile. This is a read-only field. |
| Policy Description | Policy description. This is a read-only field. |
| Alarm Variable | Alarm variable name for the chosen threshold policy. This is a read-only field. |
| Interval | Default interval value. You can change this value by using the slider control.
If the sampling type is Delta, moving the Interval slider control moves the Rising and Falling Threshold slider controls automatically, or you can enter values in the fields next to the sliders, and the sliders will be ignored. If the sampling type is Absolute and you adjust the interval slider, Threshold Manager does not react accordingly. |
| Rising Threshold | Threshold for the sampled statistic. The default rising threshold is displayed. When the current sampled value is greater than or equal to this threshold and the value at the last sampling interval was less than this threshold, a single event is generated. A single event is also generated if the first sample after this entry becomes active is greater than or equal to this threshold and the associated Startup Alarm is set to Rising. See "Rising and Falling Events." |
| Falling Threshold | Threshold for the sampled statistic. The default falling threshold is displayed. When the current sampled value is less than or equal to this threshold and the value at the last sampling interval was greater than this threshold, a single event is generated. A single event is also generated if the first sample after this entry becomes active is less than or equal to this threshold and the associated Startup Alarm is set to Falling. See "Rising and Falling Events." |
| Sampling Type | Method of sampling the selected variable and calculating the value to be compared against the thresholds. Values are Absolute or Delta. If you select Absolute, the value of the variable is compared directly with the thresholds at the end of the sampling interval. If you select Delta, the value of the variable at the last sampling is subtracted from the current value, and the difference compared with the thresholds. |
| Startup Alarm | Alarm that can be sent when this entry first becomes active. If the first sample after this entry becomes active is greater than or equal to the Rising Threshold and Startup Alarm is equal to Rising, then a single rising alarm is generated. If the first sample after this entry becomes active is less than or equal to the Falling Threshold and Startup Alarm is equal to Falling, then a single falling alarm is generated. |
| Rising Event Type | Type of notification that the agent makes about the rising event. If set to Log, an entry is made in the log table for each event. If set to Trap, an SNMP trap is sent to one or more management stations, according to the current configuration of the device. |
| Falling Event Type | Type of notification that the agent makes about the falling event. If set to Log, an entry is made in the log table for each event. If set to Trap, an SNMP trap is sent to one or more management stations, according to the current configuration of the device. |
| Event Priority | Priority of the threshold event. Values are 1 (highest) to 3 (lowest). |
| Owner Identification | Name of person who configured this entry and is therefore using the resources assigned to it. |
| Event Community | SNMP community to which SNMP traps are sent. This can be a mail alias, depending on how your device is configured. |
| Interface Type | Interface type. This is a read-only field. |
The action buttons in the Modify Threshold Policy window are as follows:
The Modify Threshold Setting window, shown in Figure 2-7, appears when you double-click on a policy's name in the Current Threshold Settings pane. It displays information about the selected policy, and enables you to modify threshold parameters already in memory or the agent.
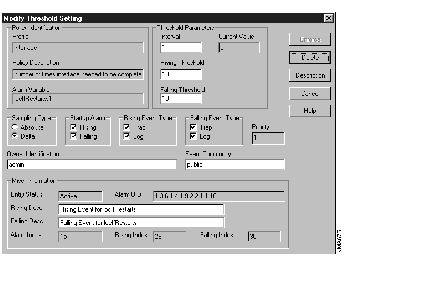
You can change any of the values in the Threshold Parameters box, and change the Sampling Type, Startup Alarm, Rising Event Type, Falling Event Type, Priority, Owner Identification, and Event Community. See "Viewing Single Events" for descriptions.
The Miscellaneous Information in the lower part of the window shows whether the policy is active or pending, the Alarm Object ID, Rising and Falling Descriptions, and current indices. The Rising and Falling descriptions are used in the Log Description column of the Threshold Manager events list window. You can modify these descriptions. They default to "Rising/Falling Event for Alarm_variable_name."
The action buttons in the Modify Threshold Setting window are as follows:
| Enforce | Apply the policy to the agent. |
| Delete | Delete the policy from the agent. |
| Description | Display a description of the currently displayed policy. |
Customized policies (policies you created yourself) cannot be deleted using Threshold Manager. To delete a policy, go to the directory where the customized profile was saved and remove the file manually. The name of the policy file is the value you entered in the MIB Variable field of the Create Threshold Policy window.
Note that you cannot save customized policies with a target type of customize.
Where the policy file is stored depends on how you saved it. For example, the following table shows where the policy file would be stored for a Cisco 4500 device:
| If you click: | The policy file is saved under: |
| Save as Host | NMSROOT\etc\devices\Threshold-Mgr\config\cisco4000\hostname |
| Save as Device Class | NMSROOT\etc\devices\Threshold-Mgr\config\cisco4000 |
| Save as Global | NMSROOT\etc\devices\Threshold-Mgr\config\ |
Normally, when Threshold Manager is started by the CiscoView application, it receives all the runtime arguments it needs to operate. Using the dialog box in the Properties tab (shown in Figure 2-8), you can override some of the startup parameters when needed. You can also specify whether the event list will be refreshed.
Use this window to modify the displayed values if Threshold Manager was invoked with the wrong runtime arguments., For example, if you started Threshold Manager with the wrong Write Community String, you can change its value in this window without having to exit and restart Threshold Manager.
This window can also be used to begin managing thresholds on a different device without starting a new instance of Threshold Manager. Note that you can manage only one device per instance.
The Properties tab has the following input fields:
| IP Address | Host name or IP address of the device. |
| Refresh Timer | Time interval, in seconds, until Threshold Manager next refreshes the Threshold Manager events list window with the latest information from the agent. The default is 360 (6 minutes). Range is 0 - 7200. If the value is zero, no refresh is done. |
| Read Community String | Community string used by Threshold Manager to retrieve the Alarm variables from the device. |
| Write Community String | Community string used by Threshold Manager to set new values of Alarm variables. |
| Timeout | Interval, in seconds, that Threshold Manager waits before it declares that a previous SNMP operation has timed out. If device is on a typically busy network, use a larger timeout value. Valid values are 5 to 60. The default is 5. |
| Retry Count | Number of times Threshold Manager repeats an SNMP operation before giving up. Valid values are 1 to 5. The default is 1. |
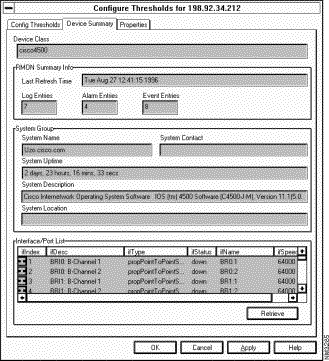
The Device Summary tab, shown in Figure 2-9, displays summary information about the device and the RMON MIB.
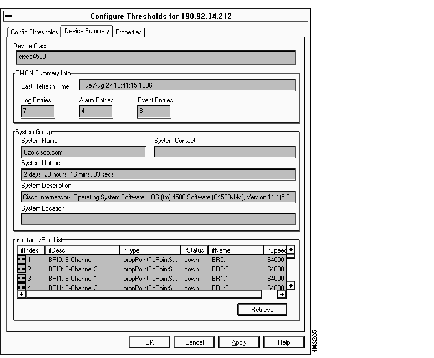
The following information is displayed:
| Device Class | Type of device. |
| Last Refresh Time | Last time events were retrieved by the agent. |
| Log Entries Alarm Entries Event Entries | Number of entries in the log, alarm, and event tables.1 |
System Name | Information about the system. One or more fields may be blank depending on the device configuration. |
| Interface/Port List | List of interfaces and ports available to the device. The icon (NT only) in the left column is either an I (interface) or P (port). A red icon indicates the interface or port is down, and a green icon indicates the interface or port is up. |
Click Retrieve to get the latest Interface/Port information.
You can run multiple instances of Threshold Manager simultaneously to manage thresholds on several devices. From the pulldown menu, select File>New Threshold Manager to open the dialog box shown in Figure 2-10.
The defaults in this window apply to the current device configuration. You need to set the host address of the device to be managed. You also need to specify the Threshold Manager Directory if it is not installed in the default location. The Threshold Manager Directory is under the Threshold Directory called Threshold Manager. For example,
/CWW/etc/cview/devices/Threshold-Mgr/
For descriptions of the other input fields in this window, see the section "Viewing Device Properties" earlier in this chapter.
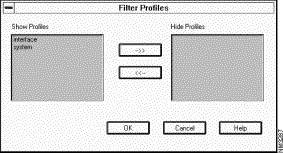
The Filter Profiles dialog box lets you prevent certain profiles from being shown in the Policies pane of the Config Thresholds window.
From the main window pulldown menu, select Config>Profiles to open the dialog box shown in Figure 2-11.
This is useful if, for example, you only want to set interface-related thresholds. By disabling all other profiles, only interface policies are shown in the windows that manage policies.
Threshold Manager is delivered with a set of predefined policy files. Threshold Manager uses policies described in a policy file to set threshold values into an RMON device agent. A threshold manager policy file contains at least one threshold policy, the default policy, for the Alarm variable defined in the policy file. A policy file may contain more than one threshold policy to define threshold values for specific interface types. When an interface specific policy is defined, Threshold Manager applies the threshold policy to the matching interface type. If there is no interface specific threshold policy defined, Threshold Manager applies the default threshold value to all device interfaces.
There are many predefined policy files that are shipped together with the Threshold Manager. A policy file is a plain text file; it is defined by keywords which are used by Threshold Manager to scan the file. Each policy file defines a Alarm variable to be monitored by a device RMON agent, as well as one or more threshold policies to be set to the device agent for monitoring purposes.
In order to understand the meaning of policies and to simplify file parsing process, Threshold Manager imposes strict rules whenever a policy file is created either manually or through the Create Policy dialog in Threshold Manager. It is highly recommended that you create customized policy files by using the Threshold Manager graphic user interface.
A policy file is composed of many keyword-value pairs. A keyword and its value are separated by an equal sign "=". If the keyword requires more than one value, each value is separated by a colon ":". Each line of a policy profile contains only one keyword-value pair, for example:
Target_Type = etherStats
Rising_Threshold = 200
Falling_Threshold = 20
Sample_Interval = 60:0:300
The order of the keyword-value pair is not important. All white spaces are ignored by the Threshold Manager during file parsing. If a keyword appears more than once, the last keyword-value pair takes effect. The only exception to this rule is keyword Interface_Threshold.
An interface-specific policy is defined by the keyword Interface_Threshold. There can be multiple Interface_Threshold keyword-value pairs in a policy profile, each of which defines specific threshold policy (value) for a particular interface type, for example:
Interface_Threshold = ethernetCsmacd:375000000:187500000:100000000
Interface_Threshold = ethernetCsmacd:37500000:18750000:10000000
The syntax of this special keyword-value pair is as follows:
Interface_Threshold=interface_type:rising_thresh_value:falling_thresh_value:interface_speed
where interface_speed is optional.
Threshold Manager uses the interface-specific policy to set thresholds for the interface type involved. If the interface speed is specified in the policy, the policy is applied to interfaces that match both the interface type and speed. If interface speed is not present, the policy is applied to the interface that matches the specified interface type, regardless of its speed. The default policy is used to set thresholds for interfaces without an interface-specific policy defined.
Policies are loaded into Threshold Manager during startup of Threshold Manager and when a new instance of Threshold Manager is launched to monitor another device. Once the policies are loaded, any new policy file created manually is ignored by Threshold Manager. However, a new policy file that is created and saved by the Create Policy Dialog is immediately visible inside the Threshold Manager.
Policy files are grouped into three types: global, device class, and host. All policy files are saved under the config directory of the Threshold Manager. Policy files under the config directory are global policy files and are used for all devices. Policy file under the device class sub-directory apply to devices that belong to the same device class family. Policy files that are saved in the host sub-directory are used to set threshold against only the specific host.
When reading policies for a given device, Threshold Manager first searches that host sub-directory to locate any host-specific policy files defined for that device, then it scans the device class sub-directory for policy files defined for that device class, and finally it picks up any policy files not defined elsewhere.
The following example shows one of the predefined policy files:
#
#The following formula is used to calculate the % utilization:
#<% util>**/(100*8)
#
#The falling threshold is set to half of the rising threshold
#
Profile_Name=interface
Policy_Name=Output Interface Utilization
MIB_Name=ifOutOctets:1.3.6.1.2.1.2.2.1.16
Target_Type=mib2_util
Sample_Type=delta
Sample_Interval=60:0:300
Startup_Alarm=rising
Rising_Threshold=50
Falling_Threshold=25
Owner_Spec=admin
Event_Priority=1
Rising_Event_Type=log
Falling_Event_Type=none
Event_Community=public
| Rising_Threshold | Default rising threshold value. |
| Falling_Threshold | Default falling threshold value. |
| Sample_Interval | interval:min_interval:max_interval |
| This keyword requires three values. The first value is sampling interval for data collecting. The second value is minimum sampling interval. And the third value is maximum sampling interval. | |
| Sample_Type | Specifies how to sample data. Possible values are:
- abs : compare the actual value with the thresholds. - delta : compare the delta value with the thresholds. |
| Event_Priority | Associate a severity value to the policy file. The range is from 1 to 3. |
| Owner_Spec | Owner of the policy file. Usually the person who creates the policy file. |
| Event_Community | Community string that identifies the NMS platform where a trap should be sent. |
| Alarm_Name | Alarm_variable_name:Alarm_oid
This keyword requires two values: the first value is Alarm variable name defined for the policy file. The second value is the Alarm object ID of the variable. |
| Policy_Name | A simple description of the policy file, normally the Alarm variable description. |
| Profile_Name | Possible values are: |
| - system : Alarm variable defined in the policy file is a system MIB variable. | |
| - interface : Alarm variable defined in the policy file is an interface MIB variable. | |
| - etherstats: Alarm variable defined in the policy file is an etherstat MIB variable. | |
| - customized: policy file created from Threshold Manager GUI. | |
| Rising_Event_Type Falling_Event_Type | These two keywords specify what to do when the monitored value across the rising and falling thresholds. Possible values are: |
| - log : device agent should enter an entry to the agent's log table. | |
| - trap: device agent should generate a trap to NMS platform. | |
| - both: all of the above. | |
| - none: none of the above. | |
| Target_Type | Target index to which the defined Alarm variable apply. Possible values are : |
| - sys : this target type applies to MIB variables that do not require any index. | |
| - etherstats : this target type is used for etherstat MIB variables. If the target type is etherstat, Threshold Manager converts an interface id to the matching etherstat index. | |
| - if_mib : this target type applies to mib-II interface MIB variables. Policies with if_mib target type require absolute rising and falling threshold values. | |
| - loc_mib : this target type applies to Cisco interface MIB variables. Policies with if_mib target type require absolute rising and falling threshold values. | |
| - if_util : this target type applies to MIB-II interface utilization MIB variables. Policies with if_util target type require percentage rising and falling threshold values. | |
| - loc_util : this target type applies to Cisco interface utilization MIB variables. Policies with loc_util target type require percentage rising and falling threshold values. | |
| - customized : arbitrary MIB variables which use neither interface nor etherstat index. | |
| Startup_Alarm | Specifies the conditions for an alarm to be sent as a result of the first sample:
- rising : send alarm for rising threshold. - falling: send alarm for falling threshold. - both : send alarm for both rising and falling thresholds. |
| Interface_Threshold | See Interface Specific Policy section. |
|
|