|
|
Table Of Contents
Overview: Examining Data From Sensors
Performing Initial Configuration in Service Monitor for Sensors
Configuring TFTP Servers for Sensor Configuration and Image Files
Setting Up the Sensor Default Configuration
Configuring Sensors in Service Monitor
Understanding the Cisco 1040 Sensor Details Page
Adding a Sensor to Service Monitor
Editing the Configuration for a Specific Sensor
Editing Configurations for Multiple Sensors
Viewing the Configuration for a Sensor
Viewing Details in Service Monitor for a Specific Sensor
Viewing the Configuration File on the TFTP Server from a Sensor
Viewing the Configuration Using the Sensor Web Interface
Understanding How Sensors Register with Service Monitors
Understanding How a Sensor Registers with Service Monitor
Understanding Sensor Failover to a Secondary Service Monitor
Moving a Sensor from One Location to Another
Understanding Sensor Call Metrics Archive Files
Understanding Cisco 1040 Unreachable Trap
Managing Sensors
The following topics are included:
•
Overview: Examining Data From Sensors
•
•
•
•
•
•
•
Overview: Examining Data From Sensors
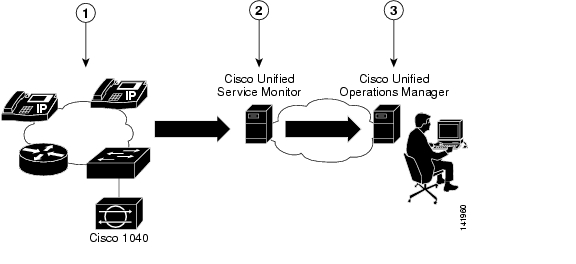
Service Monitor analyzes data that it receives from Cisco 1040 Sensors (Cisco 1040s) installed in your voice network. Each licensed instance of Service Monitor acts as a primary Service Monitor for multiple Cisco 1040s. A Service Monitor can also be configured to act as a secondary Service Monitor for Cisco 1040s that are managed by other licensed instances of Service Monitor. When a Service Monitor becomes unavailable, Cisco 1040s temporarily fail over to secondary Service Monitors until the primary Service Monitor becomes available again.
Service Monitor examines the data it receives from Cisco 1040s, comparing Mean Opinion Scores (MOS)—computed by Cisco 1040s for each RTP stream—against a user-specified threshold value. When MOS drops below the threshold, Service Monitor generates SNMP traps and sends them to up to four trap receivers. Optionally, Service Monitor stores the call metrics it receives from Cisco 1040s to disk files.
To further analyze, display, and act on Service Monitor data, you can use Cisco Unified Operation Manager (Operations Manager), by configuring it as a trap receiver for Service Monitor. Operations Manager can generate events for Service Monitor traps, display the events on the Service Quality Alerts dashboard, and store and display event history. For more information, see User Guide for Cisco Unified Operations Manager.
Figure 4-1 shows Service Monitor and Cisco 1040s installed with Operations Manager.
Figure 4-1 Service Monitor Deployment
For more information, see the following topics:
•
•
Performing Initial Configuration in Service Monitor for Sensors
To configure sensors, do the following:
1.
2.
3.
Service Monitor copies sensor configuration files to each TFTP server that you configure. When a sensor connects to the network, it downloads a configuration file from a TFTP server before registering to a service monitor. For more information, see Understanding How a Sensor Registers with Service Monitor.
Configuring TFTP Servers for Sensor Configuration and Image Files
Service Monitor uses one or more TFTP servers to provide configuration files and binary image files for sensors. You must define at least one TFTP server for Service Monitor to use. You can configure additional TFTP servers either as backup or if you have more than one DHCP scope.
After you add or edit a sensor, Service Monitor updates the configuration file locally, on its server, before copying the configuration file to all known TFTP servers. Keeping copies of the configuration files on each TFTP server enables sensors to fail over efficiently to a secondary Service Monitor.
You can use the configuration files that Service Monitor keeps on the server to recover if there is a write failure on the TFTP server. In this case, you can manually copy configuration files from Service Monitor to each TFTP server that is configured for Service Monitor. (To verify the contents of a configuration file on the TFTP server, see Viewing the Configuration File on the TFTP Server from a Sensor.)
You must copy the binary image file for sensors to each TFTP server that you add to Service Monitor; see Copying the Binary Image File to the TFTP Server.
Step 1
Adding a TFTP Server
To enable sensors to register with Service Monitor, you must define at least one TFTP server where Service Monitor can provide sensor configuration files. You can configure additional TFTP servers; for example, to serve as backup or if you have more than one DHCP scope.
Note
Step 1
Step 2
Step 3
•
•
Step 4
Note
Copying the Binary Image File to the TFTP Server
Step 1
Deleting a TFTP Server
Step 1
Step 2
Step 3
Step 4
Setting Up the Sensor Default Configuration
Use this procedure to:
•
•
•
Step 1
Step 2
Call Metrics Archiving radio buttons
Select one of the following:
•
•
Default: Disable.
Data File Directory
Directory where files are stored if call metrics archiving is enabled. You cannot edit this field.
Note
Image File Directory
Directory where sensor binary image file and configuration files are stored locally: NMSROOT/ImageDir—NMSROOT is the directory where Service Monitor is installed; its default location is C:\Program Files\CSCOpx.
You cannot edit this field.
Send traps every n minutes per endpoint
Enter a number greater than or equal to 5. Sensors send data to Service Monitor every 60 seconds. Service Monitor determines whether a violation has occurred and can potentially send a trap-a-minute for each endpoint. Use this setting to reduce the number of traps that Service Monitor sends for each endpoint. For a given endpoint, a trap is sent every n minutes and additional traps during that time are suppressed (not sent).
Image Filename
Enter the image filename if you are using a new image (for example, after a product upgrade).
Primary Service Monitor
IP address or DNS name for the primary Service Monitor.
Secondary Service Monitor
IP address or DNS name for the secondary Service Monitor; blank if not set. (See Editing the Configuration for a Specific Sensor.)
Step 3
Note
Configuring Sensors in Service Monitor
Note
The following information is available for managing Cisco 1040s:
•
•
•
•
Understanding the Cisco 1040 Sensor Details Page
Step 1
Exports data from the Cisco 1040 Sensor Details page to a CSV or PDF file. See Exporting Data to a CSV or PDF File.
Opens a printer-friendly version of the data in another window; for printing from a browser window.
Check box column
Select Cisco 1040s that you want to edit, reset, or delete.
Name column
Click the name link to view details of the Cisco 1040 configuration. See Viewing Details in Service Monitor for a Specific Sensor.
Sensor Address columns
Displays MAC and IP addresses for Cisco 1040. Click the MAC address link to launch an HTML page on the Cisco 1040. (See Viewing the Configuration Using the Sensor Web Interface.)
Service Monitor columns
Displays the following:
•
•
•
Note
Reset Time column
The last date and time the Cisco 1040 was rebooted.
Edit button
Click to edit the Cisco 1040 configuration. See Editing the Configuration for a Specific Sensor.
Restarting Processes to Update Sensor Registration Information in Service Monitor
Service Monitor might show a Cisco 1040 waiting to register while receiving and processing syslogs from it; this problem can occur after a user does one of the following:
•
1.
pdterm QOVR2.
3.
pdexec QOVR•
Net stop crmdmgtdNet start crmdmgtdExporting Data to a CSV or PDF File
After you click the export icon, a dialog box appears.
Step 1
Step 2
Adding a Sensor to Service Monitor
If a sensor is already registered with Service Monitor, you must select it and click the Edit button to update it. For more information, see Editing the Configuration for a Specific Sensor.
Step 1
Step 2
Step 3
Sensor Name
Enter up to 20 characters. This name is used on Service Monitor windows, such as reports.
Note
Image File Name
Enter the binary image filename. The filename format is SvcMonAA2_nn.img where nn is a revision number. For the name of the most recently supported binary image file, see Release Notes for Cisco Unified Service Monitor 2.0.1. For more information, see Viewing the Configuration Using the Sensor Web Interface.
MAC Address
Enter the MAC address for the Cisco 1040 that you are adding.
Primary Service Monitor
Enter an IP address or DNS name of a host where Service Monitor is installed. The Cisco 1040 sends data to this Service Monitor unless it becomes unreachable.
Secondary Service Monitor
(Optional) Enter an IP address or DNS name of a host where another instance of Service Monitor is installed. The Cisco 1040 sends data to this Service Monitor only if the primary Service Monitor becomes unreachable. For more information, see Viewing the Configuration Using the Sensor Web Interface
Description
Enter up to 80 characters.
Step 4
Note
Editing the Configuration for a Specific Sensor
If you want to update the configurations for multiple sensors—for example, so that they all use a new binary image file or a different primary or secondary Service Monitor—see Editing Configurations for Multiple Sensors.
Note
Use this procedure to update the configuration, including the sensor name and description, for a single sensor.
Step 1
Step 2
Step 3
Sensor Name
If you want to change the name, enter up to 20 characters. This name is used on Service Monitor windows, such as reports.
MAC Address
Cisco 1040 MAC address.
Note
IP Address
Cisco 1040 IP address.
Note
Image File Name
Enter the binary image filename. The filename format is SvcMonAA2_nn.img where nn is a revision number. For the name of the most recently supported binary image file, see Release Notes for Cisco Unified Service Monitor 2.0.1. For more information, see Viewing the Configuration Using the Sensor Web Interface.
Primary Service Monitor
Enter an IP address or DNS name of a host where Service Monitor is installed. The Cisco 1040 sends data to this Service Monitor unless it becomes unreachable.
Secondary Service Monitor
(Optional) Enter an IP address or DNS name of a host where Service Monitor is installed. The Cisco 1040 sends data to this Service Monitor only if the primary Service Monitor becomes unreachable.
Description
Enter up to 80 characters.
Step 4
Note
Editing Configurations for Multiple Sensors
If you need to update the configuration for a single sensor only, see Editing the Configuration for a Specific Sensor.
Note
Step 1
Step 2
Step 3
Image File Name
Enter the binary image filename. The filename format is SvcMonAA2_nn.img where nn is a revision number. For the name of the most recently supported binary image file, see Release Notes for Cisco Unified Service Monitor 2.0.1. For more information, see Viewing the Configuration Using the Sensor Web Interface.
Primary Service Monitor
Enter an IP address or DNS name of a host where Service Monitor is installed. The Cisco 1040 sends data to this Service Monitor unless it becomes unreachable.
Secondary Service Monitor
(Optional) Enter an IP address or DNS name of a host where Service Monitor is installed. The Cisco 1040 sends data to this Service Monitor only if the primary Service Monitor becomes unreachable.
Step 4
Note
Resetting Sensors
Use this procedure to boot one or more Cisco 1040s. After a Cisco 1040 boots, it first uses DHCP to obtain the IP address of the TFTP server. From the TFTP server, Cisco 1040 obtains a configuration file. If the configuration file specifies a binary image file that is different from the currently installed image, Cisco 1040 also obtains the binary image file from the TFTP server.
Step 1
Step 2
Step 3
Note
Deleting a Sensor
Note
Before you delete a sensor, consider how the sensor will be used in the network. Use the information in Table 4-1 to decide whether to delete the sensor and to determine whether you must perform additional actions.
Table 4-1 Considerations and Actions Before Deleting a Sensor
Another instance of Service Monitor
One of these:
•
•
Ensure that the sensor is communicating with the other instance of Service Monitor—the primary receiver—before you delete the sensor.
Note
Another instance of Service Monitor
This Service Monitor
Do not delete the sensor from this Service Monitor. Otherwise, failover is delayed until a user manually adds the sensor to this Service Monitor.
None
None
Before you delete the sensor, you must shut the switch port that physically connects to the 10/100-1 Fast Ethernet port on the sensor:
1.
2.
Note
You should also either shut or reconfigure the SPAN or RSPAN destination port on the switch. For information about configuring SPAN and RSPAN on Cisco Catalyst switches and modules, see http://www.cisco.com/en/US/products/hw/switches/ps708/
products_tech_note09186a008015c612.shtml.
Before you complete this procedure, delete the sensor from any sensor threshold groups. See Editing a Sensor Group, page 5-10.
Step 1
Step 2
Step 3
•
•
Step 4
Viewing the Configuration for a Sensor
Configuration data for a Cisco 1040 Sensor is stored in Service Monitor, is copied to a configuration file for the sensor on each TFTP server, and is copied down to the sensor (the sensor downloads the configuration from the TFTP server). You can look at the configuration details that are stored for a Cisco 1040 Sensor on each point: Service Monitor, TFTP server, and the sensor itself:
•
•
•
Viewing Details in Service Monitor for a Specific Sensor
To open the Cisco 1040 Sensor Detail dialog box, click the name link on the Cisco 1040 Sensor Details page. The Cisco 1040 Sensor Detail dialog box displays the Cisco 1040 Sensor Information table described here.
Exports data from the Cisco 1040 Sensor Information table to a CSV or PDF file. See Exporting Data to a CSV or PDF File.
Opens a printer-friendly version of the data in another window; for printing from a browser window.
Opens context-sensitive online help.
Name link
Cisco 1040 user-entered name—Click to open a web interface on the Cisco 1040. See Viewing the Configuration Using the Sensor Web Interface.
MAC Address
Cisco 1040 MAC address.
IP Address
Cisco 1040 IP address.
Primary Service Monitor
IP address or DNS name for the primary Service Monitor.
Secondary Service Monitor
IP address or DNS name for the secondary Service Monitor; blank if not set. (See Editing the Configuration for a Specific Sensor.)
Registered with
IP address or DNS name for the Service Monitor that this Cisco 1040 is registered with.
Image File Name
Name of the image file installed on the Cisco 1040.
Note
Last Reset Time
Date and time that the Cisco 1040 was last reset. (See Resetting Sensors.)
Description
User-entered description for the Cisco 1040. (See Editing the Configuration for a Specific Sensor.)
Viewing the Configuration File on the TFTP Server from a Sensor
Step 1
http://Cisco-1040-sj/CommunicationStep 2
•
•
•
•
•
•
•
Viewing the Configuration Using the Sensor Web Interface
To use the web interface to view the contents of the configuration file for this Cisco 1040 on the TFTP server, see Viewing the Configuration File on the TFTP Server from a Sensor.
You can open a web interface to view the information stored on a Cisco 1040 in one of the following ways:
•
•
The Cisco 1040 web interface displays a Cisco 1040 Information window with the following information:
•
•
•
•
–
–
•
•
•
•
•
•
Understanding How Sensors Register with Service Monitors
After you have configured a default sensor configuration file, QOVDefault.CNF, sensors can register with Service Monitor automatically. When a sensor registers automatically, Service Monitor uses the information in the default configuration file and creates a MAC-specific configuration file, QOVmacaddress.CNF, for the newly registered sensor. After a default sensor configuration file is created, if you want to add a sensor to Service Monitor manually, do so before plugging the sensor in.
After it is connected to a switch, a Cisco 1040 uses DHCP to obtain the IP address of the TFTP server. The Cisco 1040 checks the TFTP server for a configuration file, using the first of the following files that it finds:
•
•
Understanding How a Sensor Registers with Service Monitor
A newly connected sensor registers to a Service Monitor using a specific configuration file for that sensor, QOV<MAC address>.CNF or using the default configuration file, QOVDefault.CNF. If using the default configuration file, from it, Service Monitor creates a MAC-specific configuration file, QOV<MAC address>.CNF, for the sensor.
There can be only one default configuration file on the TFTP server. The default configuration file specifies the primary Service Monitor. Therefore, sensors that use same TFTP server also use the same default configuration file and register with the same primary Service Monitor.
Understanding Sensor Failover to a Secondary Service Monitor
A Cisco 1040 sends keepalive messages to the Service Monitor to which it is registered and receives acknowledgements from the Service Monitor. After sending three keepalives without receiving any acknowledgement, a Cisco 1040 starts a failover process to a secondary Service Monitor:
1.
2.
3.
4.
Moving a Sensor from One Location to Another
Warning
Step 1
Step 2
Step 3
Note
Understanding Sensor Call Metrics Archive Files
Service Monitor stores the data it receives from Cisco 1040s in the database, where it remains available for reports for a number of days; for more information, see Configuring and Viewing Other Settings. Service Monitor can also save the data to files in a directory on the server if you have enabled call metrics archiving. To enable or disable call metrics archiving, see Setting Up the Sensor Default Configuration.
Service Monitor creates a new data file daily at midnight. The data filename is QoV_YYYYMMDD.csv where YYYY is the 4-digit year, MM is the two-digit month and DD is the two-digit day. For example, QOV_20061101.csv is a data file for November 1, 2006. Service Monitor also backs up data files that exceed a size limit and deletes older data files; for more information, see Understanding Sensor Archive File Purging, page 6-7.
You can use the data for further analysis or you can disable archiving. (Service Monitor does not send the archived data to other applications.) Table 4-2 lists the format for call metrics data files.
Note
Understanding Cisco 1040 Unreachable Trap
When a Service Monitor stops receiving keepalives from a Cisco 1040 that is registered to it, the Service Monitor generates a Cisco 1040 Unreachable SNMP trap. The Service Monitor sends this trap to up to four recipients. For more information, see Setting Up the Sensor Default Configuration and MIBs Used and SNMP Traps Generated, page C-1.
Note
For information on Unified Communications Manager reachability, see Understanding Last Contact Status and When to Verify Credentials.
![]()
![]()
![]()
![]()
![]()
![]()
![]()
![]()
Posted: Fri Aug 31 12:45:43 PDT 2007
All contents are Copyright © 1992--2007 Cisco Systems, Inc. All rights reserved.
Important Notices and Privacy Statement.