|
|

This chapter provides information about using the NetFlow FlowAnalyzer to view collected data. The FlowAnalyzer enables you to display detailed traffic statistics from selected routers.
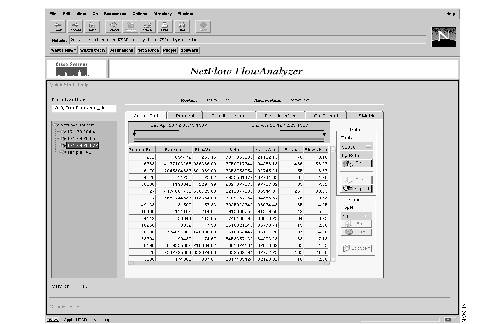
The FlowAnalyzer displays summarized data from the NetFlow FlowCollector (see Figure 3-1). You can view the summarized data by choosing from a variety of formats and displaying the data in graphs or charts.

On the left side of the FlowAnalyzer display, the Data Location field shows a path name for collection files. This is the path name that you specified in the HTML file when you installed the FlowAnalyzer. If you have more than one collector running, you can enter a new path name used by a different collector process.
Below the Data Location field is a list of NetFlow routers, each one identified by either its IP address or its textual alias. Router aliases are defined in the file
/opt/CSCOnfa/NFAServer/imported_files/Router_aliases.txt
For more information about router aliases, refer to the chapter entitled "Installing and Setting Up the NetFlow FlowAnalyzer."
You can display collected data for a router in a variety of formats, including graphs and charts. From the Data area, click on the Get, Sort, or Export button to retrieve data. From the Chart area, click on the Bar, Pie, or Scatter button to display the data.
To retrieve collected data perform the following steps:
Step 1 In the Data Location field, enter the data path that contains the collected data you would like to analyze. Press Return.
Step 2 Select a router from the NetFlow Routers tree structure (located below the Data Location field). The display shows the aggregation schemes available for the selected router.
Step 3 Select an aggregation scheme by clicking its corresponding tab.
Step 4 Select a specific period of time to display by moving the Start time arrowhead (left arrowhead) and the Stop time arrowhead (right arrowhead).
Step 5 Select from the Data area the number of data entries you would like to display by clicking on the Top N choice box. (The default value is 100.)
Step 6 Select how the data is sorted using the by Byte choice box. You can also sort by Packet or by Flows. (The default is by Byte.)
Step 7 Click the Get button to retrieve the collected data. The data is displayed in tabular format. You can sort this data and then display it as a graph or chart, or export the data to a file.
To sort the collected data, perform either one of the following options:
Option 1: Click the heading for the data column that you would like to sort, then click the Sort button.
Option 2: Double-click on the data column heading that you would like to sort.
Nonnumeric data is sorted in ascending order (alphabetically), and numeric data is sorted in descending order.
To export collected data to a spreadsheet file, perform the following steps:
Step 1 Click the Export button to save the collected data to a spreadsheet file.
Step 2 Enter the filename and click the OK button to begin exporting the data.
The filename used is the first nonspaced word entered. For example, if you enter the filename
"my new data" the spreadsheet file name used is "my.CSV," ignoring any characters after the first space.
The files exported from the AnalyzerDisplay are located in the /opt/CSCOnfa/NFAServer/exported_files directory, where the DisplayServer is running. The following output shows a typical directory location for exported files:
/opt/CSCOnfa/NFAServer/exported_files or
{DisplayServerBaseDir}/exported_files
Graph the collected data as a bar chart, bar graph, pie chart, or scatter graph.
To display a bar graph for the collected data, perform the following steps:
Step 1 Click the heading for the data column that you would like to display.
Step 2 Select from the Chart Area the TopN data entries to be graphed.
Step 3 Click the Bar button to display the TopN data entries in a summary graph.
To display a pie chart for the collected data, perform the following steps:
Step 1 Click the heading for the data column that you would like to display.
Step 2 Select from the Chart Area the Top N data entries to be graphed.
Step 3 Click the Pie button to display the TopN data entries in a pie chart.
To display a scatter graph for the collected data, perform the following steps:
Option 1: Select a row then select the data column to identify the specific data cell that you would like to graph, then click the Scatter button to display that specific data cell in a scatter graph.
Option 2: Double-click on the specific data cell that you would like to display in a scatter graph.
The aggregated data for a selected router is organized into tables that have many columns, and those tables are labelled with tabs. Table 3-1 lists the names of the tables and briefly summarizes each table's contents.
Table 3-2 shows that protocol ports are defined differently depending upon the direction of traffic flow.
| Direction of Flow | Assignment of Port Numbers |
|---|---|
| Source to Destination | The well-known port numbers defined in RFC 1700, October 1994. |
| Destination to Source | An arbitrary number assigned by the host to identify the session. (This number may accidentally fall in the range of registered ports defined in RFC 1700, so it is not a guaranteed diagnostic that the direction of flow is from the destination to the source.) |
|
|