|
|

This chapter tells you how to use the Display module of the NetFlow FlowAnalyzer application.
The Display module provides a graphical user interface (GUI) for one or more instances of the NetFlow FlowAnalyzer application installed and running in your network.
The Display module enables you to display NetFlow data that has been exported from Cisco NetFlow-enabled devices in your network and stored on one or more designated FlowCollector workstations in your network.
This stored NetFlow data is readily accessible by one or more DisplayServer modules running on host workstations in your network, thereby enabling each such module to service requests for NetFlow data issued by a user at the console of a Display module.
This chapter contains the following sections:
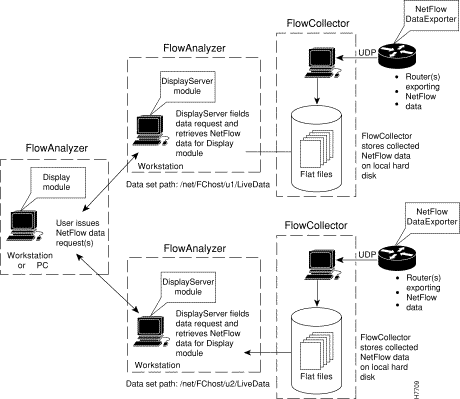
The generic NetFlow system processes are illustrated in Figure 3-1 and described below:
1. Cisco NetFlow-enabled devices in the network export NetFlow data to a designated FlowCollector workstation in the network.
2. The FlowCollector stores the exported NetFlow data locally on its hard drive according to the following directory hierarchy:
(a) Date
(b) Router name
(c) Aggregation scheme
3. Using the Display module on a host workstation or PC, the user issues a request for NetFlow data.
4. The DisplayServer module, running on a host workstation in the network, services the user's request for NetFlow data by retrieving the desired data from the specified directory on the appropriate FlowCollector workstation and transmitting the data to the Display module.
5. The Display module presents the NetFlow data on the workstation or PC screen in the format of the selected aggregation scheme.
As implied by Figure 3-1, you can have multiple instances of the FlowCollector application and the FlowAnalyzer application running on separate hosts in the network. Although this is not specifically indicated in Figure 3-1, you can also have multiple instances of the Display module running on separate workstations or PCs in your network.
In operational terms, Figure 3-1 shows a load-sharing arrangement in which a single Display module running on a host can be used to initiate Display module commands pertaining to NetFlow data stored on different FlowCollector workstations.
For instructions on starting all the modules in the FlowAnalyzer application, including the Display module, see the section entitled "Starting the FlowAnalyzer" in Chapter 2.
If the three server modules of the FlowAnalyzer application (the UtilityServer, the TrawhoisServer, and the DisplayServer) are already running on your FlowAnalyzer workstation, see the section entitled "Starting the Display Module" in Chapter 4 for instructions on starting the Display module.
The term "data set path," as used throughout this document, refers to a FlowCollector workstation directory in the network in which raw NetFlow data has been collected and stored for data analysis purposes. Several such directories can exist in your network, depending on how many FlowCollector workstations have been configured to collect NetFlow data.
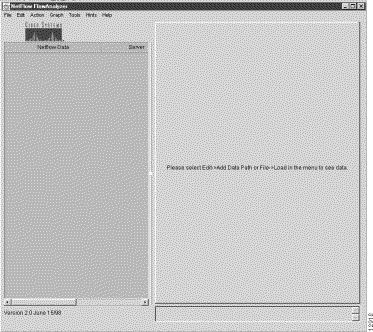
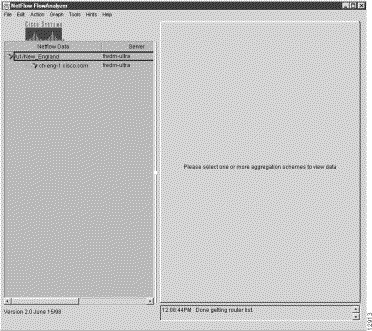
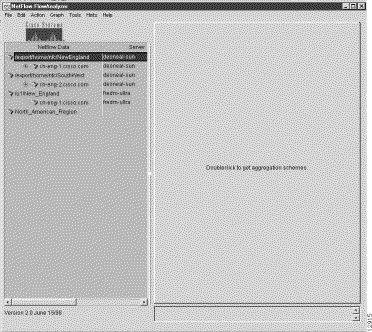
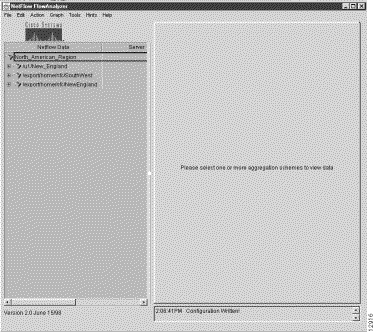
At initial startup, the main Display module window comes up in a "clean" form on your host workstation or PC screen, as shown in Figure 3-2.
Note from the message in the center of the main display area that the system expects you to define a data set path, or to load a file containing one or more previously-defined data set paths, as the basis for user interaction with the system. Without such a data set path, the FlowAnalyzer has no framework for acting on user commands issued at the console of the Display module.
The purpose of this section is to fully acquaint you with the role of data set paths in the NetFlow system and to tell you how these directory constructs are used to support the functionality of the system.
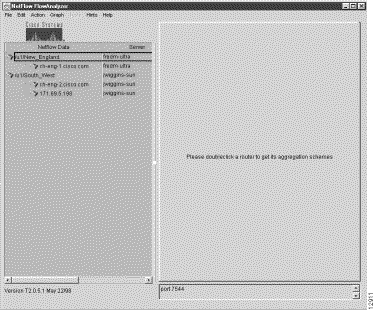
The Netflow Data area of the Display module window (see Figure 3-2) provides the necessary "real estate" in the Display module window for defining and selecting data set path(s) of interest for FlowAnalyzer operations. Therefore, you must first populate this area of the Display module window with one or more data set paths as a necessary first step before issuing any Display module commands.
Then, by selecting a particular data set path and issuing appropriate Display module commands, you can access the specified directory of a FlowCollector workstation to retrieve and display desired NetFlow data for a particular network router.
One or more such data set paths constitute what is referred to throughout this chapter as the "data tree structure." Once you have defined such a data tree structure and loaded it into the Netflow Data area, it remains in effect until you overtly change it for some reason, such as defining a new data set path, changing or deleting an existing data set path, or grouping existing data set paths into a named router group.
A data tree structure consists of the following elements:
(a) Directory name—This element always appears at the left margin (root level) of the Netflow Data area. It identifies a FlowCollector workstation directory known to contain NetFlow data. A typical directory name, for example, might be "/u1/LiveNFD."
(b) Devices—These elements always appear at the first indent of the tree structure in the Netflow Data area. Each such entry identifies a NetFlow-enabled device in the network for which NetFlow has been collected.
(c) Device interfaces and aggregation scheme(s)—Subsequent indents in the tree structure beyond the first indent identify the router interfaces, if known, and the aggregation schemes for which NetFlow data has been collected.
You can select any aggregation scheme from those listed in the Netflow Data area as the basis for Display module commands. You can also select multiple aggregation schemes of the same type across multiple routers in the Netflow Data area as the basis for Display module commands. In this case, the resulting NetFlow data array for each aggregation scheme appears one below another in the Display module window, necessitating the use of the scroll bars in the Display module window to view all regions of the data array.
A typical data tree structure is shown in Figure 3-2.
Note that the tree structure in the Netflow Data area can consist of several data set paths. Furthermore, each such path incorporates the elements described above.
If the number of data set paths that you add to the Netflow Data area exceeds the boundaries of the window, scroll bars appear in the window automatically. You can use these scroll bars to bring all regions of the Netflow Data area into view.
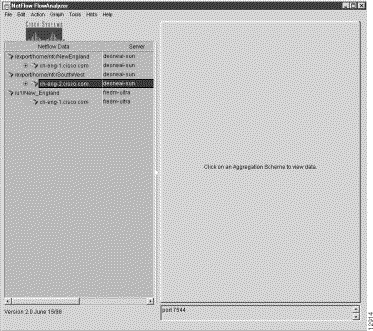
Note from Figure 3-3 that a "Server" area abuts the Netflow Data area. This Server area identifies the DisplayServer workstation that will be used to service NetFlow data requests for the associated data set path listed opposite in the Netflow Data area.
By means of the square sizing icon in the right margin of the Netflow Data area, you can shrink the size of this Server region to eliminate it from view altogether, thereby optimizing the space available in the Display module window for viewing NetFlow data.
To change the size of the Server area in either horizontal direction, place the mouse pointer over the sizing icon, causing crosshairs to appear. While holding down the left mouse button, drag the margin of the window to the desired position.
Once you are familiar with the general layout of the Display module window and have gained a general understanding of data set paths and their role in the NetFlow system, you are now prepared to populate the Netflow Data area with a working data tree structure, as described in the following section.
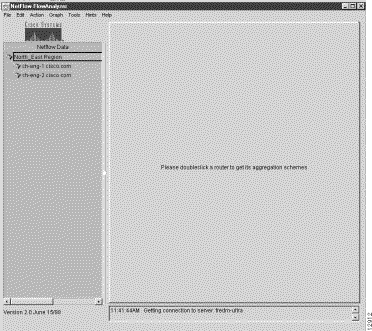
To retrieve and analyze NetFlow data on initial startup of the Display module, you must know beforehand the data set path (the specific UNIX directory) for the particular FlowCollector workstation in which the desired NetFlow data is known to be stored. You must then add this data set path manually to the Netflow Data area.
The data set path shown in Figure 3-4 is intended for illustrative purposes only and should not be taken as a valid tree structure for your netFlow data analysis purposes. The data set paths that you enter into the Netflow Data area must reference live directories of FlowCollector workstations that you know contain the data of interest.
Once you have entered a working tree structure appropriate to your current Display module session, you can select any router or aggregation scheme in the tree structure as the basis for issuing Display module commands.
On startup of the Display module, you have complete flexibility to add data set paths to the Netflow Data area as a framework for current data analysis requirements. Then, as your needs change from day-to-day, or from one Display module session to another, you can perform the following tasks at will:
To add a desired data set path to the Netflow Data area, perform the following steps:
Step 1 From the Display module pull-down menu, select the Edit, Add Data Path function.
A pop-up window labeled "New Data Location" appears, as shown below.
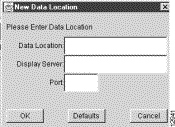
Step 2 In the fields of this pop-up window, enter the appropriate information to define the desired data set path, as follows:
(a) Data Location:—This field identifies the FlowCollector workstation directory (/u1/New_England, for example) that you know contains the desired NetFlow data.
This directory path must be defined in a form that makes the directory accessible by the DisplayServer. That is, if you logged into the DisplayServer host identified in (b) below, you should be able to access the /u1/New_England directory.
(b) Display Server:—This field identifies the host FlowAnalyzer workstation (fredm-ultra, for example) that is running an instance of the DisplayServer.
Such a workstation can be identified either by its logical name (fredm-ultra) or its IP address.
This is the DisplayServer module that will service user requests pertaining to NetFlow data stored in the directory specified in (a) above.
(c) Port:—This is the port used by the DisplayServer module specified in (b) above (7544, for example) in servicing user requests for NetFlow data.
This port will be used by the DisplayServer module to listen for NetFlow data processing commands.
Step 3 When you complete the fields of this pop-up window, as shown below, click on OK.
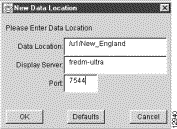
This step causes the specified data set path to be added to the Netflow Data area, as shown in Figure 3-5.
By means of this procedure, you can add any number of data set paths one at a time to the Netflow Data area.
For conservation of space in the Netflow Data area, it is recommended that you add only those data set paths that are appropriate to your current Display module session.
As noted in the preceding section, it is possible to add any number of data set paths to the data tree structure in the Netflow Data area. Such paths may encompass routers of the following types, depending on your particular NetFlow data analysis requirements and interests:
In the face of this diversity in router types in the network and their likely dispersion within the network, the Display module enables you to define a named router group that reflects the breadth and scope of your particular network management realm.
The advantage in assigning routers to one or more named logical groups is that you can establish a working set of tree structures that, in any given instance, can be loaded into the Netflow Data area, as appropriate, to serve as the basis for a current Display module session.
Hence, a named router group encompasses only those network routers of specific applicability to a particular or anticipated network management task.
This approach in defining working data tree structures not only conserves space in the Netflow Data area (since you can load and remove named router groups at will), but also provides certain operational conveniences and efficiencies in issuing Display module commands.
Once you have added any number of desired data set paths individually to the Netflow Data area, you can select any number of routers listed therein and assign them to one or more named logical groups. Note also that a named router group can be nested, that is, it can contain one or more named router groups.
It is important to note that assigning a router to a named logical group does not remove that router from its original lineup in an existing data tree structure. In other words, it is possible for a router to be assigned to one or more logical groups without disrupting its standing linkage to a parent FlowCollector workstation directory, regardless of where that directory resides in your network. Thus, for all NetFlow data processing functions, the integrity of any given data set path is preserved.
To assign a router, or routers, to a named logical group, perform the following steps:
Step 1 First, populate the Netflow Data area with any number of data set paths. In doing so, include those data set paths that encompass the routers of interest that you want to assign to the named router group.
In populating the Netflow Data area, you have the following options:
(a) If this area is already populated with a valid data tree structure (such as that shown in Figure 3-6) from which you wish to create a named router group, go directly to Step 2.
(b) Add any number of data set paths individually to the Netflow Data area through successive uses of the Edit, Add Data Path function of the Display module pull-down menu.
The procedure for using this function is described in the section entitled "Adding Data Set Paths to the Netflow Data Area".
Presumably, such data set paths include those routers that you wish to assign to the named router group.
(c) Use the File, Load function of the Display module pull-down menu to load a previously defined and named tree structure into the Netflow Data area.
The procedure for using this function is described in the section entitled "Loading a Named Tree File".
As in (b) above, this tree structure should also contain the routers that you wish to assign to the named router group.
Step 2 Select the File, Add Router Group function from the Display module pull-down menu. This causes the Set Group Name pop-up window to appear, as shown below.
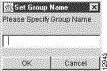
Step 3 In this pop-up window, enter a router group name of your choice (such as North_American_Region, for example).
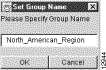
Step 4 Click on OK.
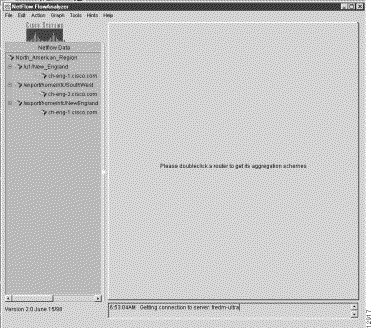
"North_American_Region" then appears as the router group name at the bottom of the Netflow Data area, as shown in Figure 3-7.
Step 5 Using the data set paths already present in the Netflow Data area, drag the desired data set paths one at a time into the router group named North_American_Region.
To do so, click on the desired router to highlight it. While holding down the left mouse button on the selected data set path, drag it into the router group.
Repeat this step as many times as necessary to compose the router group.
For purposes of this step, assume that you want to drag all three existing data set paths into the named router group.
Step 6 After composing the new router group, the following housekeeping options apply regarding the original data set paths still remaining in the Netflow Data area:
(a) You can leave them intact if you have a need for them in your current Display module session.
(b) You can remove them to conserve screen space in the Netflow Data area.
Step 7 If you choose option (b), remove each data set path through successive uses of the Edit, Remove Router Or Group pull-down function of the Display module menu.
To do this, highlight a given data set path that you want to delete; click on the Edit, Remove Router Or Group menu item. This action causes the following pop-window to appear.
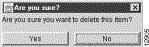
This window asks you to confirm your intent to delete the selected data set path. Click on Yes (or No), as appropriate.
Repeat this step as many times as necessary to establish the desired working tree structure in the Netflow Data area.
Step 8 Once you have "cleaned up" the Netflow Data area to show only the desired tree structure, it is much to your advantage to save this structure to a file that you can load at any time thereafter as the basis for a Display module session.
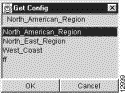
To save the existing tree structure to a file, select the File, Save function from the Display module pull-down menu. This action causes the Configs pop-up window to appear, as shown below.
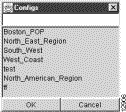
Enter a name of your choice in the blank field at the top of the window (such as "North_American_Region" for purposes of this step) by which to save the tree file.
The Configs pop-up window then takes on the following appearance.
Step 9 Click on OK in the pop-up window to save the file.
On completion of this procedure, the Netflow Data area contains the named router group shown in Figure 3-8 and the tree file named North_American_Region exists on the DisplayServer host (which is configured as defined in the /opt/CSCOnfa/bin/start.Display file).
In general, the advantage realized from creating and loading a tree file is to avoid the manual task of adding data set paths to the Netflow Data area for each Display module session.
Once you have created and saved one or more tree files, as described in the preceding sections, the following loading options become available:
The data tree structure that you load into the Netflow Data area on startup remains in effect until you overtly delete it or replace it with another data set path or named router group.
In all instances, you have complete flexibility to define data set paths or router groups to populate the Netflow Data area with a working tree structure that meets your current operational needs.
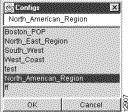
When you want to work with a data tree structure that is different from that currently being displayed, you can select the File, Load function from the Display module pull-down menu, causing a Configs pop-up window to appear (see Step 1 below).
Click on the name of the tree file listed therein that you want to load. This causes the name of the tree file to appear in the filename field at the top of the window. Click on OK to load the file, thus overwriting the existing tree structure in the Netflow Data area. Note that you can also double-click on the name of the file to load it.
For the following procedure, it is assumed that you have created one or more tree files and that you want to load a particular one in preparation for a Display module session.
To load a previously defined tree file, perform the following steps:
Step 1 Select the File, Load function from the Display module pull-down menu.
A Configs pop-up window appears, listing the currently-defined tree files available for selection, as shown below.
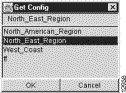
Note that this pop-up window comes up showing the name of the tree file currently in effect. If you want to load a different a tree file, continue with the next step.
Step 2 From those tree files listed in the Configs pop-up window, click on the name of the file that you want to load.
For purposes of this step, assume that you want to load the tree file named North_American_Region. Click on the name of this file.
This action causes the name of this tree file to appear in the field at the top of the pop-up window, as shown below.
Step 3 Click on OK.
This action causes the tree structure in the file named North_American_Region to be loaded into the Netflow Data area, as shown in Figure 3-9.
Note that this tree structure consists of three routers in a named router group, namely, North_American_Region, thus validating the concepts and actions described in the earlier section entitled "Creating a Named Router Group and Saving It to a File."
With a working data tree structure loaded into the Netflow Data area in this manner, you are now positioned to issue a wide variety of Display module commands at the console of your host Display module workstation or PC.
Before proceeding, however, it is to your advantage to be familiar with the NetFlow data aggregation schemes that provide the basis for all NetFlow-related functions. These NetFlow aggregation schemes are described in the next section.
This section covers the following topics:
As noted earlier, the NetFlow system gives you access to a broad range of traffic information that has been exported from Cisco NetFlow-enabled devices and "cataloged" into several pre-defined aggregation schemes.
Both the number and type of aggregation schemes available for display purposes in a NetFlow operating environment is a function of how the FlowCollector has been configured to operate in your network.
The aggregation schemes used in the NetFlow system are listed and described in Table 3-1.
| Aggregation Scheme | "Key" Column Label | Description of Key |
|---|---|---|
Source | The IP address of the host from which the measured traffic originates. | |
Destination | The IP address of the host to which the measured traffic is delivered. | |
Source | The source node and destination node pairs for the measured traffic flow. Includes the IP address at each end of the measured flow. | |
Protocol | The protocol used for the network traffic flow that is being summarized in the "metrics" (counters and rates) columns of the aggregation scheme data array. The protocols in this aggregation scheme are defined in the FlowCollector's "nfknown.protocols" file. | |
Destination | The IP address of the destination host, the source and destination protocol port numbers, and the transport protocol used for the measured traffic. | |
Source | The IP address of the source host, the source and destination protocol port numbers, and the transport protocol used for the measured traffic. | |
Source | The source node and destination node pair for the measured traffic flow. Includes the source host and destination host IP addresses, the protocol port numbers at both endpoints of the flow (SrcPort and DestPort), and the transport protocol used for the flow. | |
Source | The source node and destination node pair for the measured traffic flow. Includes the source host and destination host IP addresses, the input interface and output interface information for the end points (either the ifIndex value or MIB description), and the IP address of the next hop router. | |
SrcPort | The protocol port on the source host from which the measured traffic flow originates. | |
DestPort | The protocol port on the destination host to which the measured traffic flow is delivered. | |
Source AS | The source AS (autonomous system) destination of the measured traffic flow. | |
Source | The source and destination IP addresses, the source and destination autonomous systems, the source and destination protocol ports, and the transport protocol of the measured traffic flow. This aggregation allows you to "drill down" to show more detailed data on each traffic flow. | |
Masked Source | The longest match in the routing table to the source IP address (masked source IP address), the number of significant bits in the masked source address, the longest match destination IP address (masked destination IP address), and the number of significant bits in the masked destination IP address. | |
Source | The source and destination IP addresses, the duration of call activity, and the counts of records, packets, bytes, and flows. The six standard "metrics" columns are not included in this aggregation scheme data array. The data categories in the CallRecord are: ActiveTime, Records, Packets, Bytes, and Flows. ActiveTime is the sum of the duration (hold time) of all calls, derived from the time of the first in the flow and last packet in the flow. The IP address * is a mask that functions as a wildcard address. |
Each aggregation scheme differs from another in both format and content. Each scheme contains a coherent set of traffic information that has been sorted and tailored in a way that helps you to accomplish a particular network management task or to address a particular type of network problem.
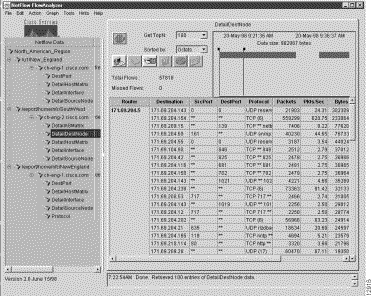
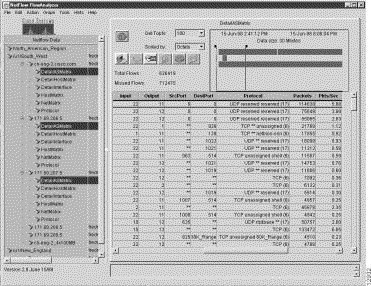
Figure 3-10 shows a sample display for a DetailDestNode aggregation scheme that is based on the same tree file used for purposes of Figure 3-9, namely, the tree file for the named router group called North_American_Region.
Note, however, that the tree structure in Figure 3-10 has been fully expanded in the Netflow Data area to show all elements of the tree structure for the named router group.
The resulting NetFlow data that appears in the Display module window for this particular aggregation scheme consists of numerous columns and rows arranged in spreadsheet-like fashion. This attribute of appearance is common to all NetFlow data aggregation schemes.
In general, the columns of all NetFlow data arrays fall into two logical categories:
These categories are described in the following sections.
The "key" columns of a NetFlow data aggregation scheme include those columns that appear to the left of the "Packets" column in any given NetFlow data array (see Figure 3-10). These columns reflect the sort keys by which the FlowCollector application gathers, filters, and stores collected NetFlow traffic information.
For the particular sample DetailDestNode aggregation scheme shown in Figure 3-10, the following "key" columns apply:
These so-called keys serve as the record identifiers by which the FlowCollector processes and screens the large volume of NetFlow data continually being received from NetFlow-enabled devices in your network.
Note that the first column, labeled "Router," in any NetFlow data array shows the IP address of the network router for which aggregated NetFlow data is being displayed.
Note further that the number of columns appearing in the "key" area of the Display module window varies in size, depending on the particular NetFlow data aggregation scheme being displayed.
For example, by examining the second column of Table 3-1, you can see that each aggregation scheme has a defined "key," or a defined set of "keys," that applies only to that particular aggregation scheme.
The "metrics" columns of any displayed NetFlow data aggregation scheme always include the six columns listed and described below.
Furthermore, these columns are always the six right-most columns of the NetFlow data array, containing traffic statistics listed in the following order from left to right in the array, beginning with the "Packets" column:
For more detail about these traffic metrics, you can consult the on-line help system.
Due to the number of columns and rows appearing in a typical NetFlow data array, horizontal and vertical scroll bars have been incorporated into the Display module window to enable you to bring all areas of the data array into view.
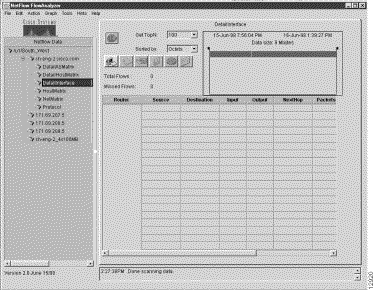
One of the most common FlowAnalyzer tasks is to display NetFlow information for a specific router.
For purposes of this procedure, assume that you have added a data set path to the Netflow Data area, as shown in Figure 3-11.
Assume further that you want to display NetFlow data for the DetailInterface aggregation scheme associated with the router identified in the Netflow Data area as ch-eng-2.cisco.com.
For more information about defining data set paths for display purposes, refer to the earlier section in this chapter entitled "Adding Data Set Paths to the Netflow Data Area."
To display NetFlow data for a particular aggregation scheme associated with a selected router, perform the following steps:
Step 1 Having entered a data set path in the Netflow Data area, as shown in Figure 3-11, double-click on the desired router to display its applicable aggregation schemes.
Assume that the router of interest for this procedure is ch-eng-2.cisco.com.
Step 2 For this step, assume that the aggregation scheme of interest is DetailInterface. Click on this aggregation scheme.
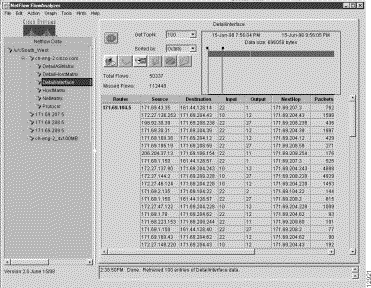
This step brings up a "clean" DetailInterface aggregation scheme in the Display module window, as shown in Figure 3-12.
Step 3 In this window, set the time slider marks to establish the desired time period for which applicable NetFlow data is to be retrieved and displayed.
Note that you can move the time slider marks in either horizontal direction to establish any desired time interval for NetFlow operations.
Step 4 Click on the Get TopN: pull-down menu to select the number of flows that you want to apply for data retrieval purposes.
To improve FlowAnalyzer performance, you can limit the volume of NetFlow data to be processed by selecting a desired value from this pull-down menu. User-selectable values, ranging from 10 to 10,000, enable you to limit the amount of data to be processed to the first "N" flows. The default value of "N" is 100.
Step 5 Click on the Sorted by: pull-down menu to select the particular traffic attribute against which the NetFlow data is to be sorted, retrieved, and displayed. The default value is "Octets."
Step 6 Click on the Get data from server button in the Display module window, or select the Get Data option of the Action menu to initiate the display of NetFlow data for the DetailInterface aggregation scheme.
When completed, this procedure results in the NetFlow data array shown in Figure 3-13.
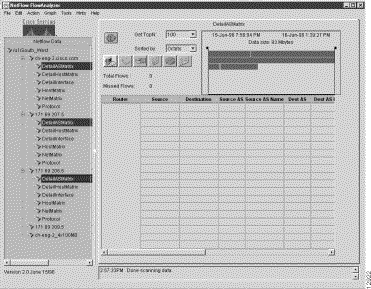
Another very common FlowAnalyzer task is to display NetFlow data for a particular aggregation scheme that is common among two or more Cisco NetFlow-enabled devices in your network. Generally, the purpose of such a task is to compare similar NetFlow traffic data across multiple routers in your network.
For purposes of the procedure in this section, it is assumed that you want to issue Display module commands for the tree structure shown in Figure 3-14. Note that this data tree structure pertains to a named router group consisting of multiple routers.
For details about how to create such a named router group, refer to the earlier section in this chapter entitled "Creating a Named Router Group and Saving It to a File."
With such a tree structure in the Netflow Data area, you can select any given aggregation scheme for a single router within the named logical group for display purposes.
A more likely scenario with such a tree structure, however, is to select the same aggregation scheme across some or all group members for display purposes. This latter scenario forms the basis for the following procedure.
To display NetFlow data for multiple routers in a named router group, perform the following steps:
Step 1 The data tree structure shown in Figure 3-14 reflects the fact that you want to display common aggregation scheme data for three different network routers. Furthermore, the DetailASMatrix aggregation scheme is assumed to be the scheme of choice.
Step 2 To prepare for NetFlow data retrieval, do the following:
(a) Select the desired aggregation scheme across the multiple routers.
The aggregation scheme you select must be the same for all routers. To select each such scheme, hold down the Ctrl key while clicking on name of the scheme.
(b) Position the time slider marks in the window, as desired, to establish the applicable time period for retrieving relevant NetFlow data.
(c) Click on the Get TopN: pull-down menu to select the number of traffic flows that you want to apply for data retrieval purposes.
To improve FlowAnalyzer performance, you can limit the volume of NetFlow data to be processed by selecting a desired value from this pull-down menu. User-selectable values, ranging from 10 to 10,000, enable you to limit the amount of data to be processed to the first "N" flows. The default value of "N" is 100.
(d) Click on the Sorted by: pull-down menu to select the particular traffic attribute against which the aggregation scheme data is to be sorted and displayed. The default value is "Octets."
Step 3 Click on the Get data from server button in the Display module window, or select the Get Data option of the Action menu, to initiate the data retrieval and display operation.
When completed, the above procedure results in the NetFlow data array shown in Figure 3-15.
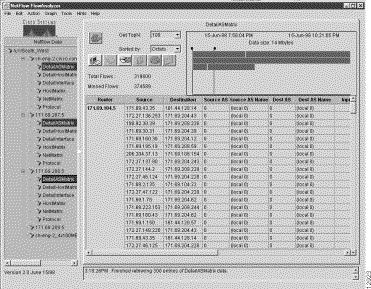
By using a data tree structure for multiple routers in this manner, you can select any aggregation scheme common to any combination of routers in a named router group and initiate display functions for those routers. This capability enables you to compare traffic patterns and statistics for any routers of interest in a named router group.
As in all other display functions, if the NetFlow data array exceeds the physical boundaries of the display window proper, you can use the window's horizontal and vertical scroll bars to bring all elements of the array into view.
For purposes of the sort procedure in this section, it is assumed that you will use the data tree structure shown in Figure 3-16 as the basis of sort operations.
You can initiate a sort operation, in either of two ways:

To initiate a sort operation for a selected aggregation scheme, perform the following steps:
Step 1 Given the data set path shown in Figure 3-16, select an aggregation scheme for displaying NetFlow data.
For this purpose, assume that DestPort is the aggregation scheme of choice.
Step 2 Click on this scheme to bring up a "clean" DestPort screen in the Display module window.
Step 3 To prepare for sort operations, do the following:
(a) Position the time slider marks in the window, as desired, to establish the applicable time frame for data retrieval.
(b) Click on the Get TopN: pull-down menu to select the number of flows that you want to apply for data retrieval purposes.
To improve FlowAnalyzer performance, you can limit the volume of NetFlow data to be processed by selecting a desired value from this pull-down menu. User-selectable values, ranging from 10 to 10,000, enable you to limit the amount of data to be processed to the first "N" flows. The default value of "N" is 100.
(c) Click on the Sorted by: pull-down menu to select the desired sort key for data retrieval purposes. The default value is "Octets."
Step 4 Click on the Get data from server button in the Display module window, or select the Get Data option of the Action menu, to initiate the sort operation.
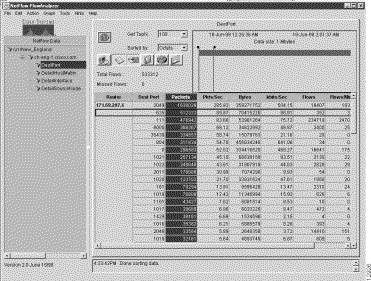
Step 5 When the data for the selected aggregation scheme appears in the NetFlow data array, as shown in Figure 3-17, you can sort the data by means of either of the following options:
(a) Option 1—Click on the heading of any desired column in the NetFlow data array to highlight that column.
You can then select the Sort Data option of the Action menu to initiate the sort operation, or you can click on the Sort data selected button in the Display module window to initiate the sort operation.
(b) Option 2—Double-click on any given column heading of the NetFlow data array to initiate a sort operation for that column.
Using this option, you can double-click on a succession of different column headings (in any order) to initiate separate sort operations for a selected column.
For sort purposes, assume that you want to sort the data in the Packets column of the NetFlow data array.
Step 6 Using any of the options outlined above, initiate a sort operation for the Packets column.
When completed, the above procedure results in the NetFlow data display shown in Figure 3-18. Note that the data in the "Packets" column has been sorted in descending numerical order.
By means of this procedure, you can select any aggregation scheme in an existing tree structure, retrieve the applicable data for that aggregation scheme, select any column in the resulting NetFlow data array, and use that column as the basis for a sort operation.
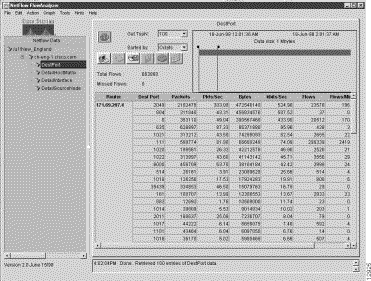
If you want to save displayed NetFlow for an aggregation scheme (such as the DestPort scheme shown in Figure 3-18 above), you can export the data to a file of your choosing.
To save currently-displayed NetFlow data for an aggregation scheme, perform the following steps:
Step 1 Assuming that NetFlow data for the aggregation scheme of interest is currently being displayed, do either of the following:
(a) Click on the Export data in CSV format button in the Display window.
(b) Select the File, Export function from the pull-down menu of the Display window.
Step 2 With either action above, an Export dialog box appears, which enables you to add a file name of your choice (such as "destportdat"), as shown below:
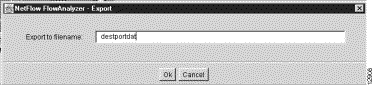
In saving the NetFlow data to a file, the Display module takes all the nonspaced characters that it encounters in the dialog box (reading from left to right), uses those characters as the name of the saved file, and appends ".CSV" as the file extension.
For example, if you entered the file name "my sort data" into the dialog box, the system would name the file "my.CSV," thus ignoring any characters in the dialog box following the first space.
Step 3 Click on OK in the Export dialog box to save the displayed NetFlow data to the named file.
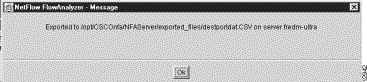
Step 4 When the save operation is complete, the following Message box appears to inform you of the storage location for the saved NetFlow data file:
Step 5 Click on OK in the Message box to close the window.
As evident from the Message box above, saved NetFlow data for a particular aggregation scheme is stored in the /opt/CSCOnfa/NFAServer/exported_files directory.
You can graph displayed NetFlow data in three different formats:
You can use these graphing functions to create a visual representation of selected NetFlow currently being displayed in the Display module window. The following sections tell you how to use these Display module graphing functions.
The sample NetFlow data array shown in Figure 3-19 has been included here to provide an appropriate context for describing the Display module's graphing functions in this section.
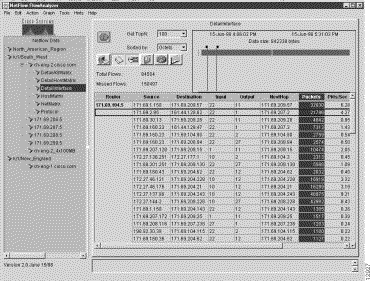
To create a bar chart by means of the procedure presented in this section, assume that the NetFlow data array for the DetailInterface aggregation scheme shown in Figure 3-19 is to serve as the basis for bar chart creation.
Note that the Packets column of the NetFlow data array in Figure 3-19 has been selected (highlighted) as the column of interest for bar chart creation. (To highlight a column in the NetFlow data array, you need only click on the column heading.)
To create a bar chart representing the traffic information displayed in the Packets column (or any other selected column) of the NetFlow data array, perform the following steps:
Step 1 Decide which of two available methods you want to use to initiate bar chart creation:
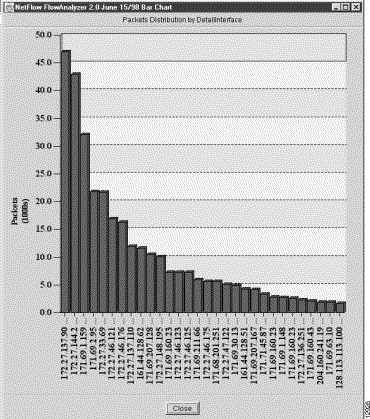
(a) Option 1—Click on the Draw bar chart button in the Display module window. This action brings up a Graph TopN pop-up window.
Place the mouse pointer in this pop-up window, causing a list of choices for the TopN value to appear. Click on the desired value ('30" for purposes of this procedure) to initiate bar chart creation.
The bar chart shown in Figure 3-20 then appears in a separate window on your host workstation or PC screen.
(b) Option 2—Click on the Graph pull-down menu in the Display module window. This action brings up a pop-up window, which lists Bar, Pie, and Histogram as available choices.
Place the mouse pointer on Bar, causing a list of choices for the TopN value to appear. Click on the desired value (again "30" for purposes of this procedure) to initiate bar chart creation.
In the same manner as above, the bar chart shown in Figure 3-20 appears in a separate window on your workstation or PC screen.
Step 2 To remove the bar chart from the screen and return you to the Display module window, click on the "Close" button at the bottom of the chart.
Note, since "30" was selected as the applicable TopN value for bar chart creation, the 30 largest flows (in terms of "packets") are incorporated into the horizontal axis of bar chart.
You should be aware that you can select any column in the NetFlow data array as the basis for bar chart creation, provided that the selected data can be graphed.
If the column in the data array that you select cannot be graphed, the Graph pull-down menu and the Draw bar chart button in the Display module window are grayed out.
To create a pie chart by means of the procedure presented in this section, assume that the NetFlow data array for the DetailInterface aggregation scheme shown in Figure 3-19 is to serve as the basis for pie chart creation.
Note that the Packets column of the NetFlow data array in Figure 3-19 has been selected (highlighted) as the column of interest for pie chart creation. (To highlight a column in the NetFlow data array, you need only click on the column heading.)
To create a pie chart representing the traffic information displayed in the Packets column (or any other selected column) of the NetFlow data array, perform the following steps:
Step 1 Decide which of the two available methods you want to use to initiate pie chart creation:
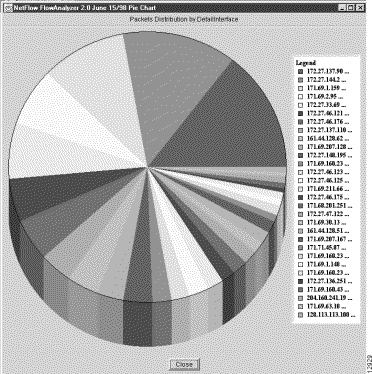
(a) Option 1—Click on the Draw pie chart button in the Display module window. This action brings up a Graph TopN pop-up window.
Place the mouse pointer in this pop-up window, causing a list of choices for the TopN value to appear. Click on the desired value ('30" for purposes of this procedure) to initiate pie chart creation.
The pie chart shown in Figure 3-21 then appears in a separate window on your host workstation or PC screen.
(b) Option 2—Click on the Graph pull-down menu in the Display module window. This action brings up a pop-up window, which lists Bar, Pie, and Histogram as available choices.
Place the mouse pointer on Pie, causing a list of choices for the TopN value to appear. Click on the desired value (again "30" for purposes of this procedure) to initiate pie chart creation.
In the same manner as above, the pie chart shown in Figure 3-21 appears in a separate window on your workstation or PC screen.
Step 2 To remove the pie chart from the screen and return you to the Display module window, click on the "Close" button at the bottom of the chart.
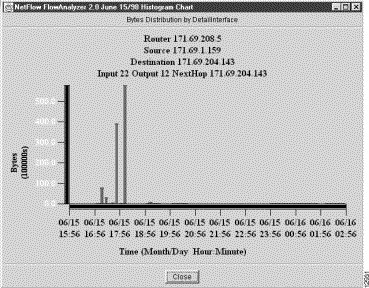
For purposes of describing how to create a histogram chart, the NetFlow data array shown in Figure 3-22 will be used.
To create a histogram chart using the selected information in NetFlow data array, perform the following steps:
Step 1 Decide which of two available methods you want to use in creating the histogram chart:
(a) Option 1—Click on the Draw histogram chart button in the Display module window.
A "Histogram Chart in progress" pop-up window appears temporarily in the Display module window to show the state of completion of the graphing operation.
The histogram chart shown in Figure 3-23 then appears in a separate window.
(b) Option 2—Click on the Graph, Histogram function of the pull-down menu in the Display module window.
A "Histogram Chart in progress" pop-up window appears temporarily in the Display module window to show the state of completion of the graphing operation.
As above, the histogram chart shown in Figure 3-23 appears in a separate window.
Step 2 To remove the histogram chart from the screen and return you to the Display module window, click on the "Close" button at the bottom of the chart
The AS drill down function of the Display module enables you to take a closer look at NetFlow data pertaining to multiple routers involved in traffic flows between source AS and destination AS systems in your network.
An AS (autonomous system) is a network, or a collection of networks, that is operating under a common network administration and routing strategy.
For this reason, it is often useful to examine NetFlow data pertaining to multiple routers in an AS network to determine how to best administer the network and use its resources.
To make use of the AS drill down function of the Display module, NetFlow data for one or more DetailASMatrix aggregation schemes must have been collected by one or more host FlowCollector workstations in your AS network. Hence, "drilling down" on network flows, as described in this section, pertains only to DetailASMatrix aggregation schemes.
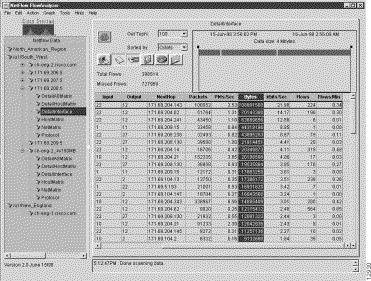
Figure 3-24 shows a typical NetFlow data array for DetailASMatrix aggregation schemes pertaining to three different routers in your network.
Before you can initiate an AS drill down operation, you must have previously loaded a data set path into the Netflow Data area that encompasses one or more routers for which DetailASMatrix aggregation scheme data has been collected.
To view AS drill down data, based on the assumptions above, perform the following steps:
Step 1 Select the AS Drill Down Window option from the Tools menu of the Display module window.
This action bring up the AS Drill Down window, as shown in Figure 3-25.
Step 2 From the list of routers appearing in the AS Drill Down window, select those that you want to include in the AS drill down operations.
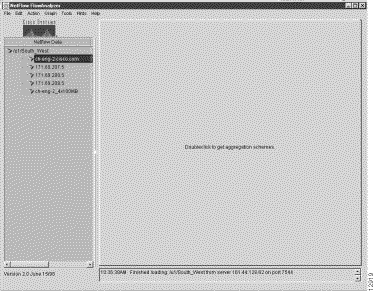
For this step, assume that you want to include the first three routers listed in the AS Drill Down window under the /u1/South_West data set path:
While holding down the Ctrl key, click on these three routers to highlight them.
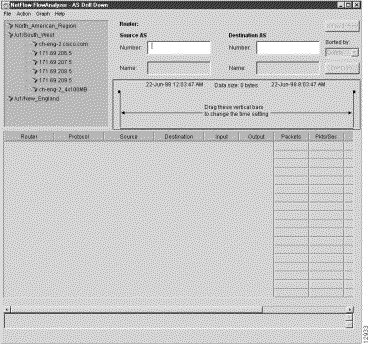
Step 3 Establish the parameters for governing the AS drill down operations for the selected routers, as follows:
(a) Enter the Source AS number and the Destination AS number in the appropriate fields of the AS Drill down window.
For this purpose, assume that "0" is to be entered in both fields.
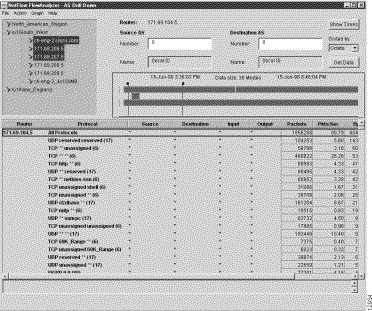
(b) Select the Show Times option under the Action menu of the AS Drill Down window.
This action shows the time spans for which aggregation scheme data has been collected for the selected routers.
(c) Position the time slider marks to establish the desired time span that embraces DetailASMatrix aggregation scheme data for all three selected routers.
(d) Choose a desired value for the Sorted by: field.
Available choices for this field include the following: Packets, Octets, Flows, and data key. For this step, assume that "Octets" is the key of choice.
(e) Select the Get Data option under the Action menu, or click on the Get Data button in the window.
Either action initiates the retrieval and display of the appropriate AS NetFlow data for the selected routers, the results of which are shown in Figure 3-26.
Step 4 To drill down on (get more detail regarding) the protocols used by a selected router, do the following:
(a) If necessary, use the vertical scroll bar in the right side of the AS Drill down window to bring the desired NetFlow data into view for the router of interest.
(b) If necessary, click on and drag the sizing bar at the right margin of the Protocol column header to expand the width of the column, thus bringing all information in the column into full view.
(c) Select the desired row in the Protocol column for the selected router.
For this purpose, assume that you want to drill down on the protocol data for the router identified as 171.69.207.5 in the window.
To bring the NetFlow data for this router into view in the NetFlow data array, you may have to use the vertical scroll bar in the window to traverse to the desired area of the display.
Assume further that you want to select the third row in the protocol column for this router as the basis of the drill down operation. This is the row that contains "TCP**smtp(6)," as shown in Figure 3-27.
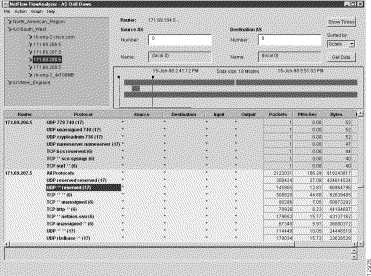
Step 5 Double click on the row containing the entry TCP**smtp(6), or select the Drill down on protocol option of the Action menu.
Either action results in the NetFlow data array shown in Figure 3-27.
Step 6 If you want to collapse (hide) the data currently being displayed for the selected row, select the Hide drill down data option from the Action menu.
This action causes the NetFlow data array to revert to its previous form (the form shown in Figure 3-27), at which point, you can select any other Protocol row for any other selected router and use that row as the basis for another drill down operation.
In this manner, you can perform a series of drill down on protocol operations for any number of rows in the NetFlow data array.
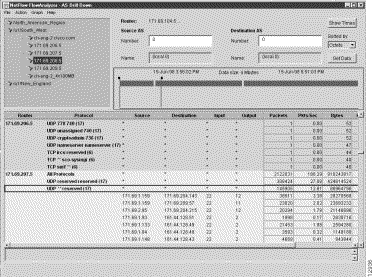
In the AS Drill Down window, an asterisk appearing in any Protocol row of the NetFlow data array indicates that additional information pertaining to the DetailASMatrix aggregation scheme is available for display purposes.
For any such row, you can do either of the following:
Thus, by successively double-clicking on any row containing an asterisk, you can open the row, view additional data related thereto, and close the row.
The effect of drilling down on any Protocol row in an AS Drill Down window containing asterisks is to expand the following columns of the NetFlow data array:
You can use the Search window of the Display module (see Figure 3-29) to search for traffic flows of the following types:
The procedures for initiating searches for the above types of traffic flows are described separately in later sections.
Before you can perform search operations for traffic flows of the types listed above, you must have previously added a data set path to the Netflow Data area of the main Display module window, either by means of the Edit, Add Data Path function or the File, Load function.
The tree structure that you add to the Netflow Data area by such means is propagated into the Search window when you invoke the Search Window option of the Tools menu in the main Display module window (see Figure 3-29). This illustration shows a device named ch-eng-2_4x100MB for which DetailDestNode aggregation scheme data has been displayed.
For purposes of this section, this device and aggregation scheme have no particular significance for search operations per se, other than to serve as a "point of reference" for describing search operations.
What you should understand is that it is from such a window that you are able to bring up the Search window itself (see Figure 3-30), which then enables you to establish the necessary parameters for accomplishing desired search operations.
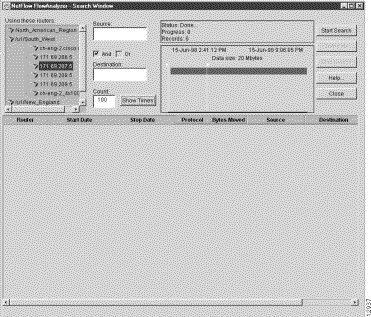
This section outlines the generic procedure for searching for a particular type of traffic flow by means of the Search window.
Assuming that you have brought up the Search window by invoking the Search Window option of the Tools menu in the main Display module window, you then perform the following steps to initiate search operations:
Step 1 Select the device of interest in the tree structure of the Search window.
Step 2 Enter the appropriate IP address information in the Source and Destination fields of the window.
Step 3 Click on the AND box or the OR box, as appropriate, to define the intended scope of search operations.
Step 4 Click on the Show Times button.
Step 5 Position the time slider marks, as appropriate, to define the applicable time interval for which NetFlow data is to be processed for the specified search operation.
Step 6 Click on the Start Search button.
In entering IP addresses or subnet addresses as called for in either the Source field or the Destination field of the Search window, you use the standard dotted decimal format shown below:
192.69.0.0/16
This type of search operation looks for traffic flows that occur between a specified source device and a specified destination device.
To search for flows between one IP address and another IP address, perform the following steps:
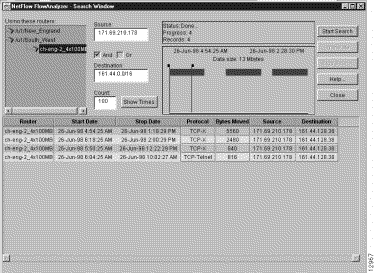
Step 1 In the Source field, enter the IP address of the device (171.69.210.178, for example) that originated the flows.
Step 2 In the Destination field, enter the IP address of the device (161.44.128.38, for example) that received the flows.
Step 3 Check the AND box.
Step 4 Click on the Show Times button, adjust the slider marks, as desired, and click on the Start Search button.
This procedure finds the traffic flows that originated from the source device (171.69.210.178) and that were received by the destination device (161.44.128.38).
Sample output from this type of IP-to-IP search operation is shown in Figure 3-30.
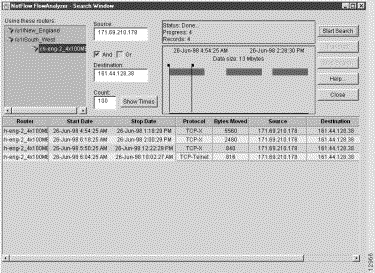
Note that the Search window contains a Translate button in the upper right corner of the window. This button serves the same function as the same button or menu item in other Display module windows, namely, to translate host IP addresses to DNS names.
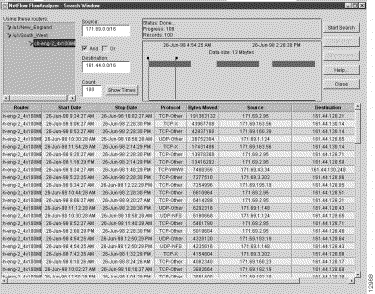
This type of search operation looks for traffic flows that occur between a specified source device and destination devices having an IP address within a specified range.
To search for flows between a specified IP address and a range of subnet addresses, perform the following steps:
Step 1 In the Source field, enter the IP address of the device (171.69.210.178, for example) that originated the flows.
Step 2 In the Destination field, enter the subnet address (161.44.0.0/16, for example) of the devices that received the flows.
Step 3 Check the AND box.
Step 4 Click on the Show Times button, adjust the slider marks, as desired, and click on the Start Search button.
This procedure finds the flows that originated from the device at 171.69.210.178 and that terminated at devices having an IP address in the range 161.44.0.0 - 164.44.255.255.
Figure 3-31 shows the sample output from the IP-to-subnet search operation outlined above.
Note that you can swap the contents of the Source and Destination fields to accomplish the reverse of the search operation described above.
To search for flows between a subnet address and an IP address, perform the following steps:
Step 1 In the Source field, enter the subnet address of the devices (161.44.0.0/16, for example) that originated the flows.
Step 2 In the Destination field, enter the IP address (171.69.210.178, for example) of the router that received the flows.
Step 3 Check the AND box.
Step 4 Click on the Show Times button, adjust the slider marks, as desired, and click on the Start Search button.
This procedure finds the flows that originated from devices having IP addresses in the range from 161.44.0.0 - 161.44.255.255 and that were received by the device at 171.69.210.178.
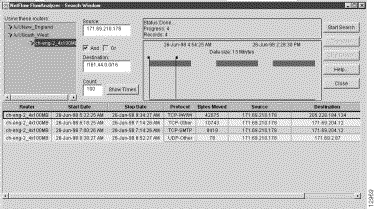
This type of search operation looks for traffic flows that occur between source devices having IP addresses within a specified range and destination devices having IP addresses within a specified range.
To search for flows between one subnet address and another subnet address, perform the following steps:
Step 1 In the Source field, enter the subnet address (171.69.0.0/16, for example) of the devices that originated the flows.
Step 2 In the Destination field, enter the subnet address 161.44.0.0/16, for example) of the devices that received the flows.
Step 3 Check the AND box.
Step 4 Click on the Show Times button, adjust the slider marks, as desired, and click on the Start Search button.
This procedure finds the flows that originated from devices having an IP address in the range from 171.69.0.0 - 171.69.255.255 and that were received by devices having an IP address in the range from 161.44.0.0 - 161.44.255.255.
Figure 3-32 shows sample output from the subnet-to-subnet search operation outlined above.
This type of search operation looks for traffic flows that occur between a specified source device and destination devices other than those having IP addresses within a specified range.
To search for flows that a specified device sends elsewhere in the network, except to certain specified devices, perform the following steps:
Step 1 In the Source field, enter the IP address of the router (171.69.210.178, for example) that originated the flows.
Step 2 In the Destination field, enter the "!" character, followed by a subnet address (161.44.0.0/16, for example).
The exclamation point (!) is a "not" operator that means "any but those" addresses specified in the subnet address. The effect of this character is to limit the scope of the search operation.
Step 3 Check the AND box.
Step 4 Click on the Show Times button, adjust the slider marks, as desired, and click on the Start Search button.
This procedure finds the flows that originated from the specified device (171.69.210.178) and terminated with other devices, except for those devices having an IP address in the specified range (161.44.0.0 - 161.44.255.255).
Figure 3-33 shows the sample output from the IP "Away From" Subnet search operation outlined above.
Note that you can swap the contents of the Source and Destination fields to accomplish the reverse of the search operation described above.
To search for flows that originate anywhere in the network (except from devices having an IP address in a specified range) and that terminate with a specified router, perform the following steps:
Step 1 In the Source field, enter the "!" character, followed by a subnet address (161.44.0.0/16, for example).
The exclamation point (!) is a "not" operator that means "any but those" addresses specified in the subnet address. The effect of this character is to limit the scope of the search operation.
Step 2 In the Destination field, enter the IP address of the device (171.69.210.178, for example) that received the flows.
Step 3 Check the AND box.
Step 4 Click on the Show Times button, adjust the slider marks, as desired, and click on the Start Search button.
This procedure finds all the traffic flows that originated from anywhere in the network, except for those devices having an IP address in the range from 161.44.0.0 - 161.44.255.255, and that were received by the device at 171.69.210.178.
![]()
![]()
![]()
![]()
![]()
![]()
![]()
![]()
Posted: Tue Dec 17 19:08:04 PST 2002
All contents are Copyright © 1992--2002 Cisco Systems, Inc. All rights reserved.
Important Notices and Privacy Statement.