|
|

For purposes of this chapter, it is assumed that you read Chapter 1, "Analyzer Overview," which describes the concepts and principles essential to understanding and using the Analyzer.
This chapter describes how to use the Analyzer by means of the graphical user interface (GUI) of the Display module. The Display module, which can be installed on one or more host workstations or PCs in your network, incorporates an extensive menu system for invoking Analyzer functionality.
This chapter contains the following sections:
Consider the following when you use the FlowCollector and the Analyzer:
For instructions on starting all the Analyzer modules, including the Display module, see the "Installing and Setting Up the Analyzer" section.
The Analyzer displays the following two types of traffic information:
The traffic information for these two data types is processed and arranged into a spreadsheet-like matrix of columns and rows in the display pane of the Display module.
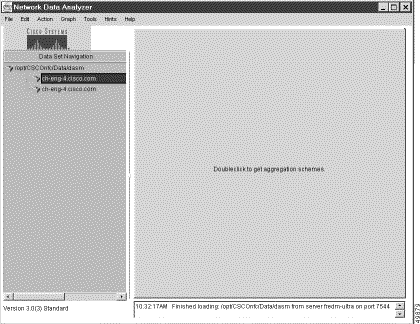
The following sections describe the NetFlow and TMS data aggregation schemes available for use with the FlowCollector and the Analyzer.
NetFlow data aggregation schemes consist of key columns and value columns.
The key columns of a NetFlow data aggregation scheme represent the traffic information that the FlowCollector looks for in sorting and processing UDP datagrams received from NetFlow exporting devices in your network. Once the FlowCollector processes the data according to the aggregation scheme currently in effect, it stores the data in its local NetFlow directory.
The value columns of a NetFlow data aggregation scheme contain the statistical information extracted from the UDP datagrams for a given traffic flow.
Table 3-1 summarizes the NetFlow data aggregation schemes available in the current releases of the FlowCollector and the Analyzer by listing the following:
The value columns, which are common to all of the NetFlow data aggregation schemes (except for the CallRecord and DetailCallRecord aggregation schemes, as noted in Table 3-1), are listed and described in Table 3-2.
| Aggregation Scheme Name | Key Column Name in Data Array | Column Contents |
|---|---|---|
Source | IP address of the source device. | |
| Destination | IP address of the destination device. |
| Source AS | Autonomous system (AS) from which the monitored traffic originated. |
| Source AS Name | Name of the source AS system. |
| Dest AS | AS system name to which the monitored traffic was delivered. |
| Dest AS Name | Name of the destination AS system. |
Source AS (autonomous system) number. | ||
| Dest AS | Destination AS number. |
Source AS | Autonomous system (AS) from which the monitored traffic originated. | |
| Source AS Name | Name of the source AS system. |
| Dest AS | AS system name to which the monitored traffic was delivered. |
| Dest AS Name | Name of the destination AS system. |
| SrcPort | Application port number of the source device. |
| DestPort | Application port number of the destination device. |
| Protocol | IP transport protocol used in transmitting the monitored traffic. |
Source | IP address of the source device. | |
| Destination | IP address of the destination device. |
| IP Precedence | Precedence bits from the ToS byte in the IP header. The value is 0 to 7, where 0 is normal traffic and 7 is highest priority traffic. The value usually is 0. |
| TOS | The ToS byte in the IP header (see RFC 1812 and RFC 2474).
|
Destination | IP address of the device that received the traffic flow. | |
DestPort | Application port number of the destination device. | |
Source | IP address of the source device. | |
| Destination | IP address of the destination device. |
| Source AS | Source AS number. |
| Source AS Name | Source AS name. |
| Dest AS | Destination AS number. |
| Dest AS Name | Destination AS name. |
| Input | Input interface number of device receiving traffic flow. |
| Output | Output interface number of device originating traffic flow. |
| SrcPort | Application port number of the source device. |
| DestPort | Application port number of the destination device. |
| Protocol | IP transport protocol used in transmitting the monitored traffic. |
Source | IP address of the source device. | |
| Destination | IP address of the destination device. |
| Input Interface | On the router from which data was collected, the ifIndex number and description text for physical interface through which monitored traffic was received. |
| Output Interface | On the router from which the data was collected, the ifIndex number and description text for physical interface through which monitored traffic was sent. |
| IP Precedence | Precedence bits from the ToS byte in the IP header. The value is 0 to 7, where 0 is normal traffic and 7 is highest priority traffic. The value usually is 0. |
| TOS | The ToS byte in the IP header (see RFC 1812 and RFC 2474). Note: The standard "values" columns are not included in the output display for the DetailCallRecord aggregation scheme. Instead, the values columns of this aggregation scheme are:
|
Destination | IP address of the destination device. | |
| SrcPort | Application port number of the source device. |
| DestPort | Application port number of the destination device. |
| Protocol | IP transport protocol used in transmitting the monitored traffic. |
Source | IP address of the source device. | |
| Destination | IP address of the destination device. |
| Input | Input interface number of the device receiving the traffic flow. |
| Output | Output interface number of the device originating the traffic flow. |
| NextHop | IP address of the next hop device. |
Source | IP address of the source device. | |
| SrcPort | Application port number of the source device. |
| DstPort | Application port number of the destination device. |
| Protocol | IP transport protocol used in transmitting the monitored traffic. |
Source | IP address of the source device that originated the traffic flow. | |
| Destination | IP address of the destination device that received the traffic flow. |
Source | IP address of the source device that originated the traffic flow. | |
| Destination | IP address of the destination device that received the traffic flow. |
| Input | Input interface number of the device receiving the traffic flow. |
| Output | Output interface number of the device originating the traffic flow. |
| Protocol | IP protocol used in transmitting the monitored traffic. |
Source | IP address of the source device. | |
| (Source) Mask | Number of significant bits in the source subnet mask. |
| Input | Input interface number of the device receiving the traffic flow. |
| Destination | IP address of the destination device. |
| (Destination) Mask | Number of significant bits in the destination subnet mask. |
| Output | Output interface number of the device originating the traffic flow. |
IP transport protocol used in transmitting the monitored traffic. The FlowCollector's nfknown.protocols file defines the recognized application layer protocols (FTP, Telnet, UDP, and so forth) that the FlowCollector recognizes in aggregating Netflow data. | ||
Source AS | Autonomous system (AS) from which the monitored traffic originated. | |
| Source AS Name | Name of the source AS system. |
| Dest AS | AS system name to which the monitored traffic was delivered. |
| Dest AS Name | Name of the destination AS system. |
| Input Interface | On the router from which the data was collected, the ifIndex number and description text for the physical interface through which the monitored traffic was received. |
| Output Interface | On the router from which the data was collected, the ifIndex number and description text for the physical interface through which the monitored traffic was sent. |
Destination | IP address of destination device. | |
Destination (Subnet) | IP address of the network to which the monitored traffic was delivered. | |
| Destination (Prefix) Mask | Mask by which the destination IP address was subnetted. |
| Output Interface | On the router from which the data was collected, the ifIndex number and description text for the physical interface through which the monitored traffic was sent. |
| Destination AS | Destination AS number. |
| Destination AS Name | Name of destination AS. |
Source | IP address of the source device. | |
| Destination | IP address of the destination device. |
| Source Port | On source host, the application port from which the monitored traffic was sent. This may be a port number or (if the FlowCollector is so configured) a text string. |
| Destination Port | On destination host, the application port number to which the monitored traffic is delivered. This may be a port number or a text string. |
| Protocol | IP protocol used in transmitting the monitored traffic. |
Source (Subnet) | IP address of the network from which the monitored traffic originated. | |
| Destination (Subnet | IP address of the network to which the monitored traffic was delivered. |
| Source (Prefix) Mask | Mask by which the source IP address was subnetted. |
| Destination (Prefix) Mask | Mask by which the destination IP address was subnetted. |
| Input Interface | On the router from which the data was collected, the ifIndex number and description text for the physical interface through which the monitored traffic was received. |
| Output Interface | On the router from which the data was collected, the ifIndex number and description text for the physical interface through which the monitored traffic was sent. |
| Source AS | Source autonomous system (AS) number. |
| Source AS Name | Name of source AS. |
| Destination AS | Destination AS number. |
| Destination AS Name | Name of destination AS. |
RouterPrePort | Source (Subnet) | IP address of the network from which the monitored traffic originated. |
| Source (Prefix) Mask | Mask by which the source IP address was subnetted. |
| Destination (Subnet) | IP address of the network to which the monitored traffic was delivered. |
| Destination (Prefix) Mask | Mask by which the destination IP address was subnetted. |
| Source Port | On source host, the application port from which the monitored traffic was sent. This may be a port number or (if the FlowCollector is so configured) a text string. |
| Destination Port Protocol | On destination host, the application port number to which the monitored traffic is delivered. This may be a port number or a text string. |
| Input Interface | On the router from which the data was collected, the ifIndex number and description text for the physical interface through which the monitored traffic was received. |
| Output Interface | On the router from which the data was collected, the ifIndex number and description text for the physical interface through which the monitored traffic was sent. |
| IP Precedence | Precedence bits from the ToS byte in the IP header. The value is 0 to 7, where 0 is normal traffic and 7 is highest priority traffic. The value usually is 0. |
| TOS | The ToS byte in the IP header (see RFC 1812 and RFC 2474). |
Source Port | On source host, the application port from which the monitored traffic was sent. This may be a port number or (if the FlowCollector is so configured) a text string. | |
| Destination Port | On destination host, the application port number to which the monitored traffic is delivered. This may be a port number or a text string. |
| Protocol | IP protocol used in transmitting the monitored traffic. |
Source | IP address of the source device. | |
| Destination | IP address of the destination device. |
Source (Subnet) | IP address of the network from which the monitored traffic originated. | |
| Source (Prefix) Mask | Mask by which the source IP address was subnetted. |
| Input Interface | On the router from which the data was collected, the ifIndex number and description text for the physical interface through which the monitored traffic was received. |
| Source AS | Source AS number. |
| Source AS Name | Source AS name. |
Source AS | Autonomous system (AS) from which the monitored traffic originated. | |
| Source AS Name | Name of the source AS system. |
| Dest AS | AS system name to which the monitored traffic was delivered. |
| Dest AS Name | Name of the destination AS system. |
| Input Interface | On the router from which the data was collected, the ifIndex number and description text for the physical interface through which the monitored traffic was received. |
| Output Interface | On the router from which the data was collected, the ifIndex number and description text for the physical interface through which the monitored traffic was sent. |
| IP Precedence | Precedence bits from the ToS byte in the IP header. The value is 0 to 7, where 0 is normal traffic and 7 is highest priority traffic. The value usually is 0. |
| TOS | The ToS byte in the IP header (see RFC 1812 and RFC 2474). |
Destination (Subnet) | IP address of the network to which the monitored traffic was delivered. | |
| Destination (Prefix) Mask | Mask by which the destination IP address was subnetted. |
| Output Interface | On the router from which the data was collected, the ifIndex number and description text for the physical interface through which the monitored traffic was sent. |
| Destination AS | Destination AS number. |
| Destination AS Name | Name of destination AS. |
| IP Precedence | Precedence bits from the ToS byte in the IP header. The value is 0 to 7, where 0 is normal traffic and 7 is highest priority traffic. The value usually is 0. |
| TOS | The ToS byte in the IP header (see RFC 1812 and RFC 2474). |
Source (Subnet) | IP address of the network from which the monitored traffic originated. | |
| Destination (Subnet) | IP address of the network to which the monitored traffic was delivered. |
| Source (Prefix) Mask | Mask by which the source IP address was subnetted. |
| Destination (Prefix) Mask | Mask by which the destination IP address was subnetted |
| Input Interface | On the router from which the data was collected, the ifIndex number and description text for the physical interface through which the monitored traffic was received. |
| Output Interface | On the router from which the data was collected, the ifIndex number and description text for the physical interface through which the monitored traffic was sent. |
| Source AS | Source autonomous system (AS) number. |
| Source AS Name | Name of source AS. |
| Destination AS | Destination AS number. |
| Destination AS Name | Name of destination AS. |
| IP Precedence | Precedence bits from the ToS byte in the IP header. The value is 0 to 7, where 0 is normal traffic and 7 is highest priority traffic. The value usually is 0. |
| TOS | The ToS byte in the IP header (see RFC 1812 and RFC 2474). |
Source Port | On source host, the application port from which the monitored traffic was sent. This may be a port number or (if the FlowCollector is so configured) a text string. | |
| Destination Port | On destination host, the application port number to which the monitored traffic is delivered. This may be a port number or a text string. |
| Protocol | IP protocol used in transmitting the monitored traffic. |
| Input Interface | On the router from which the data was collected, the ifIndex number and description text for the physical interface through which the monitored traffic was received. |
| Output Interface | On the router from which the data was collected, the ifIndex number and description text for the physical interface through which the monitored traffic was sent. |
| IP Precedence | Precedence bits from the ToS byte in the IP header. The value is 0 to 7, where 0 is normal traffic and 7 is highest priority traffic. The value usually is 0. |
| TOS | The ToS byte in the IP header (see RFC 1812 and RFC 2474). |
Source (Subnet) | IP address of the network from which the monitored traffic originated. | |
| Source (Prefix) Mask | Mask by which the source IP address was subnetted. |
| Input Interface | On the router from which the data was collected, the ifIndex number and description text for the physical interface through which the monitored traffic was received. |
| Source AS | Source AS number. |
| Source AS Name | Source AS name. |
| IP Precedence | Precedence bits from the ToS byte in the IP header. The value is 0 to 7, where 0 is normal traffic and 7 is highest priority traffic. The value usually is 0. |
| TOS | The ToS byte in the IP header (see RFC 1812 and RFC 2474). |
Source | IP address of the device that originated the traffic flow. | |
SrcPort | Application port number of the source device. |
For more detailed information about the FlowCollector and the associated NetFlow data aggregation schemes, see the NetFlow FlowCollector Installation and User Guide.
| Value Column Name | Value Column Contents |
|---|---|
Packets | Total number of packets in the monitored traffic flow |
Pkts/Sec | Packet rate per second of the monitored traffic flow |
Bytes | Total number of bytes in the monitored traffic flow |
Kbits/Sec | Total bit rate in kilobits per second |
Flows | Total number of monitored traffic flows |
Flows/Min | Number of flows monitored per minute |
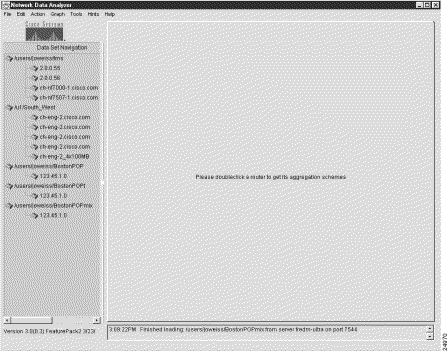
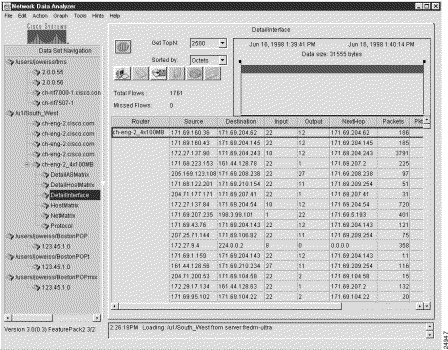
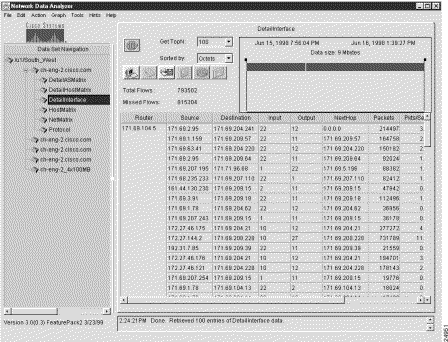
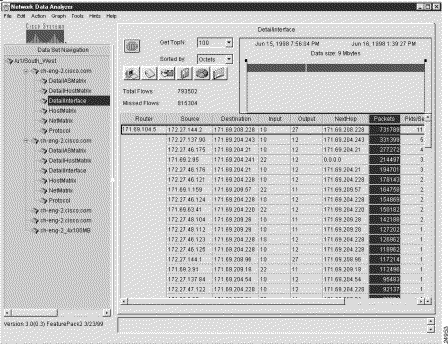
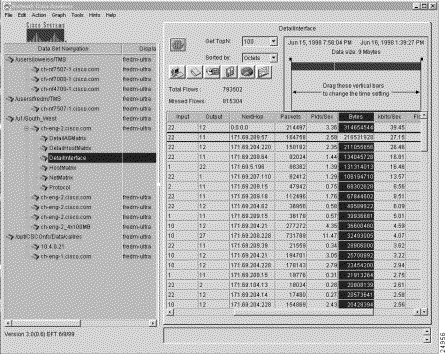
Figure 3-1 shows a sample display of a typical NetFlow data aggregation scheme, in this case, the DetailInterface aggregation scheme.
Due to space limitations in the display pane, not all of the columns in an aggregation scheme can be displayed in the pane at one time. Hence, aggregation scheme data typically overflows the available space in the display pane. Vertical and horizontal scroll bars allow you to view any area of interest in the overall data array. To view additional data, drag the scroll bars.
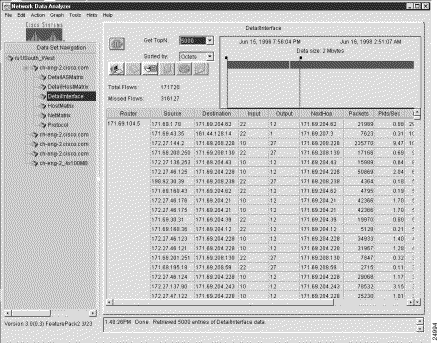
The Router column shown in Figure 3-1 is common to all of the NetFlow data aggregation schemes. This column identifies the source device from which the displayed NetFlow data was collected.
The key columns of a displayed NetFlow data aggregation scheme contain information peculiar to the particular scheme being displayed.
In Figure 3-1, for example, the key columns of the DetailInterface aggregation scheme include the following:
These columns identify the specific subset of sort keys that the FlowCollector uses in post-processing the UDP export datagrams received from the router identified (by the IP address) in the first column of the display. Using these sort keys, the FlowCollector filters and aggregates the appropriate data from the exported UDP datagrams and stores the results as a specific collection of data in its local NetFlow repository.
The Packets column is the first value column in the displayed aggregation scheme (see the next section). The value columns are always the six rightmost columns of a displayed NetFlow data aggregation scheme.
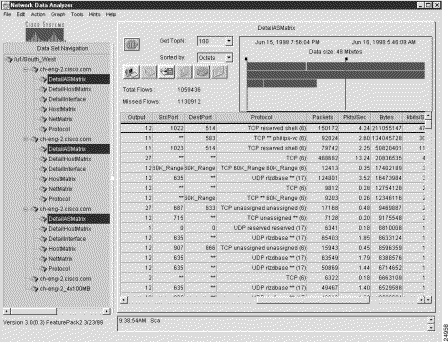
Figure 3-2 is a representation of the same sample output for the DetailInterface aggregation scheme shown in Figure 3-1, except that the display pane is scrolled to the right to make all of the value columns in the data array visible.
The value columns of a displayed NetFlow data aggregation scheme always comprise the following six rightmost columns of the data array:
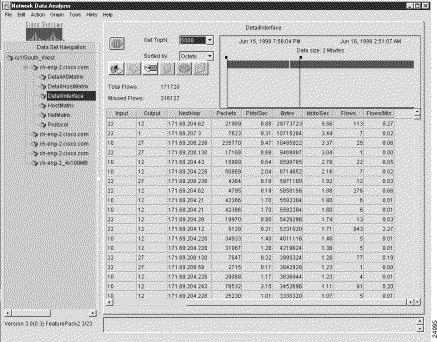
Table 3-3 describes the two key columns of the TMS TrafficMatrix data aggregation scheme. Table 3-4 describes the value columns of the TMS TrafficMatrix data aggregation scheme.
Note that the value columns in Table 3-3 pertain to two different types of traffic: E (external) packets, and I (internal) packets.
| Key Field Name | Description |
|---|---|
Destination | The destination IP address and destination IP address mask for type "p" records. Type "p" records are indexed by destination prefix and describe dynamic tag switching traffic data or traffic engineered (TE) tunnel head traffic data. |
The tunnel head IP address and tunnel serial ID for type "t" records. Type "t" records are indexed by tunnel head for tunnel midpoint records and describe traffic engineered (TE) tunnel midpoint data. |
| Name of Value Field | Description |
|---|---|
E.pkts | External packet count within the specified start/stop interval for the flow. |
E.Pkts/Sec | External packet rate, in packets per second. |
E.Bytes | External byte count within the specified start/stop interval for the flow. |
E.kbits/Sec | External byte rate, in kilobits per second. |
I.Pkts | Internal packet count within the specified start/stop interval for the flow. |
I.Pkts/Sec | Internal packet rate, in packets per second. |
I.Bytes | Internal byte count within the specified start/stop interval for the flow. |
I.kbits/Sec | Internal byte rate, in kilobits per second. |
Pkts | Total packet count within the specified start/stop interval for the flow. |
Pkts/Sec | Total packet rate, in packets per second. |
Bytes | Total byte count within the specified start/stop interval for the flow. |
kbits/Sec | Total bit rate, in kilobits per second. |
Route Flaps | Number of route flaps detected within the specified start/stop interval for the flow. The term "route flap" refers to an instance of the route going down and being restored. |
Flaps/Min | Measured rate of route flaps per minute within the specified start/stop interval for the flow. |
Figure 3-3 shows sample output for the TMS TrafficMatrix data aggregation scheme, which is designed specifically for use in collecting and displaying TMS data.
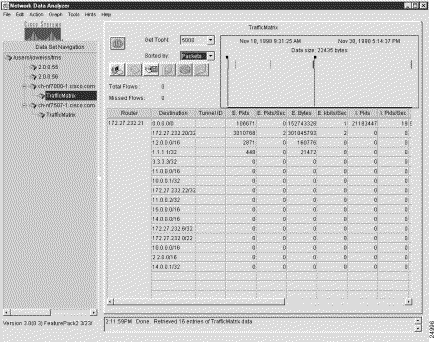
The Router column of the TMS data array (see Figure 3-3) always identifies the source device from which the displayed TMS data was collected.
The key columns of a TMS data array include the following:
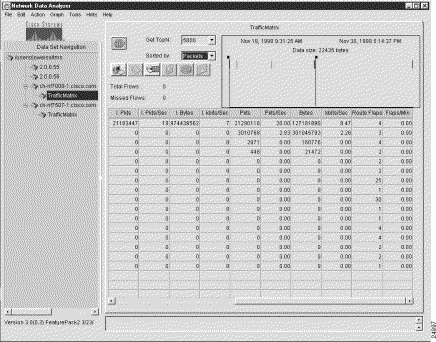
Figure 3-4 shows the same sample output pertaining to the TrafficMatrix aggregation scheme as that shown in Figure 3-3, except that the data in the display pane is shifted to the left by means of the horizontal scroll bar, bringing most of the value columns in the overall data array into view.
The E.Pkts column marks the beginning of the 14 values columns displayed in a TMS aggregation scheme. Table 3-3 describes the 14 different values columns that appear in a TMS TrafficMatrix aggregation scheme.
The Display module File menu provides the following selectable options:
The menu system provided by the Analyzer is structured to help you accomplish specific tasks in a logical fashion, generally proceeding from simple to more complex tasks.
Some menu options are grayed out (not selectable) until other requisite conditions are satisfied.
The following sections describe how you use the File menu options.
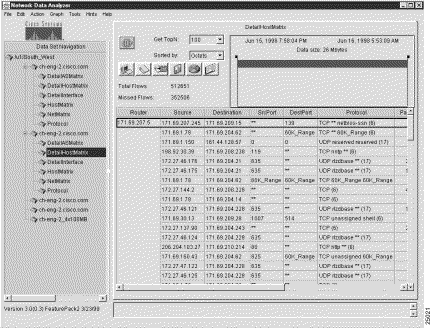
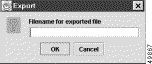
You can export (save) the contents of any displayed aggregation scheme to a named file at any time. Figure 3-5 shows a typical "DetailInterface" aggregation scheme that you could use as the basis for the Export option of the File menu.
To export the contents of a displayed aggregation scheme to a named file, perform the following steps:
Step 2 Select the format in which you want the data to be written.
The following Export popup window appears:
Step 3 Choose a name by which you want the displayed aggregation scheme data to be saved, such as "detail_interface_output."
Step 4 Enter the name of the file in the space provided in the Export popup window, as shown below.
Step 5 Click OK.
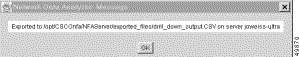
The following message box appears, identifying the saved file by name and indicating the location in which it is stored.
If you selected CSV format
If you selected HTML format
Creating and saving named tree files increases your efficiency. After you create a tree file, you can load it into the Data Set Navigation pane at any time and use it as the basis for a current Display module session.
In using the Analyzer to meet day-to-day needs, it is to your advantage to create a library of tree files that you can draw upon. For example, you can compose a working data tree structure that encompasses exporting devices in a certain network segment or geographical area of interest.
With a library of tree files available when you start up the Display module, you can load any desired working data tree structure into the Data Set Navigation pane as a single entity, thus avoiding having to populate the Data Set Navigation pane individually with data set paths in preparation for a given Display module session.
After you populate the Data Set Navigation pane with the desired data set paths, save the contents of the pane as a named file by choosing the Save option from the File menu.
To create and save a tree file, perform the following steps:
The procedure for populating the Data Set Navigation pane with desired data set paths is described in the "Adding Data Set Paths to the Data Set Navigation Pane" section.
For purposes of creating and saving a named tree file, assume that you have added the data set paths shown in Figure 3-6 into the Data Set Navigation pane.
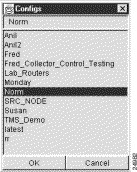
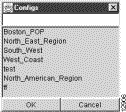
Step 2 After populating the Data Set Navigation pane with the desired data set paths, save the data set paths as a tree file by choosing the Save option from the File menu. This action causes the following Configs popup window to appear:
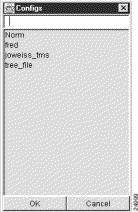
Step 3 In the data field at the top of the Configs popup window, enter a file name of your choice, such as "Boston_Pops," by which the tree file is to be identified.
Step 4 Click OK to save the file by the designated name in a directory on the DisplayServer module host.
From the File menu, you can choose the Load option at any time to select any one of several predefined tree files for loading into the Data Set Navigation pane.
The "Creating and Saving a Tree File" section describes how to create a library of predefined tree files that you can load into the Data Set Navigation pane to serve as the selection mechanism for Display module functions.
To load a tree file into the Data Set Navigation pane, perform the following steps:
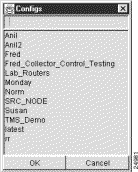
As shown in this popup window, several tree files were previously created and saved for use in performing current or intended Display module tasks.
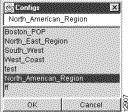
Step 2 From those tree files listed in the Configs popup window, determine which file you want to load into the Data Set Navigation pane. For this purpose, assume that you want to load the tree file named "Norm."
Step 3 To load the selected tree file, do either of the following:
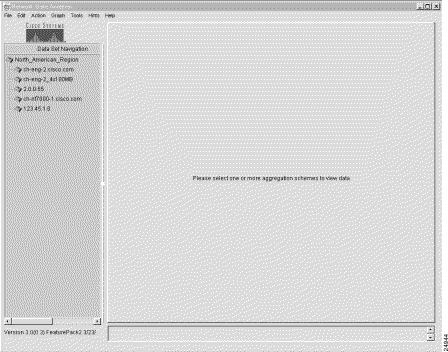
The selected tree file is loaded into the Data Set Navigation pane (see Figure 3-7).
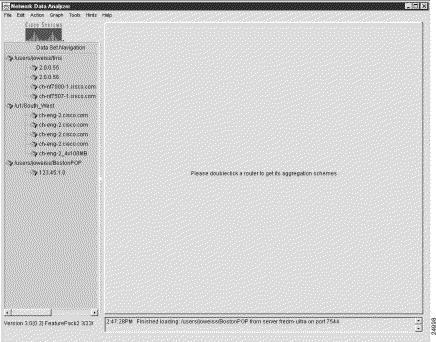
With the data tree structure shown in Figure 3-7 loaded into the Data Set Navigation pane, you can invoke any Display module function, provided that the selected option is not grayed out (unavailable in the current operating context of the Analyzer).
The following loading options become available to you after you create and save one or more tree files:
The default data tree structure loaded into the Data Set Navigation pane on Display module startup remains in effect until you deliberately change it, delete it, or replace it.
When you want to work with a data tree structure other than the one currently being displayed in the Data Set Navigation pane, you can use the Load option of the File menu, as described above, to load any other desired tree file.
To exit from the Analyzer, choose the Quit option from the File menu.
This section describes how to use the following options on the Edit menu:
This section describes how to manually add individual data set paths to the Data Set Navigation pane.
To group individual data set paths into named router groups that appear automatically in the Data Set Navigation pane, refer to the "Creating and Saving a Named Router Group" section.
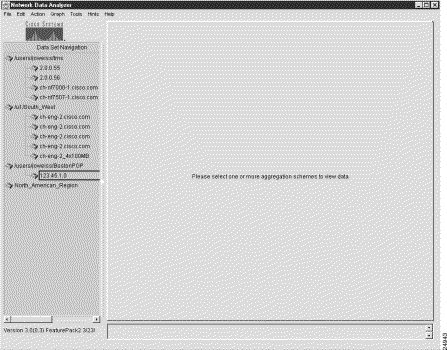
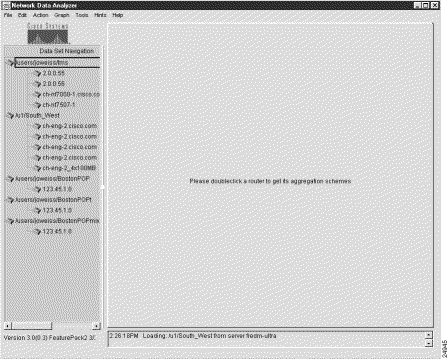
To retrieve and analyze either NetFlow data or TMS traffic data on initial startup of the Display module, you must know beforehand the location of specific directories in a FlowCollector host or an NFS-mounted storage volume in which desired traffic information is known to be stored. Hence, you must add to the Data Set Navigation pane those data set paths that point to NetFlow or TMS traffic data of interest.
To add individual data set paths manually to the Data Set Navigation pane, perform the following steps:
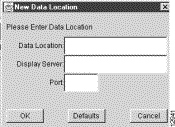
Step 2 Enter the appropriate information to define the desired data set path:
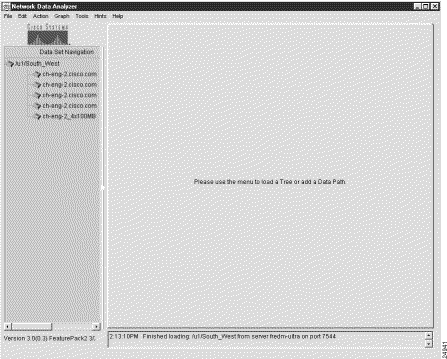
a. Data Location—This field identifies the directory in a storage repository (/u1/South_West, for example) that you know contains the desired NetFlow data. You must uniquely define this directory so that it can be accessed directly by the DisplayServer module specified in (b) below.
b. Display Server—This field identifies the DisplayServer host (fredm-ultra, for example) that was configured to service user requests for traffic data. The DisplayServer retrieves the requested data from the directory specified in (a) above. You can identify the DisplayServer host by its logical name (fredm-ultra, for example) or its IP address.
c. Port—This field identifies the application port number used by the DisplayServer specified in (b) above in servicing user data requests.
Step 3 When you complete the fields of the New Data Location dialog box, as shown below, click OK.
This step adds the specified new data set path into the Data Set Navigation pane, as shown in Figure 3-8.
By repeating this procedure, you can add multiple data set paths to the Data Set Navigation pane.
To conserve available space in the Data Set Navigation pane, add only those data set paths relevant to your current Display module session.
 |
Note When Version 3.0 or higher of the FlowCollector is running with the NFC20_COMPATIBLE_MODE flag set to "no" in its nf.resources file, an extra node is added to the directory structure for collections that include the thread ID. Take this extra node into account when specifying the location of data collected in this manner. |
|
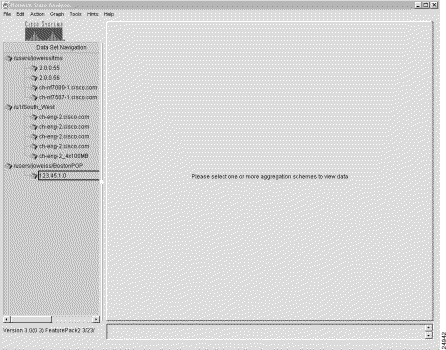
Note Note that the data exporting device "ch-2-eng2.cisco.com" is listed multiple times in the Data Set Navigation pane shown in Figure 3-8. This is not an unusual circumstance, since the same device can be exporting NetFlow data from multiple ports. |
It can be useful to combine several individual data set paths into a named router group that relates to a particular set of routers or switches in your network.
A named router group constitutes a working data tree structure that you can load into the Data Set Navigation pane at any time as a single entity, eliminating the need to populate the Data Set Navigation pane manually with data set paths at each startup of the Display module. Defining a named router group for each of your operating needs enables you to load, change, and delete named router groups at will to serve a variety of Analyzer operating needs.
|
Note Each data set path can be assigned to one or more named router groups by using the clone option from the Properties menu. This does not alter the links to directories in the designated NetFlow or TMS data storage facilities. The integrity of all data set paths and associated directory pointers is preserved. |
For more information on cloning, see the "Cloning Function of the Properties Window" section.
To group multiple data set paths into a named router group, perform the following steps:
If the Data Set Navigation pane is not already populated with appropriate data set paths (such as those shown in Figure 3-9), add any number of data set paths individually to the Data Set Navigation pane through successive uses of the Add Data Path option of the Edit menu.
The procedure for this function is described in the "Adding Data Set Paths to the Data Set Navigation Pane" section.
Step 2 Add the Add Router Group name to the Data Set Navigation pane by doing the following:
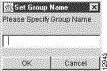
a. From the Edit menu, choose the Add Group option. The following Set Group Name popup window appears:
b. In this Set Group Name window, enter a router group name of your choice, such as "North_American_Region."
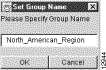
c. Click OK.
Step 3 Populate the named router group with data set paths.
Using the data set paths already present in the Data Set Navigation pane, drag the desired data set paths one at a time into the router group named "North_American_Region."
Click the desired data set path to highlight it. Hold down the left mouse button and drag the data set path into the named router group.
Repeat this step as many times as necessary to compose the named router group. For this example, assume that you want to drag the data set paths "/users/joweiss/tms," "/u1/South_West," and "/users/joweiss/BostonPOP" into the named router group.
|
Note Each data set path can be assigned to one or more named router groups by using the clone option from the Properties menu. This does not alter the links to directories in the designated NetFlow or TMS data storage facilities. The integrity of all data set paths and associated directory pointers is preserved. |
Step 4 After composing the named router group, you can
Step 5 Save the existing data tree structure to a file. To do so
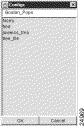
a. From the File menu, choose the Save option. The following Configs popup window appears:
b. Enter a file name of your choice in the blank field at the top of the window to identify the saved file. Assume that you want to name the file "North_American_Region." The popup window appears as follows:
c. Click OK to save the file.
On completion of this procedure, the Data Set Navigation pane contains the named router group shown in Figure 3-11.
With this working data tree structure in place in the Data Set Navigation pane, you can select any available aggregation scheme in the pane as the basis for Display module tasks.
This section describes how to "clean up" the existing data tree structure in the Data Set Navigation pane by using the Remove Router Or Group option of the Edit menu.
Your existing data tree structure might become outdated due to changes in your networking or data exporting environment. Such changes may include
Any fundamental configuration changes to FlowCollectors or the directory pointers for stored traffic information can potentially invalidate an existing data set path or an existing element of a named router group. For this reason, the Display module allows you to tailor the contents of the Data Set Navigation pane.
The sample tree structure shown in Figure 3-12 shows a context for removing selected elements of a data tree structure from the Data Set Navigation pane.
To remove any element of the tree structure currently being displayed in the Data Set Navigation pane, perform the following steps:
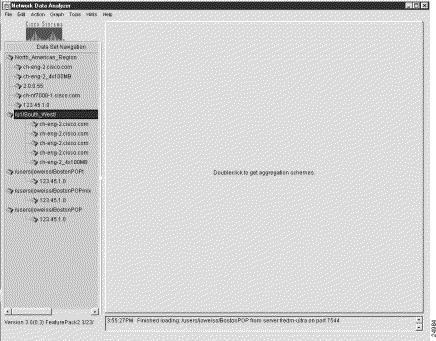
Step 2 Click the router group name "u1/South_West" to highlight it. This action changes the appearance of the Display module window (see Figure 3-13).
Step 3 From the Edit menu, choose the Remover Router Or Group option.
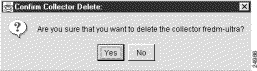
The following popup window prompts you for confirmation of your intent to delete the selected router group:

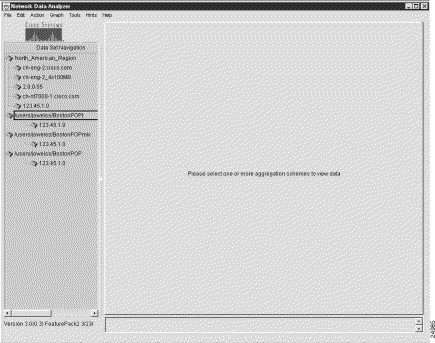
Step 4 Click Yes. The Data Set Navigation pane then appears as shown in Figure 3-14.
Using the procedure outlined above, you can remove any logical element of an existing data tree structure.
If you select any part of an existing data tree structure for deletion other than one at "root" level (left-justified in the pane), the Remove Router Or Group option remains grayed out. In other words, the Remove Router Or Group option of the Edit menu is effective only with respect to an entire selected router group or selected data set path.
By choosing the Properties option from the Edit menu, you can display the properties of any router that you select in the Data Set Navigation pane.
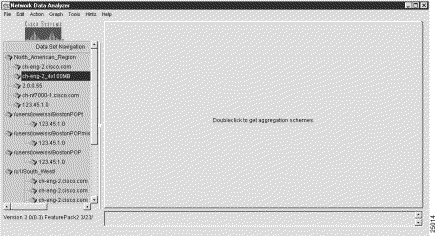
For example, assume that you clicked the router ch-eng-2_4x100MB shown in Figure 3-15 to select it. To display the properties of the selected router, you need only choose the Properties option from the Edit menu.
When you choose the Properties option from the Edit menu, the following Properties window appears, displaying the properties of the selected router:
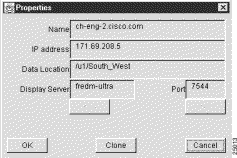
This window displays the following information about the selected router:
The buttons at the bottom of the Properties window perform the following functions:
The Properties window enables you to clone the name and the properties of a selected router into another selected router group. For example, the cloning process includes the following generalized steps:
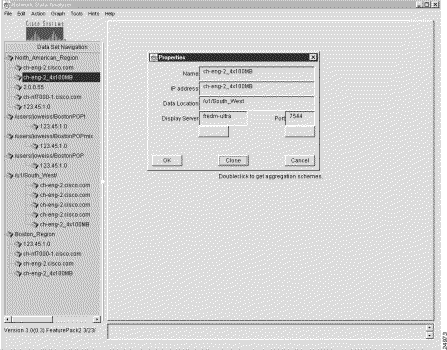
Step 2 With this router selected, select the Properties option of the Edit menu.
This action pops up a Properties window on the main Display module window (see Figure 3-17).
|
Note You cannot edit the fields of the Properties window. The window displays the properties of the selected router. |
Step 3 Click the Clone button in the Properties window.
This action pops up a Pick a Target Group window on the Properties window (see Figure 3-18).
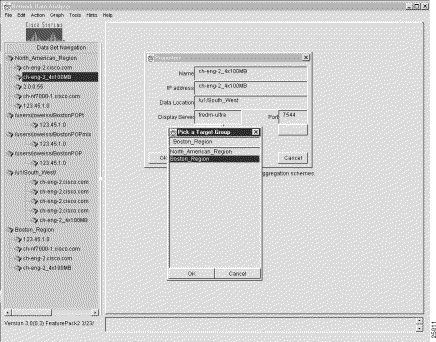
Step 4 In the Pick a Target Group window, select the name of the named router group into which the selected router is to be cloned, such as "Boston_Region."
Step 5 To execute the cloning function, click Boston_Region (to replicate its name in the field at the top of the window).
Step 6 Click OK.
These steps cause the router named ch-eng-2_4x100MB to be cloned into the router group named Boston_Region, as demonstrated by the new entry at the bottom of the Data Set Navigation pane shown in Figure 3-19.

The Action menu provides the following selectable options:
The following sections describe how to use these menu options.
This section describes procedures for retrieving and displaying traffic information for
A common Analyzer task is to display traffic information for a selected device and aggregation scheme.
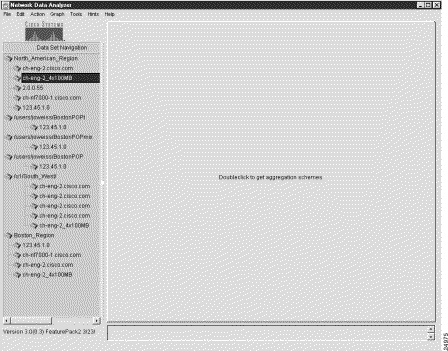
For purposes of this section, assume that you added the data tree structure shown in Figure 3-20 to the Data Set Navigation pane.
To display traffic data for a selected device and aggregation scheme, perform the following steps:
Double-click the name of the router of interest in the Data Set Navigation pane (see Figure 3-20).
Assuming that "ch-eng-2_4x100MB" is the device of interest, double-click the device name to list its applicable aggregation schemes in the Data Set Navigation pane.
Step 2 Select the aggregation scheme that you want to apply for display purposes.
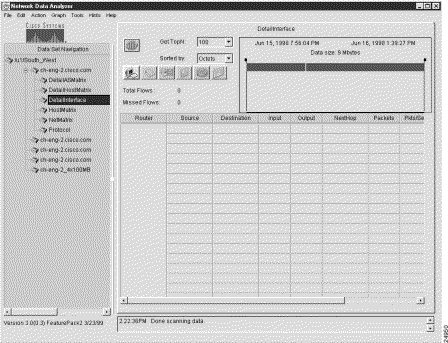
For example, assume that you want to display traffic information for the DetailInterface aggregation scheme. Click this aggregation scheme.
This action causes a "clean" display pane labeled DetailInterface to appear in the Display module window (see Figure 3-21).
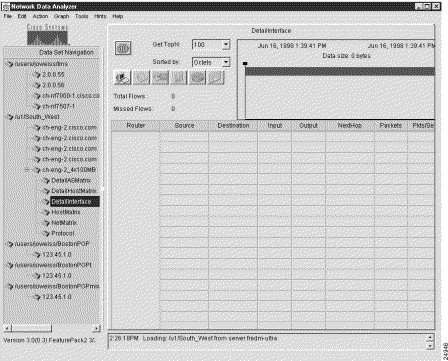
Note that the time line area in the top right portion of the window indicates the range of dates and times for which data is available for the selected router and aggregation scheme.
Step 3 To establish the desired time horizon for data retrieval purposes, position the time slider marks, as appropriate.
You can move either time slider mark in either horizontal direction to establish the desired time period.
Step 4 Click the Get TopN drop-down menu to select the number of traffic flows that you want taken into account in data retrieval operations.
The selectable values of "N" range from 10 to 10,000. The value 100 is the default.
The value that you select determines the relative volume of traffic data to be retrieved and processed for the selected aggregation scheme.
For example, if you select "10" as the TopN value, you limit the volume of traffic data to be processed to the first ten traffic flows.
Selecting a lower value for N tends to improve Analyzer performance, because less information is processed in satisfying the data display request.
Step 5 Click the Sorted by drop-down menu to select the desired sort key for displaying the traffic data.
For this purpose, assume that the data is to be sorted by "Octets."
Step 6 Click the Get Data from Server button in the display pane (the leftmost button).
Alternatively, from the Action menu you can choose the Get Data option to initiate the retrieval and display of traffic data for the selected aggregation scheme.
The result of this procedure is shown in Figure 3-22.
A common Analyzer task is to display traffic information for a selected aggregation scheme that is common to selected devices in a named router group.
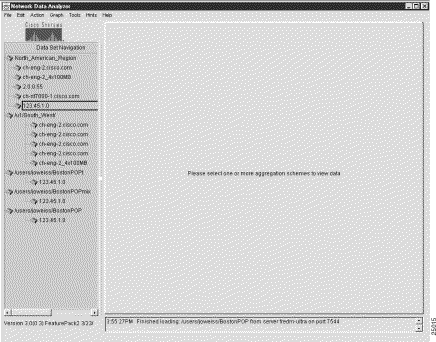
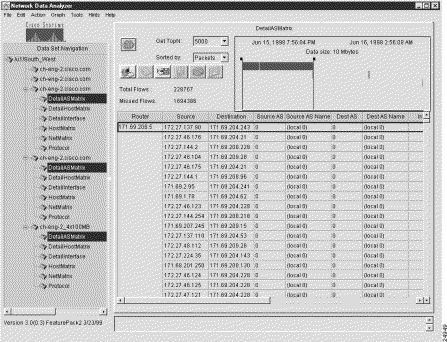
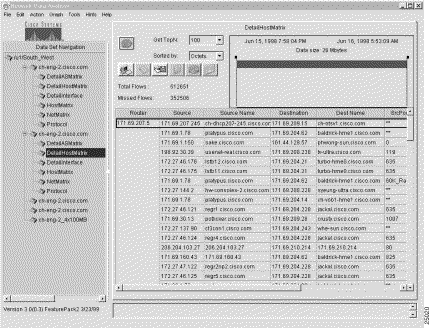
Figure 3-23 shows the tree structure for the named router group, "/u1/South_West," that serves as the basis for the procedures described in this section. Figure 3-23 indicates that you want to display NetFlow data for the DetailASMatrix aggregation scheme for three exporting devices that are common to the named router group.
For details about how to create a named router group, refer to the "Creating and Saving a Named Router Group" section.
To display NetFlow data for an aggregation scheme that is common to selected devices in a named router group, perform the following steps:
To select a common aggregation scheme among two or more devices, press the Ctrl key and click the name of each scheme.
Step 2 Position the time slider marks in the display pane, as desired, to establish the applicable time horizon for display operations.
Step 3 Click the Get TopN drop-down menu in the display pane to select the number of traffic flows ("N") that you want taken into account for display purposes. The default value is 100.
Step 4 Click the Sorted by drop-down menu in the display pane to select the desired sort key for display purposes. The default value is Octets.
Step 5 Click the Get Data from Server button in the display pane (the leftmost button).
Alternatively, from the Action menu, choose the Get Data option to initiate the display operation for the selected aggregation scheme.
On completion of the above procedure, traffic data for the selected aggregation scheme appears (see Figure 3-24).
The applicable aggregation scheme data for each selected device is "stacked" in the display pane one below another, beginning with the first selected device and continuing to the last selected device.
As with all display functions, when the overall data array exceeds the observable "at-a-glance" space in the display pane, you can use the horizontal and vertical scroll bars to view any area of the display.
By using similar data tree structures in this manner for multiple devices in a named router group, you can select any aggregation scheme common among any combination of devices in the group and initiate display functions for the selected devices. This capability enables you to compare traffic patterns and statistics of interest between exporting devices in the group.
For purposes of this section, the working data tree structure shown in Figure 3-25 is assumed to be the basis for sort operations.
You can select any aggregation scheme in an existing data tree structure, retrieve the applicable traffic data for that aggregation scheme, select any column of the data array, and sort the data in that column.
To sort data for a selected aggregation scheme, perform the following steps:
Step 2 Click the DetailInterface aggregation scheme to access a "clean" display pane.
Step 3 Prepare for sort operations, as follows:
a. Position the time slider marks in the display pane, as desired, to establish the applicable time horizon for governing the extent of data retrieval.
b. Click the Get TopN drop-down menu in the display pane to select the number of traffic flows ("N") that you want taken into account for data retrieval purposes. The default value is 100.
c. Click the Sorted by drop-down menu to select the desired sort key for display purposes. The default value is Octets.
Step 4 Click the Get Data from Server button in the display pane.
Alternatively, from the Action menu, choose the Get Data option to initiate data retrieval and display for the selected aggregation scheme.
Step 5 When the data for the selected aggregation scheme appears in the display pane (Figure 3-26), you can sort the data in either of two ways:
For purposes of this step, assume that you want to sort the data in the Packets column of the data array.
This procedure results in the data array shown in Figure 3-27.

Note that the data in the Packets column of the aggregation scheme is sorted in descending numerical order.
The Translate Host Addresses option of the Action menu enables you to translate IP addresses appearing in the Source or Destination columns of a displayed NetFlow data aggregation scheme into equivalent host names.
Table 3-1 lists the NetFlow data aggregation schemes and the key columns applicable to each scheme. For purposes of translating host IP addresses, the applicable key columns of a NetFlow data aggregation scheme include only the following:
The Translate Host Addresses option is applicable only to NetFlow data aggregation schemes that incorporate Source or Destination columns in the displayed aggregation scheme. If the Translate Host Addresses option is not available, it is grayed out.
When you invoke the Translate Host Addresses option, the NetFlow data array in the display pane changes, as follows:
The following Display module functions incorporate an IP address translation function:
Figure 3-28 shows a typical NetFlow data aggregation scheme containing Source and Destination columns.
If you invoke the Translate Host Addresses option while this aggregation scheme is in effect, the data array is altered as follows:
The result of this IP translation function is shown in Figure 3-29.
You may find it useful to sort the host names appearing in the Source Name and Dest Name columns of a NetFlow data array.
For example, if your network has several exporting devices that are identified with host names that vary slightly from each other (such as fredm-ultra, fredm-sun, fredm-pc), you can perform a sort on the Source Name or the Dest Name column in the data array. In this example, the sort operation causes the "fredm" host devices to sort the data alphabetically and rearrange it in the resulting data array.
The Display module Graph menu provides the following selectable options:
The following sections describe how you use these menu options.
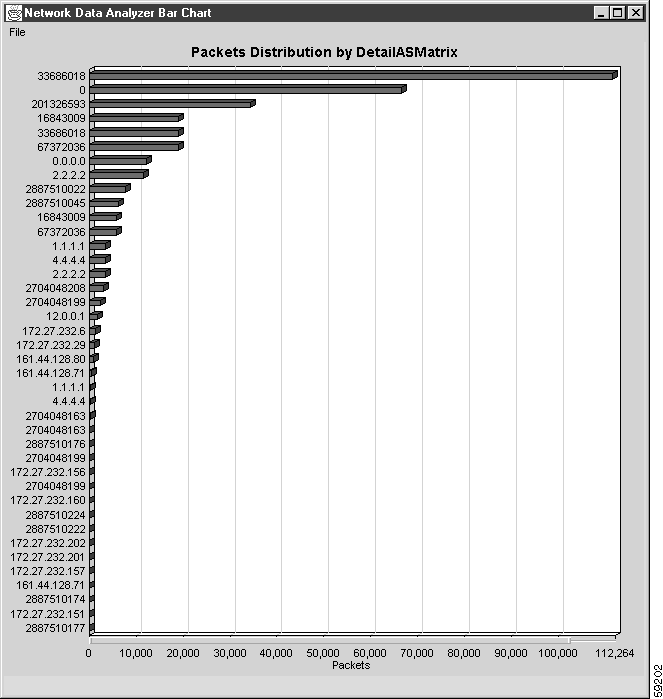
The data in the DetailInterface aggregation scheme shown in Figure 3-30 is used as the basis for illustrating the Analyzer's bar chart function.
The Packets column of the aggregation scheme is highlighted, indicating that you can use the data in this column for creating a bar chart. You can select any of the six value columns of a NetFlow data aggregation scheme, or any of the 14 value columns of a TMS data aggregation scheme as the basis for creating a bar chart.
You can use either of two methods to create a bar chart representation of the traffic information in the Packets column (or any other value column of a NetFlow or TMS data aggregation scheme):
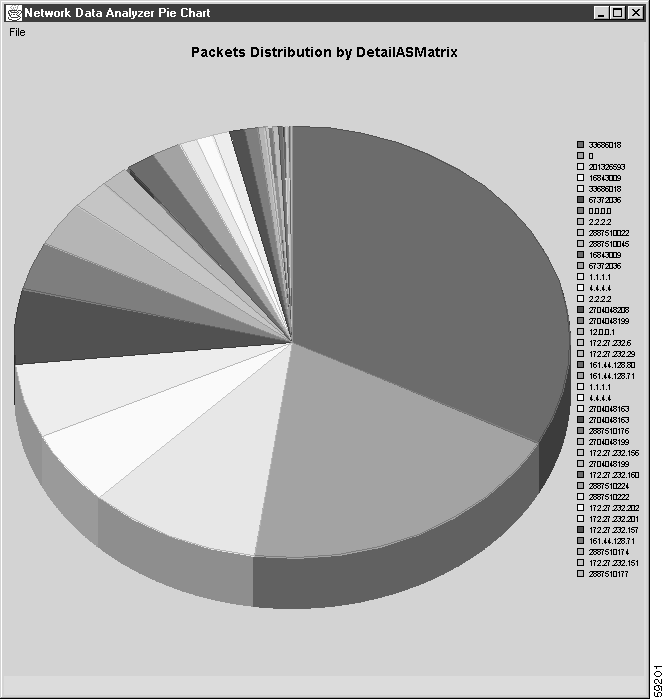
For this section, the aggregation scheme data shown in Figure 3-32 serves as the basis for illustrating pie chart creation.
The Packets column of the aggregation scheme is highlighted, indicating that you can use the data in this column for creating a pie chart. As with bar charts, you can select any of the six value columns of a NetFlow data aggregation scheme, or any of the 14 value columns of a TMS data aggregation scheme as the basis for creating a pie chart.
You can use either of two methods to create a pie chart representation of the traffic information in the Packets column (or any other value column of a NetFlow or TMS data aggregation scheme):
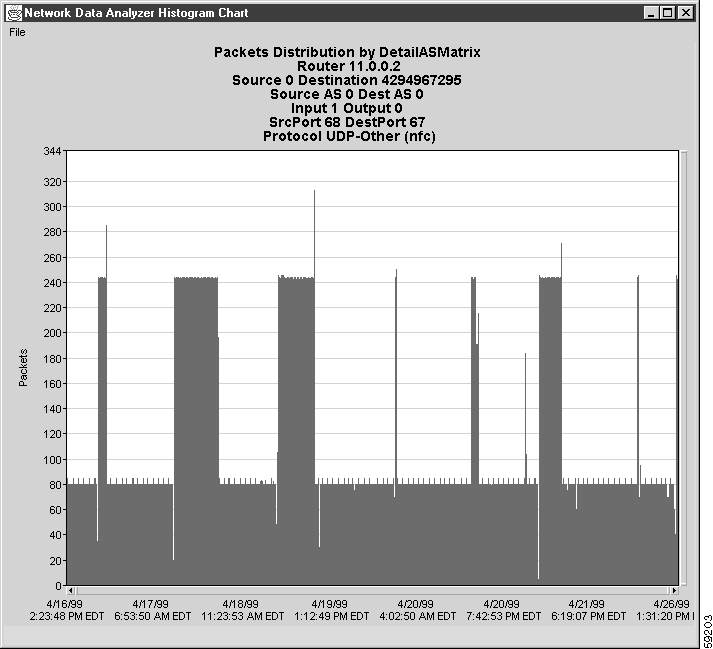
For the purpose of creating a histogram, use the data in the DetailInterface aggregation scheme shown in Figure 3-34. The Bytes column in the data array is highlighted, indicating that the data in this column will be used as the basis for creating the histogram. Note also that you must select a row in the overall NetFlow data array for which you want a histogram representation of traffic data.
|
Note The Analyzer does not support the display of TMS data as a histogram chart. |
You can use either of two methods in creating a histogram representation of the traffic information in the Bytes column (or any other value column of a NetFlow data aggregation scheme):
This section describes the following Tools menu facilities for data exploration:
The AS Drill Down Window option enables you to take a closer look at traffic data pertaining to multiple devices involved in traffic flows between source AS and destination AS systems in your network. An AS (autonomous system) is a network, or a collection of networks, operating under a common network administration and routing strategy.
In AS networks, it is often useful to examine traffic data closely for several devices in the network to determine the best way to administer the network and use its resources. The AS Drill Down window of the Display module provides this capability.
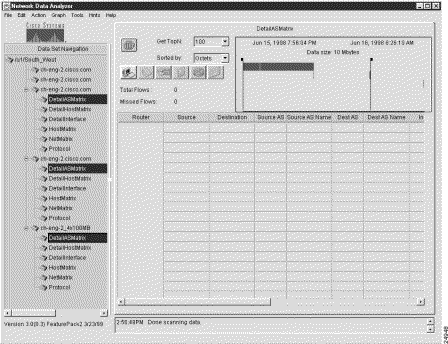
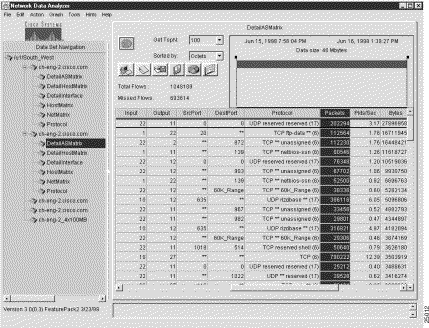
The AS Drill Down Window option of the Tools menu is used with the DetailASMatrix aggregation scheme. Figure 3-36 shows a typical data array for DetailASMatrix aggregation schemes for three selected devices.
To drill down on NetFlow data pertaining to source and destination AS systems in your network, perform the following steps:
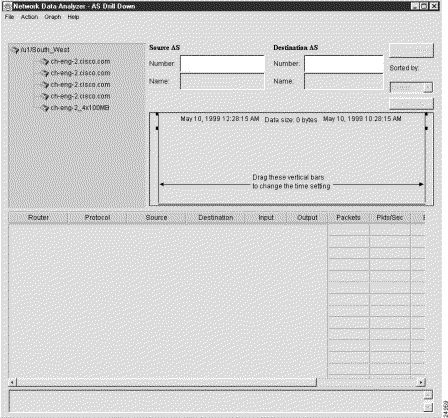
The data tree structure shown in the Data Set Navigation pane of Figure 3-36 is propagated into the equivalent area of the AS Drill Down window for device selection purposes in initiating AS drill down functions. In addition, the time line area in the top right portion of the window indicates the ranges of dates and times for which data is available for the selected routers and aggregation schemes.
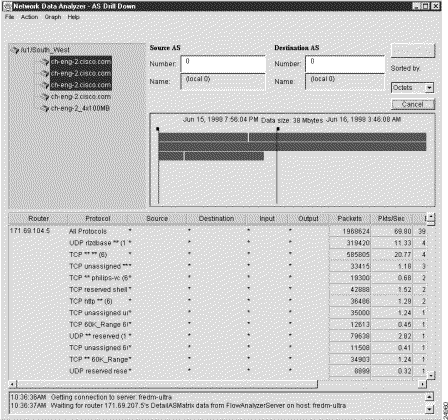
Step 2 Select those devices that you want to use for AS drill down operations (see Figure 3-38).
Assume, for example, that you want to include the first three devices in the router group named "/u1/South_West," as follows:
While pressing the Ctrl key, click each device name to highlight it.
|
Note Note that the three selected devices have the same name. This circumstance is not unusual because the same device can be exporting NetFlow data from multiple ports. |
Step 3 Establish the desired parameters for performing the AS drill down operations:
a. Enter the Source AS number and the Destination AS number in the appropriate fields of the AS Drill Down window. For this example, assume that "0" is entered in the Source and Destination AS fields.
b. From the Action menu of the AS Drill Down window, select the Show Times option, or click the Show Times button. This action shows the time spans for which aggregation scheme data has been collected for the selected devices.
c. Position the time slider marks to establish the desired time setting for retrieving traffic data for the three selected devices.
d. Choose a value for the Sorted by field. Choices include the following:
e. Click the Get Data button in the ASDrill Down window to initiate data retrieval.
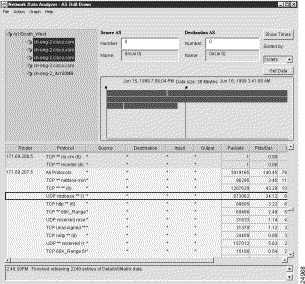
Step 4 To drill down on (get more detail about) the protocols that a selected device uses, do the following:
a. If necessary, to view the desired data for the device of interest, click the vertical scroll bar in the right margin of the AS Drill Down window.
b. If necessary, click and drag the sizing bar in the right margin of the Protocol column header to expand the column enough so that you can view all the information in that column.
c. Select the desired row in the Protocol column for the selected device.
Step 5 To collapse (hide) the AS data currently being displayed for the selected row, select the Hide Drill Down Data option from the Action menu in the window.
This action causes the NetFlow data array to revert to its previous form (as shown in Figure 3-40), at which point you can select any other Protocol row for any other selected device and use that row as the basis for AS drill down operations.
You can perform a series of AS drill down operations for any number of Protocol rows in the data array for a selected device.
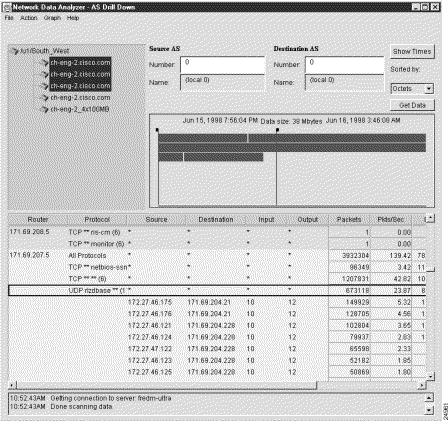
In the AS Drill Down window, an asterisk appearing in any Protocol row of the traffic data array indicates that additional information relating to the DetailASMatrix aggregation scheme is available for display purposes.
For any such row, you can do either of the following:
By successively double-clicking a series of rows containing an asterisk, you can open each row and view more detail about the specific end-to-end flows with the specific protocol seen on that selected interface.
If you drill down on any row in the Protocol column of an AS Drill Down window that contains asterisks, the following columns of the displayed data aggregation scheme are expanded:
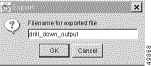
You can export (save) drill down data to a named file at any time. To export drill down data to a named file, perform the following steps:
Step 2 Select the format in which you want the data to be written:
The following Export popup window appears:
Step 3 Choose a name by which you want the displayed drill down data to be saved, such as "drill_down_output."
Step 4 Enter the name of the file in the space provided in the Export popup window, as shown below.
Step 5 Click OK.
The following message box appears, identifying the saved file by name and indicating the location in which it is stored.
If you selected CSV format
If you selected HTML format
You can search for traffic flows by
The following sections describe
Then there is a detailed description of each search procedure.
Use the Search Window option of the Tools menu only in connection with the DetailASMatrix aggregation scheme. Before you can perform search operations involving this aggregation scheme, the following conditions must exist:
Figure 3-42 shows a sample data tree structure that meets these requirements.
When you select the Search Window option of the Tools menu, a separate Search Window appears on the Display module screen (see Figure 3-43). Note that the current contents of the Data Set Navigation pane are propagated into the pane labelled "Using these routers" for device selection purposes.
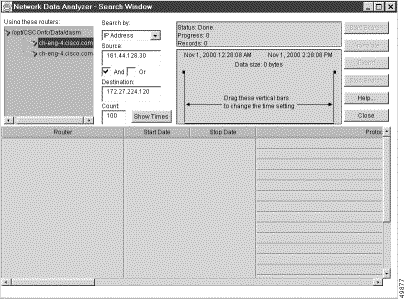
When you access the Search Window by choosing the Search Window option from the Tools menu, you can initiate search operations by performing the following steps:
In choosing devices that you want to apply for search purposes, you have the following options:
Step 2 Select the type of search from the following "Search by" selections:
Step 3 Perform the appropriate actions based on the type of search you are doing. If you search by
192.69.0.0/16
|
Note If you want to search for only one field, you can enter an asterisk (*) in the Source or Destination field during an "And" search or an exclamation point (!) in the Source or Destination field in an "Or" search. |
Step 4 Check the And or Or check box, as appropriate, to define the desired boolean operator for the intended search operation.
Step 5 Click the Show Times button.
Step 6 Position the time slider marks, as appropriate, to define the time horizon for which DetailASMatrix aggregation scheme data is to be retrieved and processed during search operations.
Step 7 Click the Start Search button.
The different searches that you can perform using this generalized procedure are described in the following sections.
The Search option of the Tool menu enables you to search for traffic flows in the following ways:
Procedures for initiating searches for the above types of traffic flows appear in the following sections.
This search operation looks for traffic flows that occurred between a specified source device and a specified destination device.
To search for traffic flows between one IP address and another IP address, perform the following steps:
Step 2 In the Destination field, enter the IP address of the destination device that received the flows (172.27.224.120, for example).
Step 3 Check the And check box.
Step 4 Click the Show Times button, adjust the time slider marks, as desired, and click the Start Search button.
This procedure finds the traffic flows that originated from the source device (161.44.128.130) and that were received by the destination device (172.27.224.120).
Figure 3-44 shows sample output from the above IP-to-IP search operation.
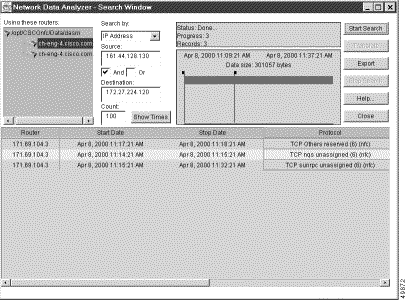
If you scroll to the right, the following fields are displayed:
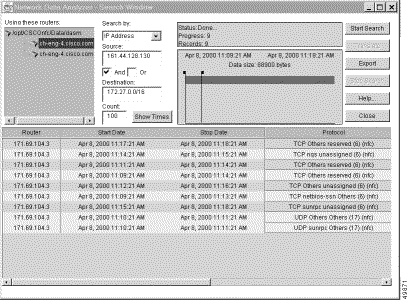
This search operation looks for traffic flows that occurred between a specified source device and destination devices that have IP addresses within a specified range on a subnet.
To search for flows between a specified source device and a range of subnet addresses, perform the following steps:
Step 2 In the Destination field, enter the subnet address of the destination devices that received the flows (172.27.0.0/16, for example).
Step 3 Check the And check box.
Step 4 Click the Show Times button, adjust the time slider marks, as desired, and click the Start Search button.
This procedure finds the flows that originated from the source device with the IP address 161.44.128.130 and that terminated at destination devices having IP addresses in the range 172.27.0.0 to 172.27.255.255.
Figure 3-45 shows sample output from the above IP-to-subnet search operation.
Note that you can swap the contents of the Source and Destination fields to accomplish the reverse of the search operation described above. This procedure is described in the following section.
To search for flows between a range of subnet addresses and a specified IP address, perform the following steps:
Step 2 In the Destination field, enter the IP address of the destination device that received the flows (161.44.128.130, for example).
Step 3 Check the And box.
Step 4 Click the Show Times button, adjust the time slider marks, as desired, and click the Start Search button.
This procedure finds the flows that originated from the source devices having IP addresses in the range from 172.27.0.0 to 172.27.255.255 and that were received by the destination device at IP address 161.44.128.130.
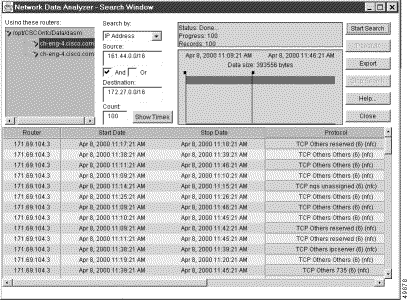
This search operation looks for traffic flows that occurred between source devices having IP addresses within a specified range and destination devices having IP addresses within a specified range.
To search for flows between one subnet address and another subnet address, perform the following steps:
Step 2 In the Destination field, enter the subnet address of the destination devices that received the flows (172.27.0.0/16, for example).
Step 3 Check the And check box.
Step 4 Click the Show Times button, adjust the time slider marks, as desired, and click the Start Search button.
This procedure finds the flows that originated from the source devices having an IP address in the range from 161.44.0.0 to 161.44.255.255 and that were received by the destination devices having an IP address in the range from 172.27.0.0 to 172.27.255.255.
Figure 3-46 shows sample output from the above subnet-to-subnet search procedure.
This search operation looks for traffic flows that occurred between a specified source device and destination devices other than those having IP addresses within a specified subnet's range.
To search for flows that a specified device directs to other devices in the network, except to certain specified devices, perform the following steps:
Step 2 In the Destination field, enter the ! character, followed by a subnet address range (!172.27.0.0/16, for example). The exclamation point (!) is a "not" operator that means "any but those" addresses specified in the subnet address. This operator limits the scope of the search operation.
Step 3 Check the And box.
Step 4 Click the Show Times button, adjust the time slider marks, as desired, and click the Start Search button.
This procedure finds the flows that originated from the specified device (171.69.209.29) and terminated at devices other than those having an IP address in the specified range (172.27.0.0 to 172.27.255.255).
Figure 3-47 shows sample output from the search procedure outlined above.
Note that you can swap the contents of the Source and Destination fields to accomplish the reverse of the search operation described above. This reverse procedure is described in the following section.
To search for flows that originate anywhere in the network (except from devices having an IP address in a specified range) and that terminate with a specified device, perform the following steps:
The exclamation point (!) is a "not" operator that means "any but those" addresses specified in the subnet address. This operator limits the scope of the search operation.
Step 2 In the Destination field, enter the IP address of the destination device that received the flows (171.69.209.29, for example).
Step 3 Check the And check box.
Step 4 Click the Show Times button, adjust the time slider marks, as desired, and click the Start Search button.
This procedure finds all the traffic flows that originated from anywhere in the network (except for those devices having an IP address in the range from 172.27.0.0 to 172.27.255.255) and that were received by the destination device at IP address 171.69.209.29.
To search for flows by source and destination AS number, perform the following steps:
Step 2 In the Source field, enter the AS number of the source AS that originated the flows (0, for example).
Step 3 In the Destination field, enter the AS number of the destination AS that received the flows (0, for example).
Step 4 Check the And or Or check box. (In this example, we use And.)
Step 5 Click the Show Times button, adjust the time slider marks, as desired, and click the Start Search button.
This procedure finds all the traffic flows that originated from the flows having a source AS number of 0 and that had a destination AS number of 0.
Figure 3-48 shows sample output from the source and destination AS number search procedure described above. Scroll to the right to view the source and destination AS number.
To search for flows by source and destination port, perform the following steps:
Step 2 In the Source field, enter the port number of the source port that originated the flows (119, for example).
Step 3 In the Destination field, enter the port number of the destination port that received the flow (514, for example).
Step 4 Check the And or Or check box. (In this example, we use Or.)
Step 5 Click the Show Times button, adjust the time slider marks, as desired, and click the Start Search button.
This procedure finds all the traffic flows that originated from source port number 119 and that had a destination port number of 514. Figure 3-49 shows sample output from the source and destination port search procedure described above. Scroll to the right to view the source and destination ports.
You can export (save) search results to a named file at any time. To export search results to a named file, perform the following steps:
Step 2 Select the format in which you want the data to be written:
The following Export popup window appears:
Step 3 Choose a name by which you want the displayed drill down data to be saved, such as "search_output."
Step 4 Enter the name of the file in the space provided in the Export popup window, as shown below.
Step 5 Click OK.
The following message box appears, identifying the saved file by name and indicating the location in which it is stored.
If you selected CSV format
If you selected HTML format
This section describes the following Tools menu facilities for data collection:
This section describes the facilities provided by the Analyzer for controlling traffic matrix statistics (TMS) data collections.
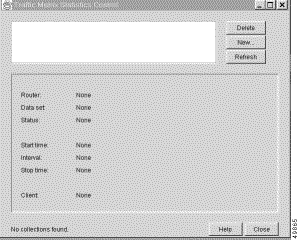
Depending on whether or not TMS collections have already been defined, either of two versions of the Traffic Matrix Statistics Control window appears when you choose the TMS Collection Control option of the Tools menu:
For purposes of this section, it is assumed that no TMS collections were defined. When you click the New button in the Traffic Matrix Statistics Control window, the Configuration Files Directory window shown in Figure 3-52 appears, prompting you to enter the name of a directory on a host UtilityServer that contains configuration files for the routers and switches in your network.
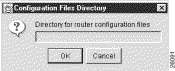
Typically, the directory path name that you enter into the Configuration Files Directory window points to the directory "/tftpboot/configs/" created previously on a host UtilityServer for storing router configuration files.
There must be a configuration file in this directory for each TMS export-capable device that you intend to control by means of the Traffic Matrix Statistics Control window. You create router configuration files at installation time when you configure devices to operate in your network. Thus, for each new device so configured, you log on to the device and copy its running configuration file into the /tftpboot/configs/ directory.
The configuration file directory provides the names, interfaces, and passwords of network devices, enabling you to log on to any TMS export-capable device in the network and to configure that device for TMS collections by means of the Traffic Matrix Statistics Control window.
Typically, you store the router configuration files on a designated UtilityServer host in the network. However, you can store such files on any NFS-mounted volume in the network that is accessible to the UtilityServer. In other words, the directory path name that you enter in the Configuration Files Directory window can point to a directory on any UNIX platform in the network that is reachable by the UtilityServer.
After you enter a directory path name in the Configuration Files Directory window, click OK. If the specified directory path name is valid, the Traffic Matrix Statistics Control window shown in Figure 3-50 appears. Select any named collection listed in the rectangular TMS collection name area at the top of this window as the target for configuring the new TMS collection parameters. See the "Defining Parameters for a New TMS Collection" section.
If you decide to abandon the directory specification task, click Cancel in the Configuration Files Directory window to return to the Traffic Matrix Statistics Control window.
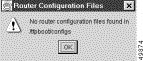
If the directory path name that you enter in the Configuration Files Directory window contains no configuration files, or if you specify the directory path name incorrectly, the following Router Configuration Files window appears.
You define a new TMS collection by setting specific parameters in the Traffic Matrix Statistics Control window.
When you click the New button in the Traffic Matrix Statistics Control window and a valid router configuration files directory exists on a designated UtilityServer host in the network, the Traffic Matrix Statistics Control window shown in Figure 3-53 appears. This window incorporates a New Collection panel that enables you to define a new TMS collection process.
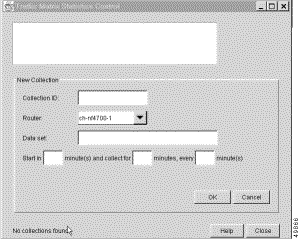
The New Collection panel provides facilities for defining the following TMS collection parameters:
If you want to abandon the TMS collection definition task, click Cancel. Doing so clears the fields of the New Collection panel and returns you to the Traffic Matrix Statistics Control window.
The sample data entered as described above is reflected in the completed New Collection panel shown in Figure 3-54.
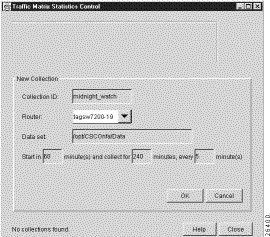
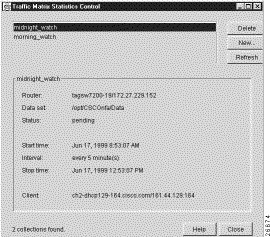
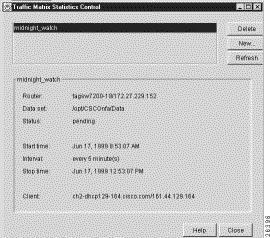
When you click OK in the New Collection panel after specifying the TMS collection control parameters described in the preceding section, the Traffic Matrix Statistics Control window takes the form shown in Figure 3-55. Note that the new collection name "midnight_watch" now appears at the top left corner of the window.
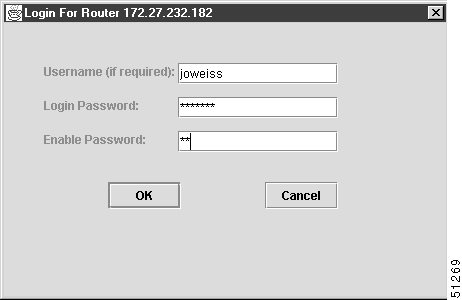
If the router requires that you enter a password when you log on, a screen like the one shown in Figure 3-56 is displayed.
You can define any number of TMS collections in the manner described in the preceding section, but you can specify only one TMS collection for a given device.
Once TMS collections are defined and listed in the Traffic Matrix Statistics Control window, you can
This section describes the configuration and control facilities provided by the NetFlow Collection Control window, which is accessed when you choose the NetFlow Collection Control option of the Tools menu.
For NetFlow data to be collected successfully
Therefore, if no FlowCollectors have been defined previously in the UtilityServer's NFCCC.txt file when you choose the NetFlow Collection Control option, you must satisfy the requirements outlined in the following sections before you can access the collection control facilities of the NetFlow Collection Control window.
This section describes a series of screens that the Display module presents to you if no FlowCollectors were defined previously in the UtilityServer's NFCCC.txt file. In this case, the following Network Data Analyzer Start Up dialog box appears:
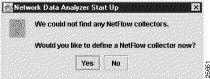
If you click Yes, the following New Collector Dialog box appears, enabling you to enter the name of a FlowCollector to which you want to connect.
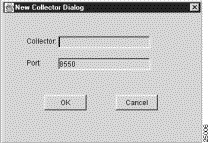
After you enter the FlowCollector name and click OK, the NetFlow Collection Control window appears, displaying the name of the desired FlowCollector in the Collector list of the window.
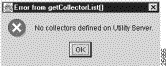
If you click Cancel in the New Collector Dialog window, the NetFlow Collection Control window appears without displaying the name of a FlowCollector in the Collector list of the window. In this case, if you close the NetFlow Collection Control window and again choose the NetFlow Collection Control option of the Tools menu in another attempt to connect to a FlowCollector, the following error message appears to remind you that no FlowCollectors were defined in the UtilityServer's NFCCC.txt file.
If you click No in the Network Data Analyzer Start Up window shown at the beginning of this section, the window again appears with a new query: "Would you like to configure routers to export NetFlow Data?"
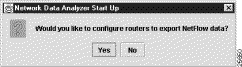
The "Configuring Routers for Data Export" section describes how you configure routers for the export of NetFlow or TMS data.
If you click Yes in response to the above configuration query, the following Configuration Files Directory popup appears, enabling you to enter the path name of the directory containing the router configuration files on the UtilityServer host.
After entering the path name, click OK.
If you click Cancel in the Configuration Files Directory window above, you will be returned to the main Display module window.
If you click No in response to the "Would you like to configure routers to export Netflow data?" query, the Network Data Analyzer Start Up window shown below appears, querying you: "Would you like to view NetFlow Data?"
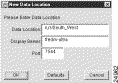
If you answer Yes to the query "Would you like to view NetFlow data?," the following New Data Location popup window appears, enabling you to enter the directory path name (/u1/South_West, for example) that contains the desired NetFlow data.
After you enter the directory path name in the Data Location field, click OK to proceed.
If you click Defaults, the default DisplayServer and port number are set. Also, the current contents of the Data Location field are cleared so that you can enter a desired directory path name.
If you click Cancel, the directory path name operation is abandoned.
If you answer No to the query "Would you like to view NetFlow data?," you are returned to the main Display module window without satisfying any of the prerequisites for viewing NetFlow data.
This section describes the FlowCollector files and Analyzer facilities that are used during the user name and password authentication process for a FlowCollector. A successful authentication process enables you to access desired NetFlow data stored on a FlowCollector.
The following two files in the FlowCollector's /opt/CSCOnfc/config directory are of consequence during FlowCollector startup and pertain to the user name and password authentication process:
You can configure a FlowCollector either to enforce or to ignore the user name and password authentication requirement during startup, as described below.
If the FlowCollector was configured to enforce user name and password authentication during startup, as described in the preceding section, the Display module prompts you to enter a user name and password in the User Name and Password Dialog box shown below.
You must supply this information correctly and click OK.
During a connection attempt, the Analyzer sends the user name that you enter by means of this User Name and Password Dialog box to the FlowCollector for comparison against the user name specified in the NFC_USERNAME variable in the nf.resources file. If a match is found, the connection request to the FlowCollector is granted.
After the connection to the FlowCollector is completed, the Analyzer includes the user name and password in every configuration and control command sent to that FlowCollector.
The password that you enter is sent to the FlowCollector in clear text format. Upon receipt, the FlowCollector encrypts the password and compares it to the encrypted password for the user defined by the NFC_USERNAME variable in the /opt/CSCOnfc/config/nf.resources file of the FlowCollector. There is no default value for the password.
After you enter a valid user name and password for the FlowCollector, you can store the user name in the /opt/CSCOnfa/NFAUtility/config/NFCCC.txt file that the UtilityServer maintains. You save the user name by means of the User Validation window described in the "Saving the User Name" section. The FlowCollector host system password, however, is not stored in the NFCCC.txt file.
If the authentication process completes successfully, you are connected to the FlowCollector and the NetFlow Collection Control window appears immediately. You can then use this window to configure and control one or more FlowCollectors, as described in the "Introduction to the NetFlow Collection Control Window" section.
If you enter an invalid password in the User Name and Password Dialog box, the following error message appears in the User Validation window:
In this case, you must enter the correct password and click OK to proceed.
If you cannot open a connection to the FlowCollector because it is unreachable or not operational for some reason, the following Message window is displayed.
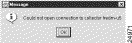
In this case, click OK and try again to connect to the FlowCollector. If you are unable to connect to the FlowCollector, determine the cause of the problem, if possible, and correct it.
The UtilityServer maintains a list of FlowCollectors in the NFCCC.txt file stored in its /opt/CSCOnfa/NFAUtility/config/ directory.
You establish the initial contents of this file when you install the UtilityServer. In so doing, you should consider all of the FlowCollectors that you intend to control by the NetFlow Collection Control window.
The UtilityServer maintains the following parameters in the NFCCC.txt file for each FlowCollector:
If the user name and password that you enter for a FlowCollector passes the authentication check during an Analyzer connection request, you can store the user name in the UtilityServer's NFCCC.txt file by means of the User Validation window shown below.
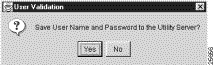
The capability to store the user name is provided as a user convenience in updating the NFCCC.txt file. If you forget the user name for the FlowCollector, you can view the contents of the NFCCC.txt file to refresh your memory.
For security reasons, the host FlowCollector system password is not stored in the NFCCC.txt file. Nevertheless, the password that you enter to satisfy the FlowCollector authentication process remains in effect for the duration of the current Display module session. The FlowCollector "remembers" the user password until you exit from the current Display module session.
If you exit the Display module and start again later, you must reenter the appropriate password for any FlowCollector that is configured to enforce user authentication.
If user authentication is enabled (the default state) on the FlowCollector to which you intend to connect, you will be prompted to specify a user name and password before being granted access to the FlowCollector.
When you complete the user authentication process, as described in the "User Name and Password Authentication Process" section, you are granted access to the NetFlow Collection Control window shown in Figure 3-57.
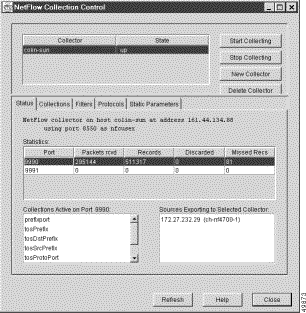
The rectangular area at the top of the NetFlow Collection Control window incorporates facilities that enable you to
|
Note This action initiates the flow of NetFlow data from the selected FlowCollectors to the UtilityServer. |
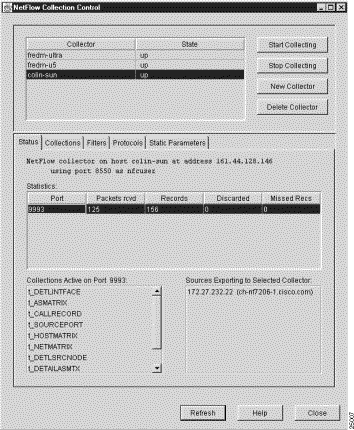
The rectangular area at the bottom of the NetFlow Collection Control window contains several tabs; you can select any one at any time to perform desired NetFlow collection control tasks for a selected FlowCollector. The panels associated with these tabs are described in the sections referenced below:
In addition, the bottom of the NetFlow Collection Control window contains the following selectable buttons:
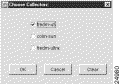
You can replicate the configuration and control parameters that you define for one FlowCollector into other FlowCollectors by means of the Choose Collectors window shown in Figure 3-59.
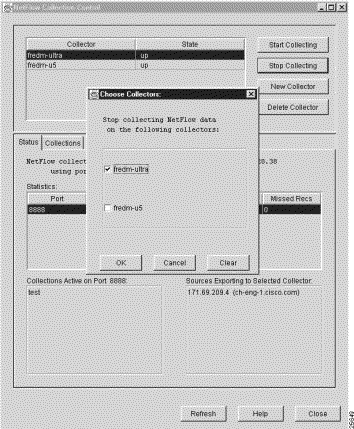
The Choose Collectors window appears automatically each time you attempt to perform an operation that can be logically applied to other FlowCollectors, such as when you
From Figure 3-59, note that
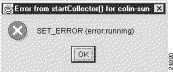
A typical Status panel in the NetFlow Collection Control window is shown in Figure 3-60.
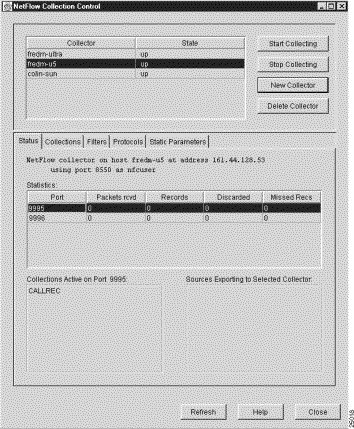
The Status panel presents information about active collections on the selected FlowCollector. The panel includes the following facilities:
|
Note Once you configure the selected FlowCollector to operate using the facilities provided by the NetFlow Collection Control windows, you ordinarily keep the Status panel selected until you need to use other panels to perform various FlowCollector configuration, control, and display tasks. |
The Collections panel lists the collections currently defined for the selected FlowCollector. As shown in Figure 3-61, this panel enables you to accomplish the following tasks:
Each time you change the configuration parameters for a selected FlowCollector, a command is sent to that FlowCollector to update its nfconfig.file, thus causing it to operate according to the new or changed configuration parameters.
One of the key parameters that you can set in this window is the collection filter. A filter can incorporate multiple permit and deny attributes (such as source addresses, interfaces, and so on), but all such attributes must be related to one filter name. You can apply a filter with multiple permit and deny attributes to multiple collections, but any given collection can have a maximum of one filter associated with it at any time.
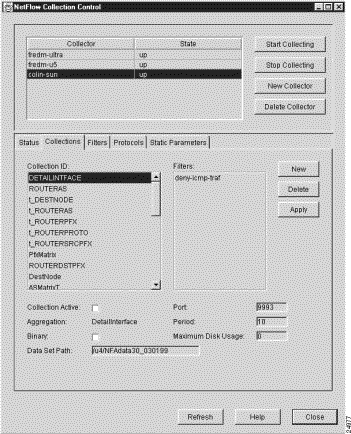
The Collections panel provides the following FlowCollector configuration facilities:
When you click the New button in the Collections panel, a New Collection panel (see Figure 3-62) appears in place of the Collections panel.
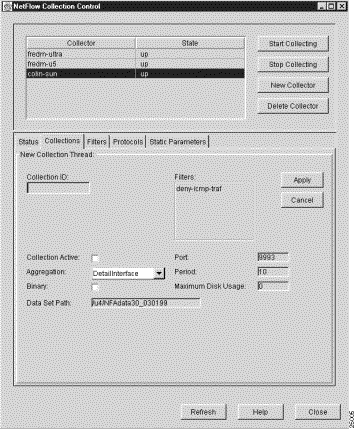
When you click New in the Collections panel, all of the parameters of the most recently selected Collections panel are propagated into the New Collections panel, giving you a basis for
In either case, the New Collections panel
When you specify a new collection for the selected FlowCollector, click OK to put the new collection into effect. Doing so sends configuration commands to the selected FlowCollector, updating its nfconfig.file and causing it to recognize the new collection process in aggregating NetFlow data.
If you decide to abandon the new collection definition process, click Cancel to return to the Collections panel.
The New Collection panel provides the following configuration facilities for defining new collections:
The New Collection panel also includes the following collection control facilities:
When you click the Filters tab of the NetFlow Collection Control window, the Filters panel appears (see Figure 3-63).
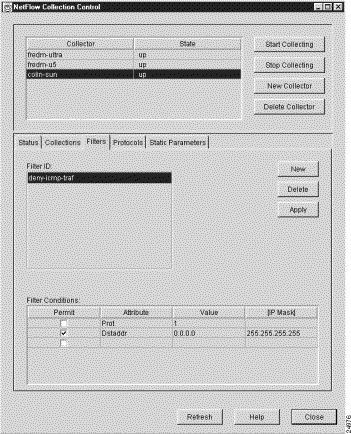
The Filters panel lists the filters currently defined for the selected FlowCollector and incorporates facilities that enable you to
When you create a new filter, modify an existing filter, or delete an existing filter, a command is sent to the selected FlowCollector, causing it to update its nfconfig.file and to operate accordingly.
|
Note You cannot modify a filter that is currently being used by a FlowCollector. You must remove the filter from any collections for which it is defined and then make desired modifications. |
The Filters panel provides the following filter display and definition facilities:
| Filter Attribute | Filter Value |
|---|---|
Srcaddr | The IP addresses, respectively, of the traffic source, the traffic destination, and the next hop device routing the traffic to the destination. Each IP address requires a network mask. |
Srcport | The assigned port number for the transport layer protocol (RFC 1700) at the traffic source and destination, respectively. The port number can range from 1 to 65535. |
Srcinterface | The numeric identifier of the physical interface at the source and destination, respectively. |
Prot | The protocol number in the flow record, as specified in the /etc/protocols file. The protocol number can range from 1 to 255. |
Protocol | The protocol name, as displayed in the Protocol pane of the Protocol panel (see Figure 3-66) and defined in the nfknown.protocols file. |
TOS | The type-of-service (ToS) byte (which includes IP precedence and Type of Service fields) provides a way to prioritize traffic. The value of the ToS byte can range from 0 to 255. |
SrcAS | The source and destination autonomous system (AS) numbers. |
When you click the New Filter button in the Filters panel, a New Filter panel (see Figure 3-64) appears in place of the existing Filters panel.
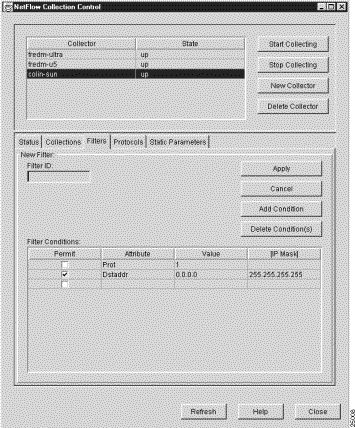
All of the parameters of the most recently selected Filters panel are propagated into the New Filter panel, giving you a basis for
In either case, the New Filter panel incorporates all of the filter definition facilities available to you through the Filters panel. In addition, the New Filter panel incorporates a Filter ID pane that enables you to define a unique name for the new filter.
When you create a new filter for the selected FlowCollector, a command is sent to the FlowCollector to update its nfconfig.file accordingly.
The New Filter panel provides the following new filter definition facilities:
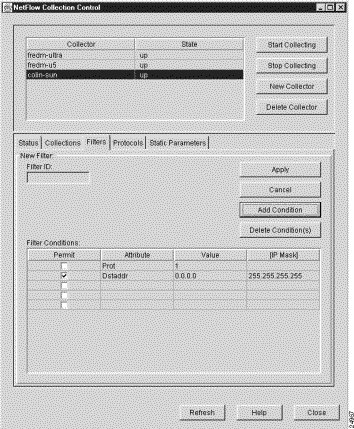
When you click the Protocols tab of the NetFlow Collection Control window, the Protocols panel appears (see Figure 3-66).
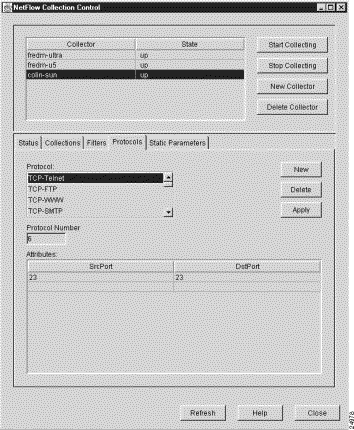
The Protocols panel lists the protocols currently defined for the selected FlowCollector, enabling you to
When you create a new protocol, modify an existing protocol, or delete an existing protocol, a command is sent to the selected FlowCollector to update its nfknown.protocols file with the current protocol definitions and port numbers.
The Protocols panel provides the following protocol display and definition facilities:
When you click the New button in the Protocols panel, a New Protocol pane (see Figure 3-67) appears in place of the existing Protocols panel.
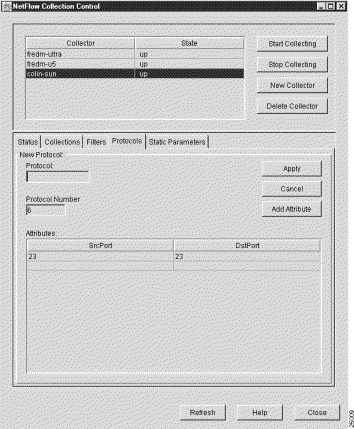
All of the parameters of the most recently selected Protocol panel are propagated into the New Protocols panel, giving you a basis for
In either case, the New Protocol panel incorporates all of the configuration facilities available to you by means of the Protocols panel. In addition, the New Protocol panel incorporates a Protocol pane through which you can define a unique name for the new protocol.
When you create a new protocol for the selected FlowCollector, a command is sent to the FlowCollector, causing it to update its nfknown.protocols file and to aggregate NetFlow data according to the new protocol.
The New Protocol panel provides the following new protocol definition facilities:
|
Note If two or more entries in the nfknown.protocols file have the same protocol number and port number, the first entry encountered in this file is assumed to be valid and is used for mapping the translated name of the protocol into the FlowCollector's stored NetFlow data files. Any duplicate entry in this file is ignored. |
When you click the Static Parameters tab of the NetFlow Collection Control window, the Static Parameters panel appears (see Figure 3-68).
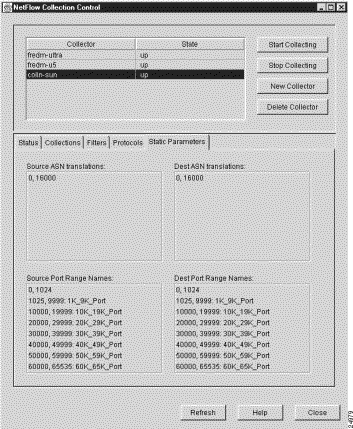
You cannot interact with the Static Parameters panel. It displays only static configuration information for the selected FlowCollector.
The Static Parameters panel has four panes, each of which shows the default text strings that are written into NetFlow data files in place of numeric information. These default settings are provided for your use in translating less readable numeric data into equivalent more readable text strings when NetFlow data files are stored by the selected FlowCollector.
A set of default static parameters and associated text strings is provided in the configuration files that are shipped with the FlowCollector, enabling you to take immediate advantage of this built-in translation capability.
Each of the four panes in the Static Parameters panel contains the following information:
The panes in the Static Parameters panel are described briefly below. If you wish to change any default setting, you must edit the appropriate FlowCollector configuration file, as identified below.
When you choose the Router Configuration option of the Tools menu, the Configuration Files Directory window (see Figure 3-69) prompts you to specify the name of a directory on a network device that contains configuration files for the routers and switches in your network.
The configuration file directory provides the names, interfaces, and passwords of network devices, enabling you to log on to any NetFlow or TMS export-capable device in the network and configure it by means of the Router Configuration window. There must be a configuration file in this directory for each NetFlow or TMS export-capable device that you intend to configure by means of the Router Configuration window.
Although you typically store router configuration files on a UtilityServer host, you can store them on any NFS-mounted volume in the network that is accessible to the UtilityServer. Thus, the directory path name that you enter in the Configuration Files Directory window can point to any UNIX directory on any host in the network that is reachable by the UtilityServer.
For example, assume that you have created a configuration file directory named "/tftpboot/configs/" on a UtilityServer operating on a UNIX platform. After you enter this directory path name (or any other directory path name that points to router configuration files), click OK.
You create router configuration files at installation time when you configure devices to operate in the network. Typically, you log on to a newly installed device and copy its running configuration file into a directory that you create on a UtilityServer host for storing router configuration files.
If the directory path name that you enter in the Configuration Files Directory window (see Figure 3-69) is valid and you are connecting to an IOS router, the Router Configuration window appears (see Figure 3-70) with the NetFlow panel selected by default. The Router drop-down selection box incorporated into this window enables you to select any NetFlow or TMS export-capable device of interest and to configure that device for data export.
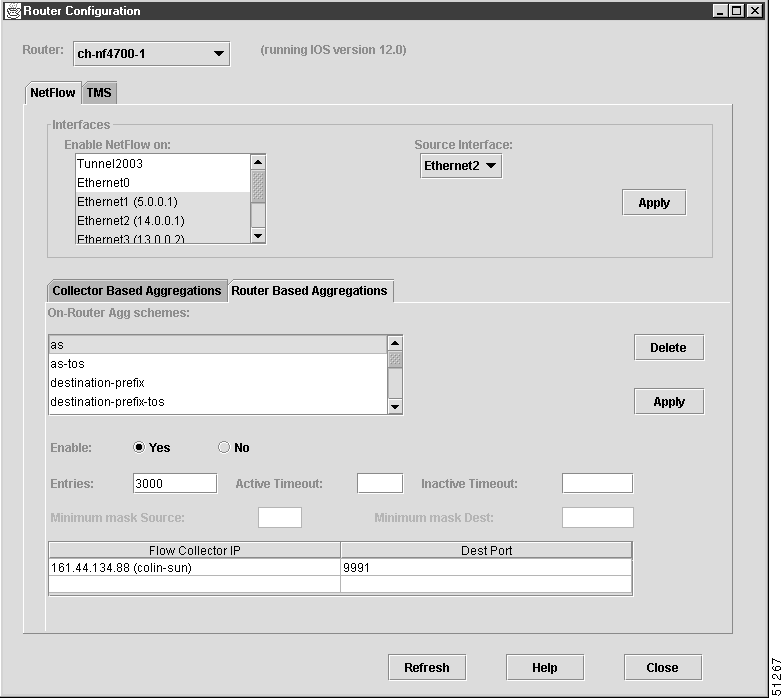
If the router requires that you enter a password when you log on, the screen shown in Figure 3-71 is displayed.
The following facilities are common to the NetFlow configuration panel and the TMS configuration panel of the Router Configuration window for collector-based and router-based aggregations:
After you enter a valid directory path name in the Configuration Files Directory window (see Figure 3-69), the Router Configuration window shown in Figure 3-72 appears with the NetFlow tab selected by default. The NetFlow configuration panel enables you to configure network devices to export NetFlow data.
The NetFlow configuration panel is partitioned into the following three functional areas:
The Collector Based Aggregations area and the Router Based Aggregations area of the Router Configuration window are functionally equivalent. The only difference is that each area enables you to control a specific type of NetFlow data collection and aggregation process.
The selection lists for configuring the interfaces on the selected router are described below.
The configuration parameters for the router interfaces apply to both collector based data aggregations and router based data aggregations.
Figure 3-73 illustrates the Collector Based Aggregations panel.
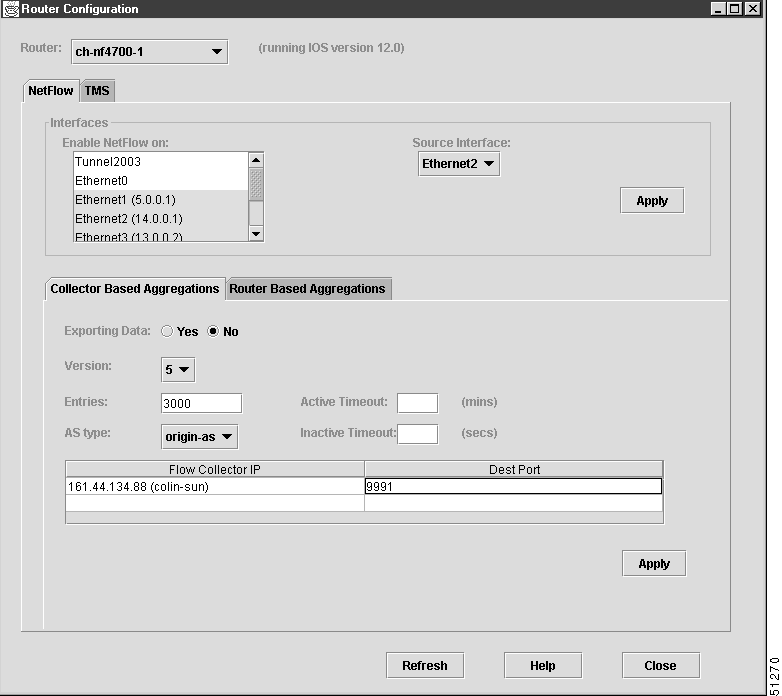
The data fields and buttons for controlling collector based aggregations (Version 1 or Version 5 export records) for a selected router are described below.
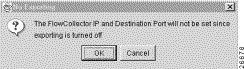
|
Note You must click Apply in the Collector Based Aggregations panel of the Router Configuration window to put into effect the changes that you made to collector based configuration parameters described above. |
|
Note If the router being configured supports redundant NetFlow, you can specify multiple FlowCollector IP addresses and destination ports (in the Dest Port column) in order to set up redundant NetFlow collection. |
Figure 3-74 illustrates the Router Based Aggregations panel.
The data fields and buttons are described below.
|
Note You must click Apply in the Router Based Aggregations panel of the Router Configuration window to put into effect the changes that you made to router-based configuration parameters described above. |
|
Note If the router being configured supports redundant NetFlow, you can specify multiple FlowCollector IP addresses and destination ports (in the Dest Port column) in order to set up redundant NetFlow collection. |
When you select the TMS tab in the Router Configuration window, the TMS Router Configuration panel shown in Figure 3-75 appears. This panel enables you to configure network devices to export TMS data.
The following facilities displayed in conjunction with the TMS Router Configuration panel perform the same functions as those described in the "Elements Common to NetFlow and TMS Configuration Panels" section:
The functional elements unique to the TMS Router Configuration panel include the following:
If you are using a Catalyst 6000 router, the Router Configuration window shown in Figure 3-76 is displayed with the multilayer switching feature card (MSFC) NetFlow panel selected by default.
Refer to the entire section "Facilities of the NetFlow Configuration Panel" for information on configuring the MSFC for NetFlow.
If you select the PFC Netflow panel to configure NetFlow on the Policy Feature Card of the Catalyst 6000 router, the screen shown in Figure 3-77 is displayed.
The fields are described below.
If the directory path name that you specify in the Configuration Files Directory window
(see Figure 3-69) is invalid or does not exist, the Analyzer displays the following Router Config Files window:
Click OK to return to the main Display module window.
You can then start over by choosing the Router Configuration option of the Tools menu. When the Configuration Files Directory dialog window again appears, you can correctly specify the path name of the desired configuration files directory, or you can specify the name of a different directory that contains requisite router configuration files.
Alternatively, you can open a UNIX window and, by means of CLI commands, copy the router configuration files from their known current directory into the directory that you defined by means of the Configuration Files Directory dialog window.
In any case, you must have access to a directory that contains valid router configuration files before you can open and use the Router Configuration window. This window can display information only for network devices for which valid configuration files exist.
When the Router Configuration window appears, you can select any NetFlow or TMS data exporting device listed in the window's Router drop-down list and view and/or change any of its associated configuration parameters.
The UtilityServer checks all the configuration files stored in the router configuration file directory, ignoring any invalid files. A valid configuration file must contain the host name and an enable password. After the UtilityServer validates the router name, the user's login password, and the enable password for each router, it passes the router name and its associated configuration parameters to the Display module. The name of the router is then added to the Router drop-down list, and, if selected, the data fields of the Router Configuration window are updated accordingly. If the router was configured with an "enable secret" password, the logon for the Router pop-up dialogue box will appear, prompting you for the login and enable passwords.
If for some reason a connection cannot be made to a device that you select in the Router drop-down list, the following No Connection message window appears:
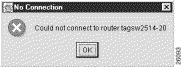
In this case, click OK to close the window. You can then attempt to connect to any other router listed in the Router drop-down list of the Router Configuration window, or you can retry the connection by clicking the Refresh button.
If you are unable to configure a particular field for your selected router using the router configuration tool, it may be because your router does not support this feature.
The Display module Hints menu provides a Get Hints option. When you select this option, the Typical Hints popup window shown in Figure 3-78 appears. You can access this window at any time for assistance in performing the common Analyzer tasks listed in the window.
The Analyzer Display module Help menu provides the selectable options described in the following sections.
Select the About Network Data Analyzer option of the Tools menu to invoke Netscape Navigator. The resulting window, shown in Figure 3-79, lists the platforms on which the Analyzer is supported and tells you how to obtain assistance.
Select the How to Use the Network Data Analyzer option of the Help menu to invoke Netscape Navigator. The resulting window (see Figure 3-80) lists typical and optional Analyzer tasks that you can select for information about how to perform the selected task.
Select the Tables and Aggregation Schemes option of the Help menu to invoke Netscape Navigator, which displays the window shown in Figure 3-81. The table in this window lists the aggregation schemes available for use with the Analyzer.
You can select any entry in this table for additional information about the characteristics, uses, and parameters of the selected aggregation scheme.
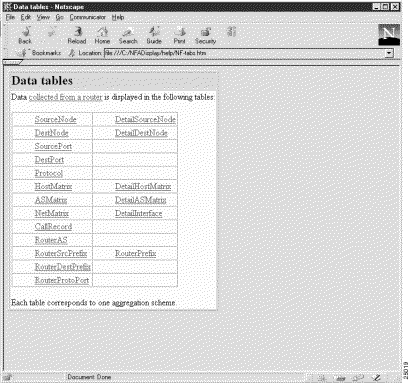
Select the Getting Support option of the Help menu to invoke Netscape Navigator, which displays the window shown in Figure 3-82. This window lists the platforms on which the Analyzer runs and the resources that you can call upon for assistance in using the Analyzer.
![]()
![]()
![]()
![]()
![]()
![]()
![]()
![]()
Posted: Wed Aug 29 15:55:33 PDT 2001
All contents are Copyright © 1992--2001 Cisco Systems, Inc. All rights reserved.
Important Notices and Privacy Statement.