|
|

Table Of Contents
Monitoring
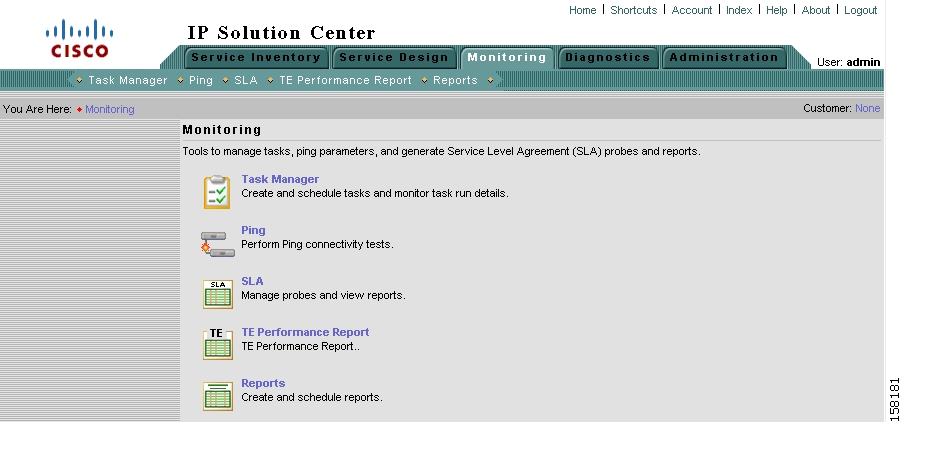
From the Home window of Cisco IP Solution Center (ISC), which you receive upon logging in, click the Monitoring tab and you receive a window as shown in Figure 7-1, " Monitoring Selections."
Figure 7-1 Monitoring Selections
Next you can choose the following selections:
•
Task Manager Create and schedule tasks and monitor task run details.
•
•
•
•
Task Manager
ISC provides a Task Manager that allows you to view pertinent information about both current and expired tasks of all types, and to create and schedule new tasks, delete specified tasks, and delete the active and expired tasks.
This section contains the following subsections:
•
Tasks
This section contains the following topics:
•
•
•
•
•
Starting Task Manager
To start Task Manager, follow this step:
Step 1
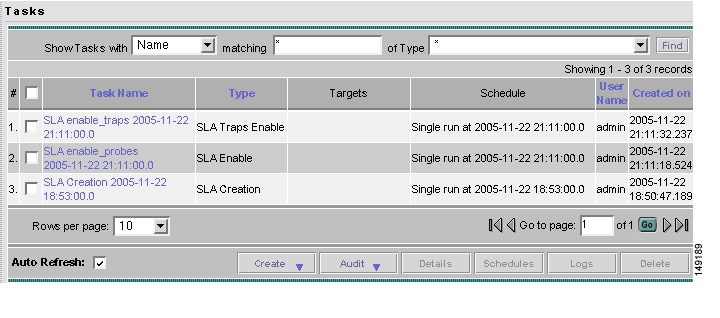
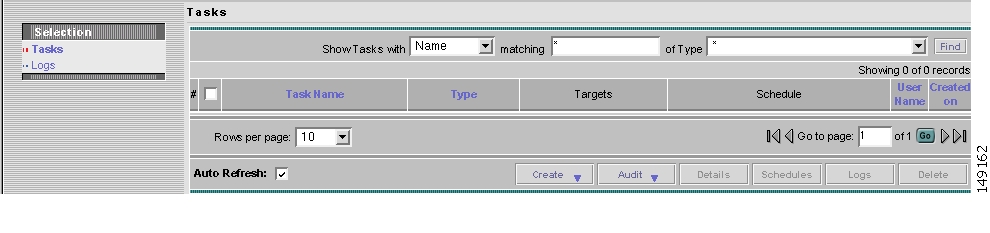
Figure 7-2 Tasks
The Tasks window displays information about each task by Task Name, Type, Targets, Schedules date and time, the User Name who created those tasks, and the date Created on. To view, schedule, or delete the listed tasks, check the corresponding check box.
New Tasks can also be created or audited using this window.
Create
To create a new task, follow these steps:
Step 1
•
•
•
•
•
•
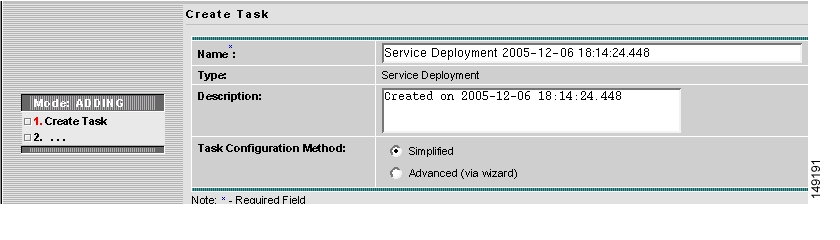
Figure 7-3 Create Tasks
Step 2
Step 3
Step 4
Step 5
Step 6
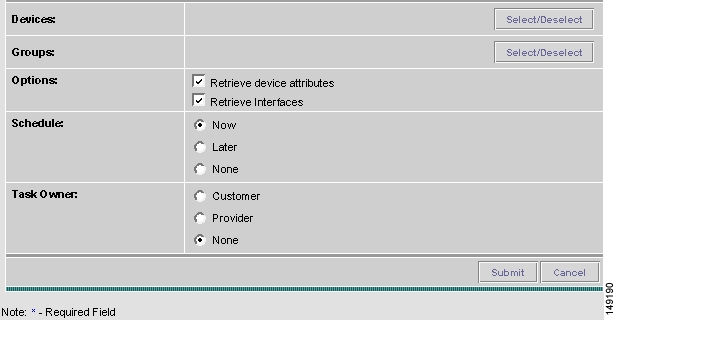
Figure 7-4 Task Devices
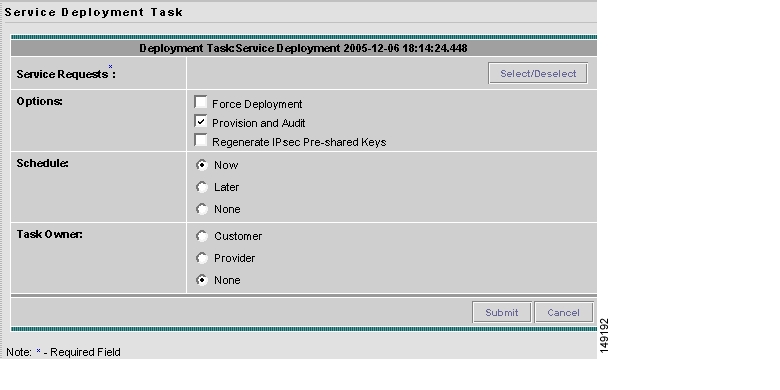
Figure 7-5 Service Deployment Task
Step 7
Step 8
Step 9
Step 10
Step 11
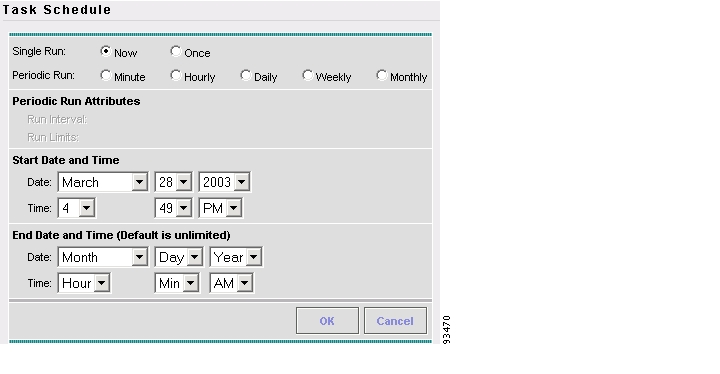
Figure 7-6 Task Schedule Details
Step 12
Step 13
Audit
To get audit information, follow these steps:
Step 1
•
•
•
•
Details
To get details about a particular task, follow these steps:
Step 1
Step 2
Step 3
Schedules
To change the scheduling of an existing task, follow these steps:
Step 1
Step 2
Step 3
Step 4
Step 5
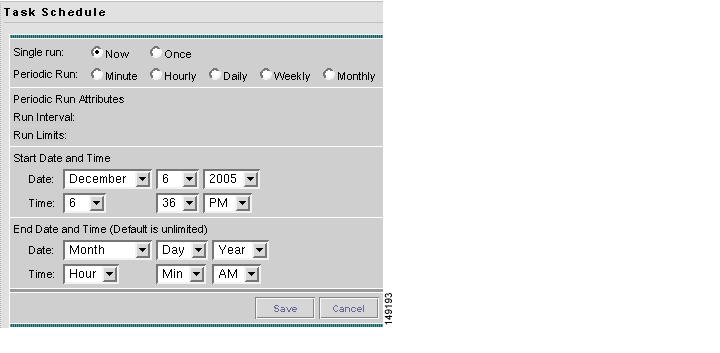
Figure 7-7 Task Scheduling
Step 6
Step 7
Logs
This selection from the Tasks page, as shown in Figure 7-2, " Tasks," is another way of doing what is explained in the "Task Logs" section.
Delete
To delete one or more tasks, follow these steps:
Step 1
Step 2
Step 3
Task Logs
Task Logs can be used to understand the status of a task, whether it completed successfully. You can also use the Task Logs to troubleshoot why a task has failed. To view the Task Logs, follow these steps:
Step 1
Figure 7-8 Tasks
Step 2
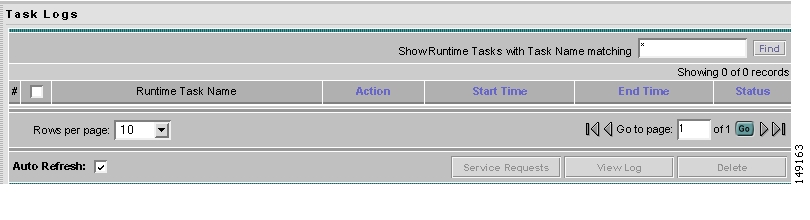
Figure 7-9 Task Logs
This window displays the task by Runtime Task Name, and the Action, Start Time, End Time, and the Status of the task. You can use this window to view or delete the logs.
Step 3
Step 4
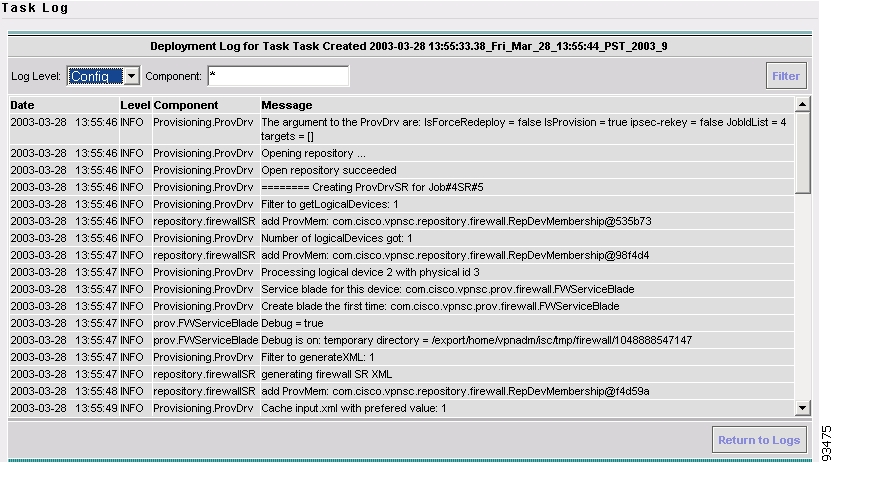
Figure 7-10 Task Log
It is possible to set the types of log level you want to view. Specify the Log Level and click on the Filter button to view that information you want to view.
Step 5
Ping
Ping is the way ISC monitors the VPN connectivity, that is, verifies the connectivity among various edge devices comprising the VPN.
Note
To achieve this, you can perform a series of pings among these devices. Ping has the following benefits:
•
•
•
However, Ping does not do the following:
•
•
•
The Ping GUI supports all possible pings for MPLS service requests. This section explains how to ping MPLS service requests.
Note
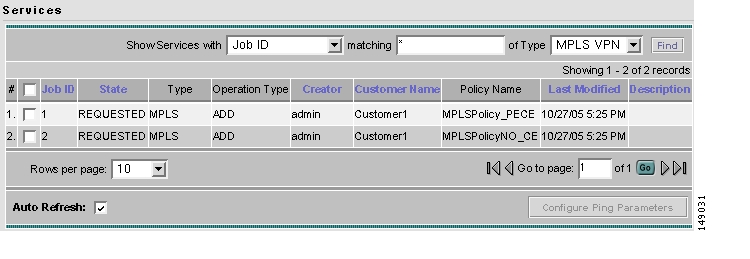
After you choose Monitoring > Ping, you receive a window as shown in Figure 7-11, " Services."
Figure 7-11 Services
The Type field indicates MPLS. Follow these steps:
Step 1
Step 2
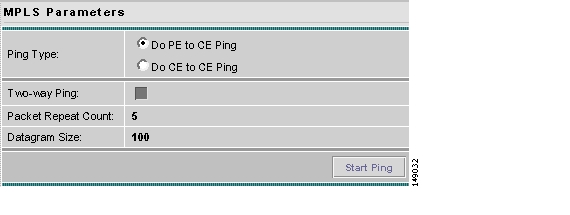
Figure 7-12 MPLS Parameters
Fill in the following and then click Start Ping:
•
•
•
•
•
Step 3
Figure 7-13 MPLS CE Selection
Step 4
Step 5
Step 6
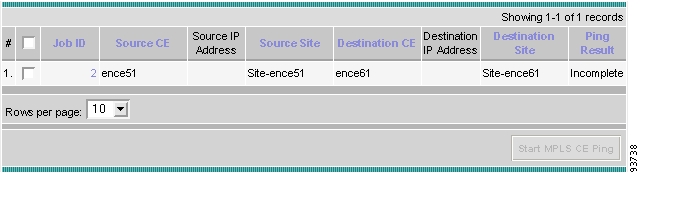
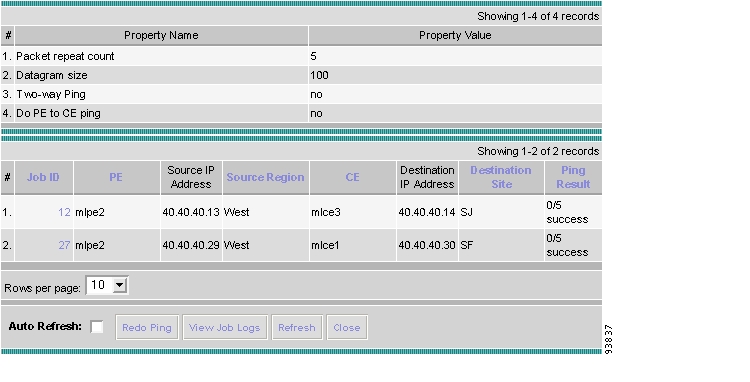
Figure 7-14 MPLS Ping Test Results
Step 7
•
•
•
•
Note
Step 8
SLA
A service-level agreement (SLA) defines a level of service provided by a service provider to any customer. Performance is monitored through the SLA server. ISC monitors the service-related performance criteria by provisioning, collecting, and monitoring SLAs on Cisco IOS routers that support the Service Assurance Agent (SA Agent) devices. To provision the SLAs and to collect statistics for each SLA, the data collection task requires minimal user input.
Note
The SLA collection task collects the relevant performance data, stores it persistently, aggregates it, and presents useful reports. The SLA collection task collects from the SA Agent MIB on devices. ISC leverages the SA Agent MIB to monitor SLA performance on a 24 x 7 basis. Using the MIB, you can monitor network traffic for the popular protocols:
•
•
•
•
•
•
•
•
Note
Note
This section explains how to configure SLA probes, collect SLA data, and view SLA reports about these SLA probes.
Before you choose Monitoring > SLA, implement the setup procedures in the "Setup Prior to Using SLA" section."
Then choose Monitoring > SLA and you can select one of the following:
•
•
Setup Prior to Using SLA
SLA is an SNMP activity. Be sure SNMP is enabled and the SNMP settings on the router match the settings in the repository.
When creating an SLA From MPLS CPE or From MPLS PE or MVRF-CE, the service requests associated with the devices must be in the Deployed state.
Probes
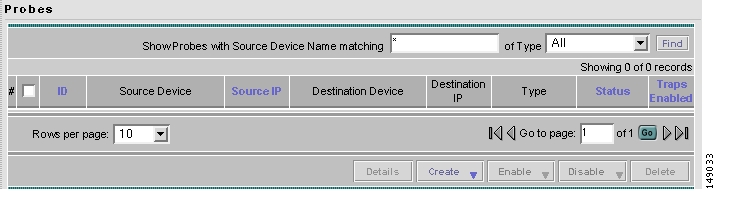
When you choose Monitoring > SLA > Probes, you receive a window as shown in Figure 7-15, " SLA Probes."
Figure 7-15 SLA Probes
The default button that is enabled is Create and from the Create drop-down list, you can choose to create SLA probes From Any SA Agent Device(s); From MPLS CPE; or From MPLS PE or MVRF-CE. However, if you select one or more existing probes by clicking the row(s) of existing probe(s), then you have access to the other buttons, Details, Delete, Enable, and Disable. For Enable and Disable, the drop-down list contains options to enable or disable SLA Probes and SLA Traps.
The explanations of the buttons and subsequent drop-down lists is given as follows:
•
•
•
•
•
•
•
•
•
•
•
Create Common Parameters
When you choose Monitoring > SLA > Probes, the default is the Probes page with only the Create button enabled, as shown in Figure 7-15. From the Create drop-down list, you can choose From Any SA Agent Device(s), From MPLS CPE, or From MPLS PE or MVRF-CE. The first window to appear in all ways of creation is specified here. Then you proceed to the specific creation type you have chosen.
Follow these steps:
Step 1
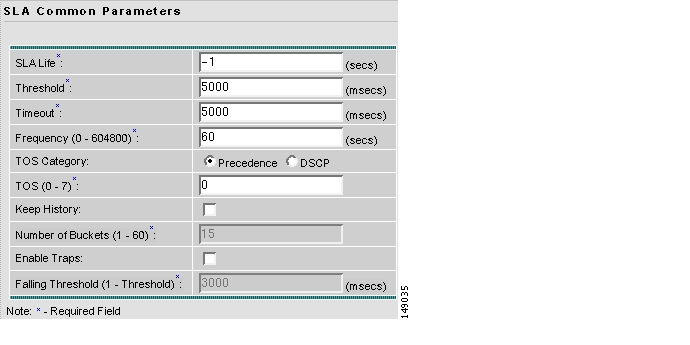
Figure 7-16 SLA Common Parameters
Accept the defaults or change the information in the fields of the common SLA parameters, as follows, and then click Next:
•
•
•
•
•
•
–
Note
–
Note
•
•
•
•
Step 2
Create From Any SA Agent Device(s)
After you have completed the steps in Create Common Parameters, follow these steps:
Note
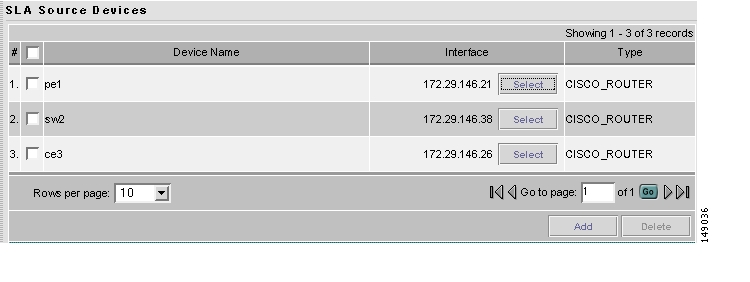
Step 1
Figure 7-17 SLA Source Devices
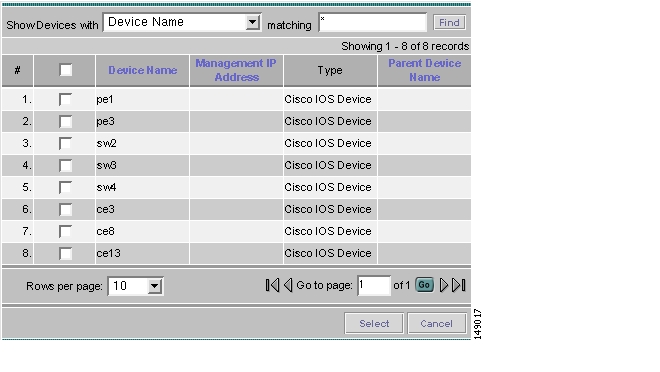
Step 2
Figure 7-18 SLA Devices > Add
Step 3
•
•
•
Step 4
Note
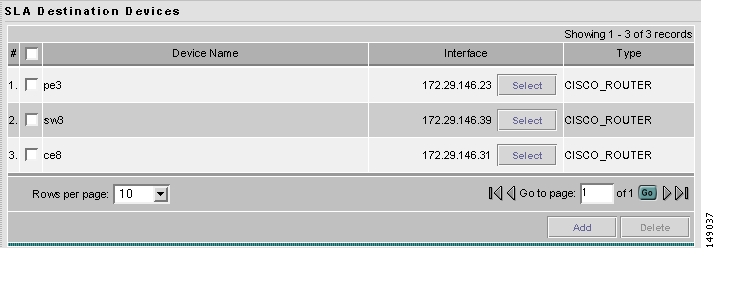
Step 5
Figure 7-19 SLA Destination Devices
Step 6
Step 7
•
•
•
Step 8
Note
Step 9
Create from MPLS CPE
After you have completed the steps in Create Common Parameters, follow these steps:
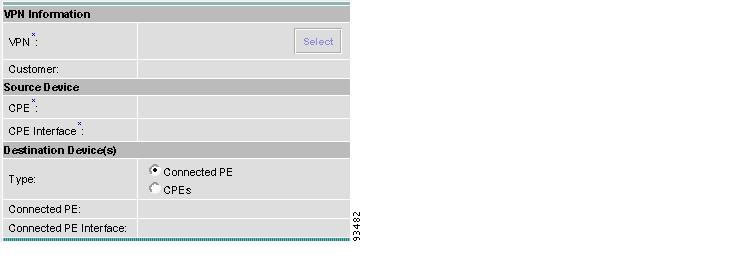
Step 1
Figure 7-20 SLA CPE Parameters
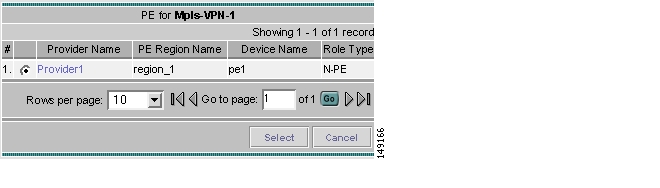
Step 2
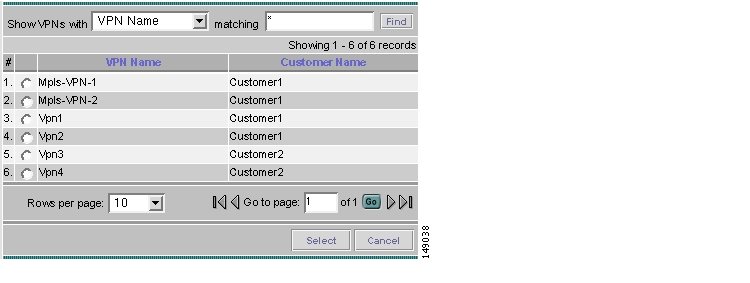
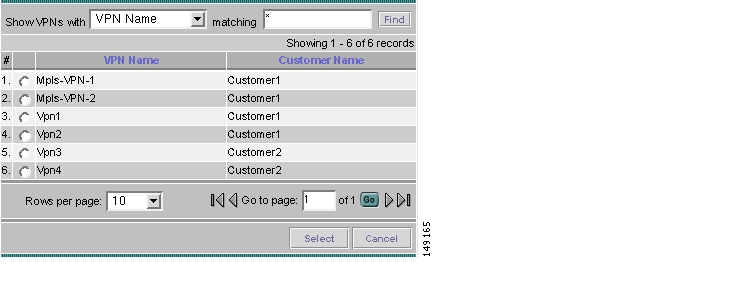
Figure 7-21 Select VPN
Click the radio button for the VPN you want to select. Then click Select.
Step 3
Step 4
Figure 7-22 Select CPE
Step 5
Step 6
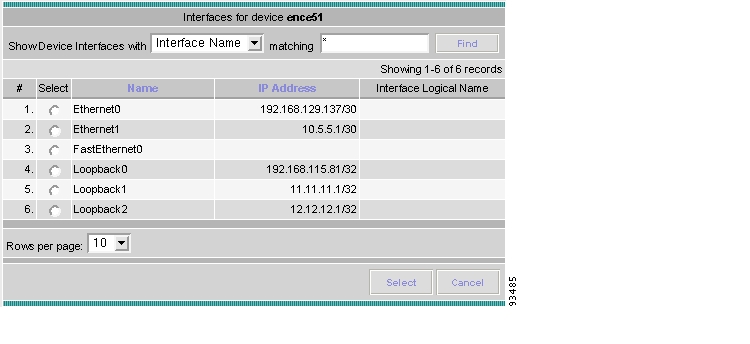
Figure 7-23 Interfaces
Click the radio button next to the row for the interface you want to select. Then click Select.
Step 7
Step 8
Step 9
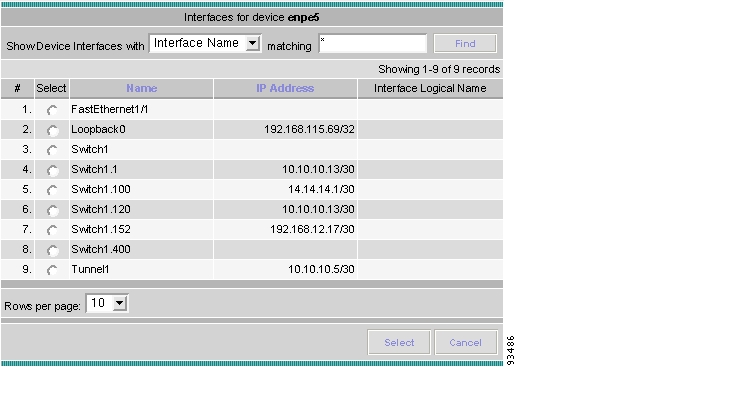
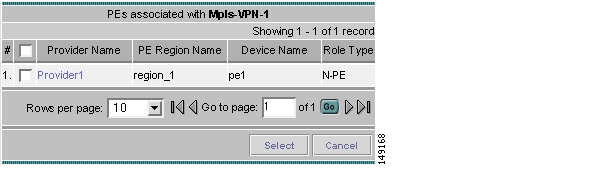
Figure 7-24 Connected PE Interface
Click the radio button next to the row for the interface you want to select. Then click Select.
Step 10
Step 11
Step 12
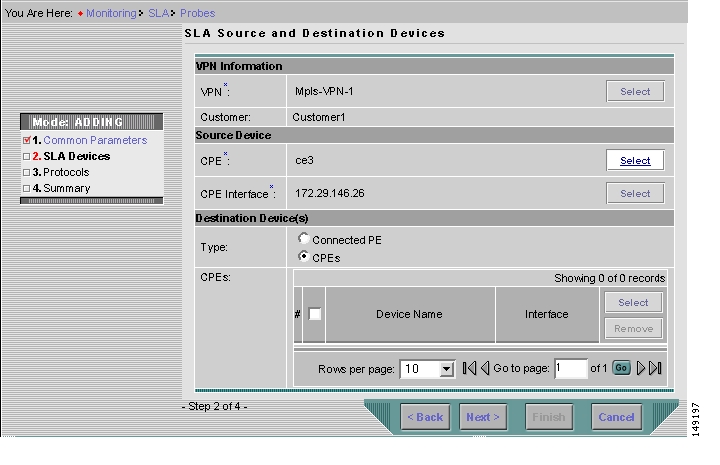
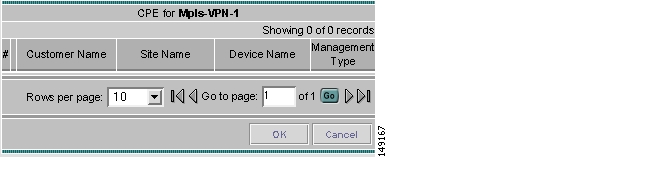
Figure 7-25 CPEs
Step 13
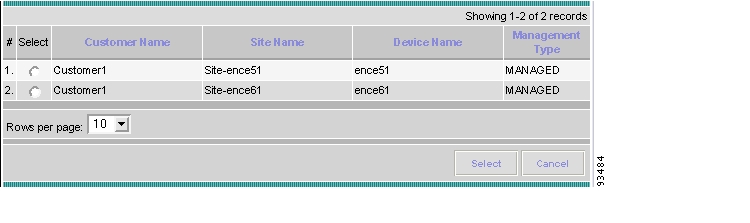
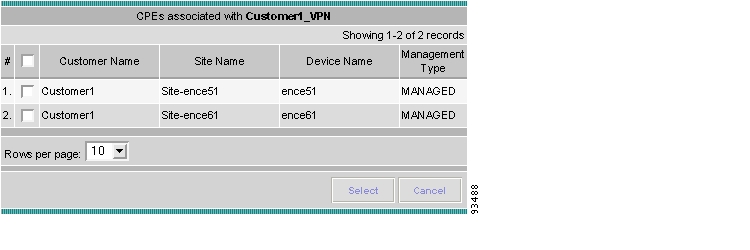
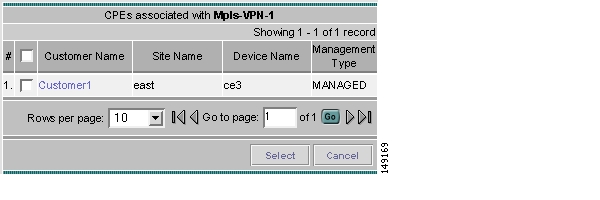
Figure 7-26 Select CPE Associated with the Specified VPN
Check the check box next to the row(s) for the CPE(s) you want to select. Then click Select.
Note
Step 14
Step 15
Click the radio button next to the row for the CPE you want to select. Then click Select.
Step 16
Step 17
Step 18
Create From MPLS PE or MVRF-CE
After you have completed the steps in Create Common Parameters, follow these steps:
Step 1
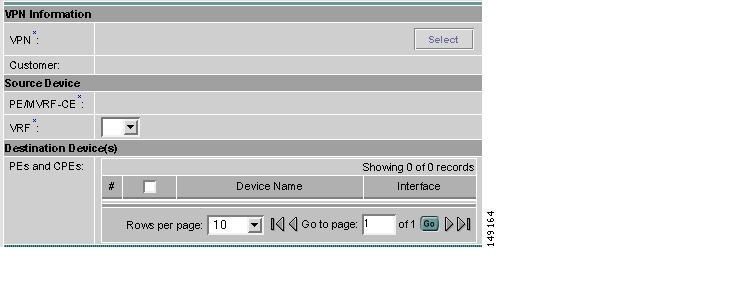
Figure 7-27 SLA Source and Destination Devices
Step 2
Figure 7-28 Select VPN
Step 3
Step 4
Figure 7-29 Select PE
Figure 7-30 Select CPE
Step 5
Step 6
Step 7
Note
Figure 7-31 Select PEs
Figure 7-32 Select CPEs
Step 8
Step 9
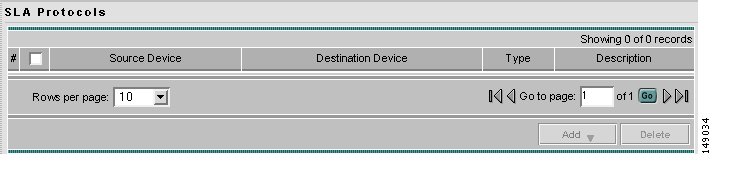
Protocols
You choose this location after you have completed all the steps in one of the Create functions: Create Common Parameters; Create from MPLS CPE; or Create From MPLS PE or MVRF-CE. Follow these steps:
Step 1
Figure 7-33 Protocols
Step 2
•
•
•
•
•
•
•
•
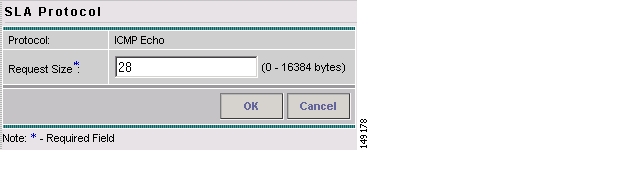
Step 3
Figure 7-34 Protocol ICMP Echo
Enter the required information as follows, click OK, and then proceed to Step 11.
•
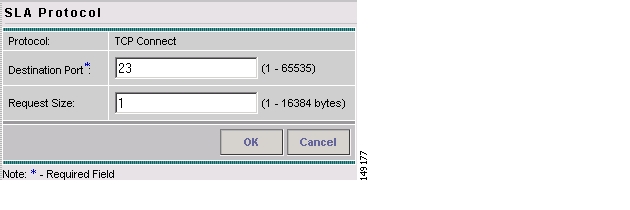
Step 4
Figure 7-35 Protocol TCP Connect
Enter the required and optional information as follows, click OK, and then proceed to Step 11.
•
•
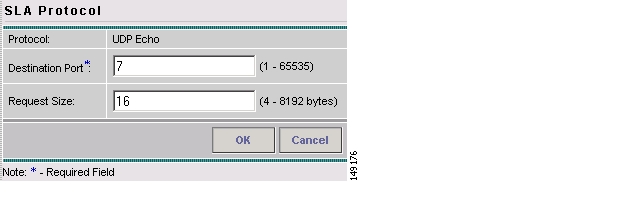
Step 5
Figure 7-36 Protocol UDP Echo
Enter the required and optional information as follows, click OK, and then proceed to Step 11.
•
•
Step 6
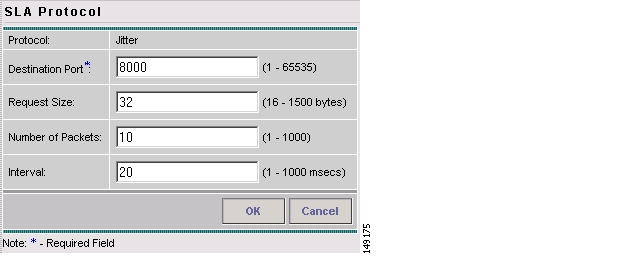
Figure 7-37 Protocol Jitter
Enter the required and optional information as follows, click OK, and then proceed to Step 11.
•
•
•
•
Step 7
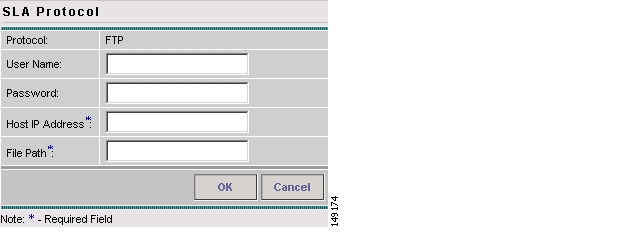
Figure 7-38 Protocol FTP
Enter the required and optional information as follows, click OK, and then proceed to Step 11.
•
•
•
•
Step 8
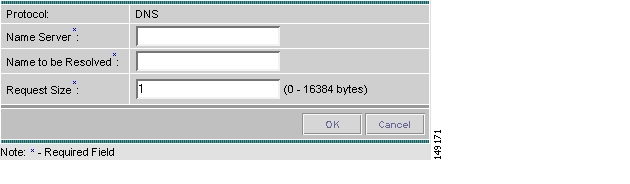
Figure 7-39 Protocol DNS
Enter the required information as follows, click OK, and then proceed to Step 11.
•
•
•
Step 9
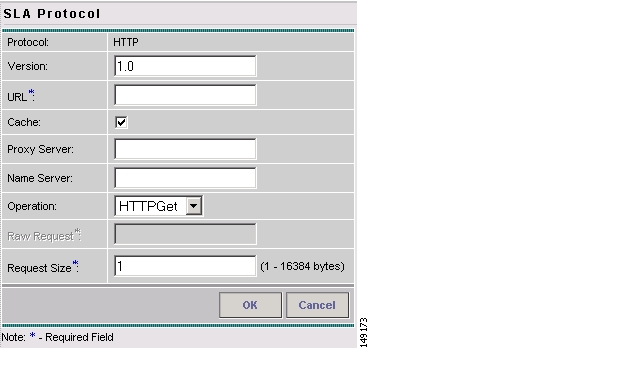
Figure 7-40 Protocol HTTP
Enter the optional and required information as follows, click OK, and then proceed to Step 11.
•
•
•
•
•
•
•
•
Step 10
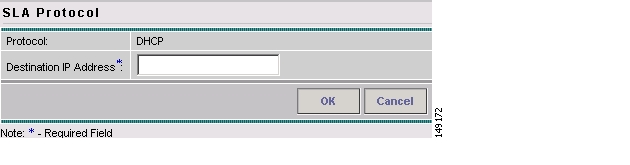
Figure 7-41 Protocol DHCP
Enter the required information as follows, click OK, and then proceed to Step 11.
•
Step 11
Note
Step 12
Details
When you choose Monitoring > SLA > Probes, you can get details by following these steps:
Step 1
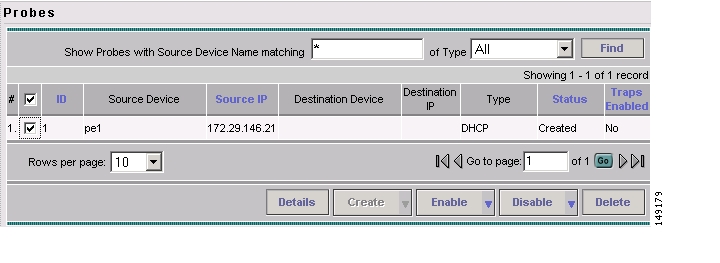
Figure 7-42 SLA Probes > Details
Step 2
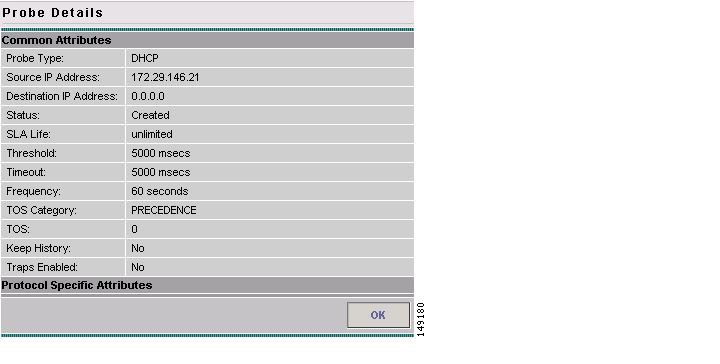
Figure 7-43 SLA Probes Details
Step 3
Delete
When you choose Monitoring > SLA > Probes, you can delete probes from the list by following these steps:
Step 1
Figure 7-44 SLA Probes > Delete
Step 2
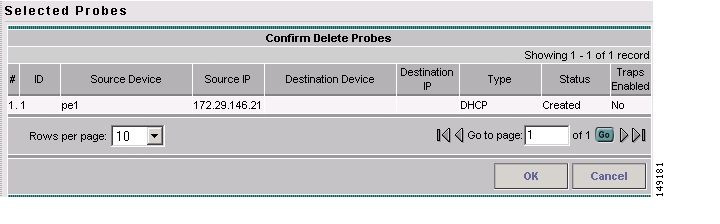
Figure 7-45 Confirm Delete Probes
Step 3
Note
Step 4
Enable Probes
When you choose Monitoring > SLA > Probes, you can enable probes by following these steps:
Step 1
Figure 7-46 SLA Probes > Enable > Probes
Step 2
Figure 7-47 Confirm Enable Probes
Step 3
Step 4
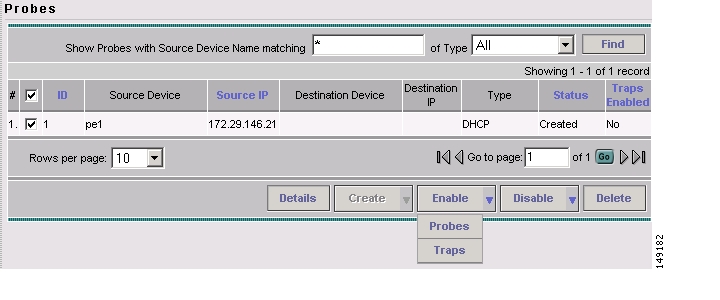
Enable Traps
When you choose Monitoring > SLA > Probes, you can enable traps by following these steps:
Step 1
Figure 7-48 SLA Probes > Enable > Traps
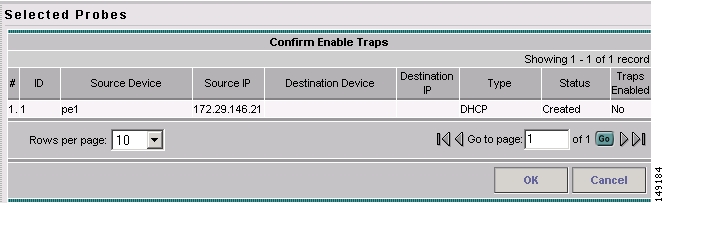
Step 2
Figure 7-49 Confirm Enable Traps
Step 3
Step 4
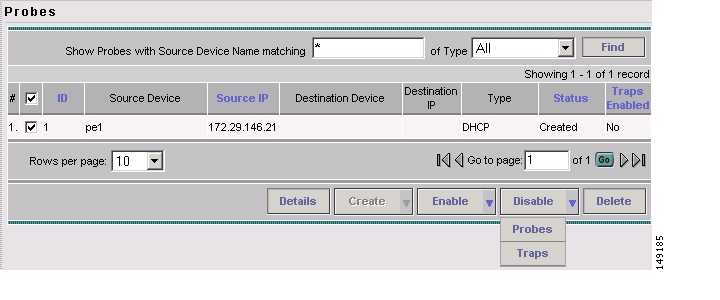
Disable Probes
When you choose Monitoring > SLA > Probes, you can use Disable Probes to delete probes on the devices. Follow these steps:
Step 1
Figure 7-50 SLA Probes > Disable > Probes
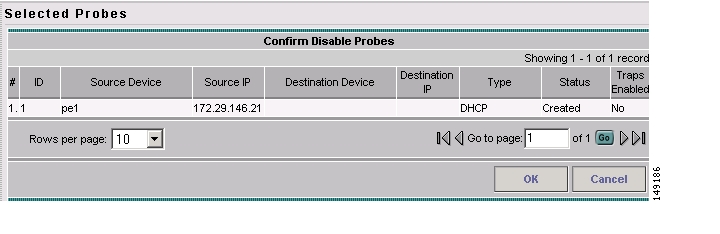
Step 2
Figure 7-51 Confirm Disable Probes
Step 3
Step 4
Disable Traps
When you choose Monitoring > SLA > Probes, you can disable traps by following these steps:
Step 1
Figure 7-52 SLA Probes > Disable > Traps
Step 2
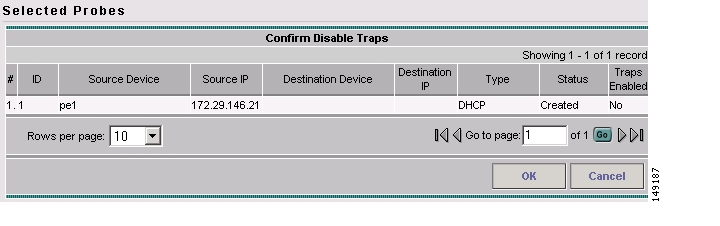
Figure 7-53 Confirm Disable Traps
Step 3
Step 4
Reports
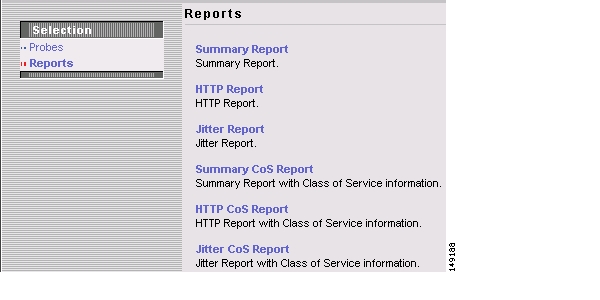
When you choose Monitoring > SLA > Reports, you receive a window as shown in Figure 7-54, " SLA Reports."
Figure 7-54 SLA Reports
You can then click on any of the following choices and receive that report
•
•
•
•
•
•
Summary Report
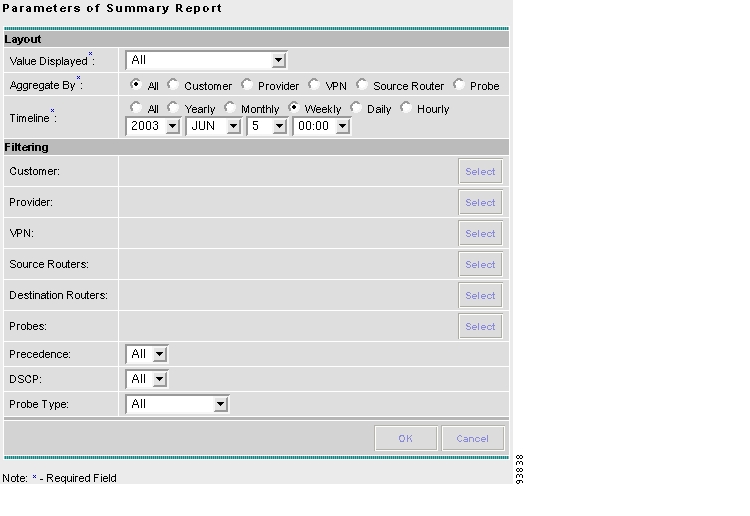
From Figure 7-54, choose Summary Report and follow these steps:
Step 1
Figure 7-55 Parameters of Summary Report
Step 2
•
–
–
–
–
–
–
–
–
•
•
Step 3
Note
•
•
•
•
•
•
•
Note
Note
•
Note
•
Note
Step 4
Step 5
Note
HTTP Report
From Figure 7-54, choose HTTP Report and proceed similarly to the "Summary Report" section, with the following exceptions:
•
•
•
Jitter Report
From Figure 7-54, choose Jitter Report and proceed similarly to the "Summary Report" section, with the following exceptions:
•
•
•
Summary CoS Report
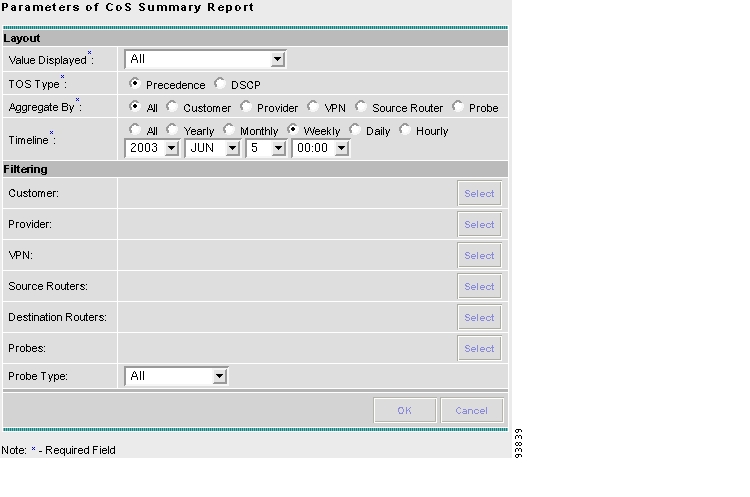
From Figure 7-54, choose Summary CoS Report for a summary of the Class of Service (CoS) reports, which are based on the TOS values of the SLA probes, and follow these steps:
Step 1
Figure 7-56 Parameters of CoS Summary Report
Step 2
Step 3
Step 4
Step 5
Note
HTTP CoS Report
From Figure 7-54, choose HTTP Report and proceed exactly as in the "Summary CoS Report" section, with the following exceptions:
•
•
•
Jitter CoS Report
From Figure 7-54, choose Jitter Report and proceed exactly as in the "Summary CoS Report" section, with he following exceptions:
•
•
•
TE Performance Report
TE Performance Report for Traffic Engineering Management is explained in detail in the Cisco IP Solution Center Traffic Engineering Management User Guide, 5.0.
Reports
When you choose Monitoring > Reports, a tree of reports appears in the data pane. Click on the + sign for each folder in the data pane and you receive a listing of all the provided reports. The non-SAMPLE reports in the L2VPN folder are explained in the Cisco MPLS Diagnostics Expert 2.1 Failure Scenarios Guide on ISC 5.0 and the non-SAMPLE reports in the MPLS folder are explained in the Cisco IP Solution Center MPLS VPN User Guide, 5.0.1.
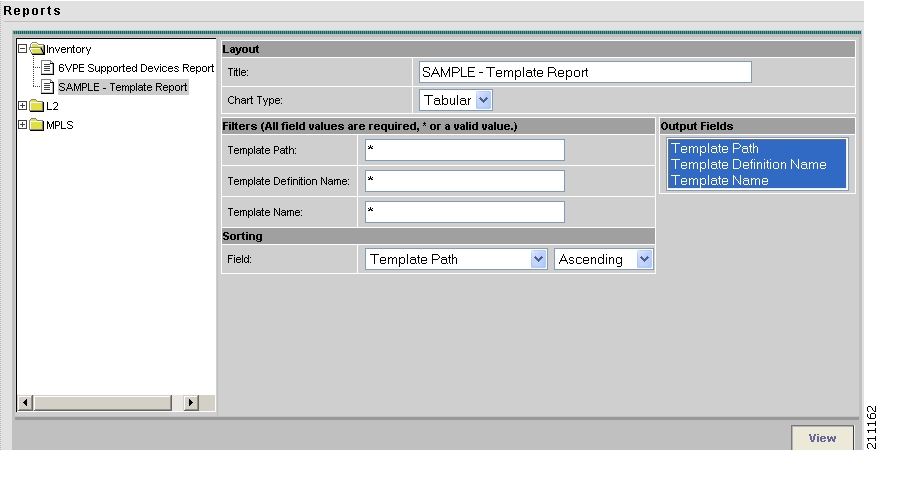
Click on any of the specific reports and you can define how to set up the report. Figure 7-57, " Inventory > SAMPLE - Template Report - Report Window," shows the sample file under the folder Inventory.
Figure 7-57 Inventory > SAMPLE - Template Report - Report Window
This section explains the Reports feature and how to use it in the following areas:
•
Introducing Reports
Network operators often want to have detailed reports on the services provisioned. For example, for a given customer, you might want to see a list of the PE-CE connections and their detailed PE-CE configuration parameters or you might want to see specific Layer2 or Layer3 service requests on a PE. These reports help network operators by providing a centralized location for finding Service Requests (SRs) and VPN information.
When you choose Monitoring > Reports, reports are grouped by type to allow for easy navigation. ISC displays only predefined (canned) reports for which the user has RBAC permission.
You can select the filtering criteria and the outputs to be displayed in the report. You can save reports to a variety of formats.
In addition to the predefined reports that are documented in the Cisco IP Solution Center Metro Ethernet and L2VPN User Guide, 5.0 and the Cisco IP Solution Center MPLS VPN User Guide, 5.0.1, ISC provides additional sample reports. Sample reports are provided for informational purposes only and are untested and unsupported.
The data structures that ISC uses to provide reports in the GUI are defined in an XML format.
Accessing Reports
To access the reports, follow these steps:
Step 1
Step 2
The Reports window appears, as shown in Figure 7-57.
Step 3
Note
Using Reports GUI
This section provides some general comments on using the reports GUI. This information applies to all reports. When you invoke a report, you see a window like the one shown in Figure 7-57.
The window is divided into several areas:
•
•
•
Layout
This area displays the title of the report and allows you to select the chart type. You can enter your own report title by overwriting the Title field.
Note
Filters
In this pane you can define inputs or search criteria for the reports. Values entered here are compared against corresponding values associated with data objects in the ISC repository. Values must be entered for all fields. An asterisk (*) can be used as a wild-card character for an entire string.
For each filterable field, the GUI displays a label and a text input field. For certain fields, the GUI also displays a Select button that allows you to choose an existing object (for example, customer, Service Type, SR State, and so on). All available output fields are displayed in the window, allowing you to select the fields to include in the report. All output fields are selected by default.
Note
Output Fields
In this pane you can choose output fields to be displayed in the report. You can choose any or all of the output fields by selecting them with the mouse. Use the Shift key to select a continuous range of output values. Or, use the Control key to select random output values.
Sorting
This pane allows you to select how you want to sort the report output. For Field:, use the first drop-down list to select each filter field and then the second drop-down list to choose whether to display the report fields in ascending or descending order. The sort order can also be changed after you have the report output displayed (see Figure 7-58).
Running Reports
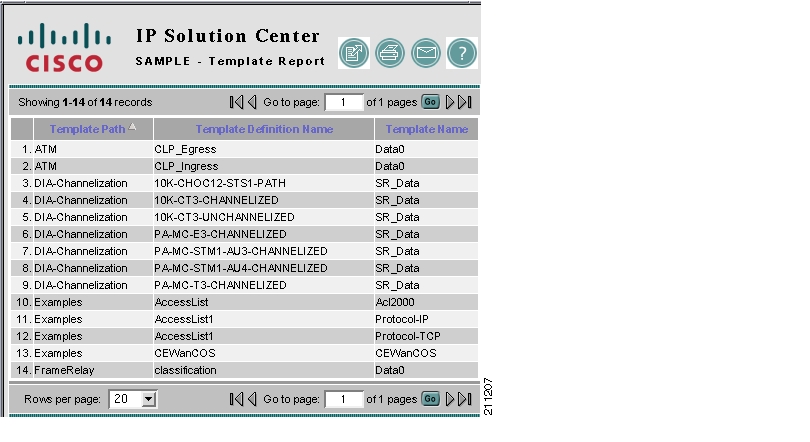
To run the report, click View in the lower right corner of the report window. This generates the report output. An example of a report output is shown in Figure 7-58.
Figure 7-58 Report Output
The reports GUI supports output in tabular format. The output is listed in columns, which are derived form the outputs you selected in the reports window.
Each row (or record) represents one match of the search criteria you set using the filter fields in the reports window.
In some cases, the value returned in a field can be displayed as one of the following:
•
•
•
The column heading with a triangle icon is the output by which the records are sorted. By clicking on any column heading, you can toggle between ascending and descending sort order. To sort on another output value, click on the heading for that value.
For information on working with report output, see the "Using the Output from Reports" section.
Using the Output from Reports
The icons at the upper right of the report output window (see Figure 7-59) provide the following functions, respectively, moving from left to right:
•
•
•
•
Figure 7-59 Report Output Icons
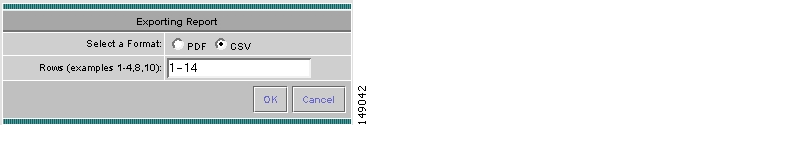
Exporting Reports
Click on the Export icon in Figure 7-59, " Report Output Icons," to bring up a window like the one shown in Figure 7-60 and then follow these steps.
Figure 7-60 Exporting Report Window
Step 1
•
•
Step 2
ISC generates the report in the format you selected.
Note
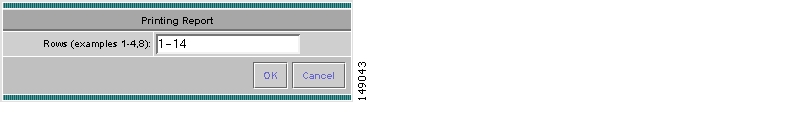
Printing Reports
Click on the Print icon in Figure 7-59, " Report Output Icons," to bring up a window like the one shown in Figure 7-61.
Figure 7-61 Print Report
This window allows you to display the report in a form more appropriate for printing. Select the desired rows, then click OK. The results are displayed in your web browser, from which you can print the report.
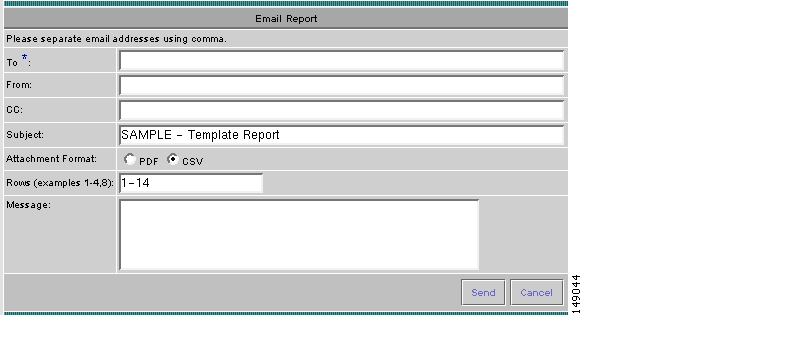
E-mailing Reports
Click on the E-mail icon in Figure 7-59, " Report Output Icons," to bring up a window like the one shown in Figure 7-62 and then follow these steps.
Figure 7-62 E-mail Report
Step 1
Step 2
This allows a reply message to be sent to a valid e-mail address.
Step 3
Step 4
You can overwrite this field to rename the report. This is what appears in the Subject field of the e-mail message.
Step 5
Step 6
Step 7
Invoking Help
Click on the Help (?) icon in Figure 7-59, " Report Output Icons," to link to the ISC documentation set on the Cisco Systems web site:
http://www.cisco.com/en/US/products/sw/netmgtsw/ps4748/
tsd_products_support_series_home.htmlFrom that location, you can choose the type of ISC document you want to see.
Creating Custom Reports
The reports listed in the ISC GUI in the each folder are derived from an underlying configuration file. The file is in XML format. You can access the file in the following location:
$ISC_HOME/resources/nbi/reports/ISC/<folder_name>_report.xml
where <folder_name> is Inventory, L2, or MPLS.
Each of the available reports (including sample reports) is defined by XML content contained within an <objectDef name> start and end tag under packageDef name = "<folder_name>". The intervening XML content specifies the title of the report, all allowable filter parameters, outputs, and the default sorting behavior. You can modify existing reports or copy them to use as templates for new reports.
To do this, follow these steps:
Step 1
Step 2
Note
Step 3
Step 4
Step 5
After restarting ISC, the modifications take effect, based on changes you made to the $ISC_HOME/resources/nbi/reports/ISC/<folder_name>_report.xml file.
![]()
![]()
![]()
![]()
![]()
![]()
![]()
![]()
Posted: Mon Feb 18 15:40:05 PST 2008
All contents are Copyright © 1992--2008 Cisco Systems, Inc. All rights reserved.
Important Notices and Privacy Statement.