|
|

Table Of Contents
Mobile Wireless Fault Mediator Release 2.2.1 Graphical User Interface User Guide
Using the MWFM Fault Monitor Console
Viewing Detailed Information About an Alert
Viewing Detailed Information About an Event
Using the MWFM Device Alerts/Events Console
Using the MWFM Administration Console
Adding Networks or Devices for Discovery
Using the MWFM HeartBeat Console
Viewing CiscoWorks2000-Related Messages
Resolving Error Messages and Conditions
Obtaining Technical Assistance
Mobile Wireless Fault Mediator Release 2.2.1 Graphical User Interface User Guide
The Cisco Mobile Wireless Fault Mediator (MWFM) Release 2.2.1 provides alarm filtering and correlation for the Gateway GPRS Support Node (GGSN) routers or Packet Data Serving Node (PDSN) routers in CDMA2000 networks and their neighboring Catalyst switches. MWFM is an event processing and correlation engine. It uses the topology model of the network to correlate a stream of network events (generated as a result of polling) according to the location of the device in the network and the class of the device on which the event occurred. Based on the correlation process, MWFM can upgrade more severe events to alerts.
This document describes how to use the CiscoWorks2000 desktop MWFM graphical user interface (GUI) to monitor events and alerts processed by the MWFM.
Note
This document is to be used in conjunction the MWFM documentation listed in the "Related Documentation" section.
This document contains the following information:
•
•
•
•
•
What is the MWFM GUI?
The MWFM GUI enables you to use the CiscoWorks2000 desktop interface to view information about alerts and events processed by the MWFM server. The CiscoWorks2000 desktop is a GUI that runs in a web browser. For more information about the CiscoWorks2000 desktop, see Getting Started with the CiscoWorks2000 Server.
Prerequisites
In addition to the requirements listed in the Read Me First—Mobile Wireless Fault Mediator Release 2.2.1 document, you need the following:
•
•
Related Documentation
Use this document in conjunction with the following CiscoWorks2000 for Mobile Wireless and CiscoWorks2000 documents:
•
•
•
•
•
•
•
•
The CiscoWorks2000 for Mobile Wireless documentation library is available online at:
http://www.cisco.com/univercd/cc/td/doc/product/rtrmgmt/cw2k4mw/index.htm
The CiscoWorks2000 documentation library is online at:
http://www.cisco.com/univercd/cc/td/doc/product/rtrmgmt/cw2000/index.htm
Before Getting Started
Before you can access the MWFM GUI, the following tasks must be completed:
Accessing the MWFM GUI
Note
To access the MWFM GUI, do the following:
Step 1
http://server-name:1741
where server_name is the name of the CiscoWorks2000 Server and 1741 is the default TCP port.
CD One uses port 1741 for the CiscoWorks2000 server. Make sure that you append :1741 to the end of your server name or IP address when accessing the server through your browser.
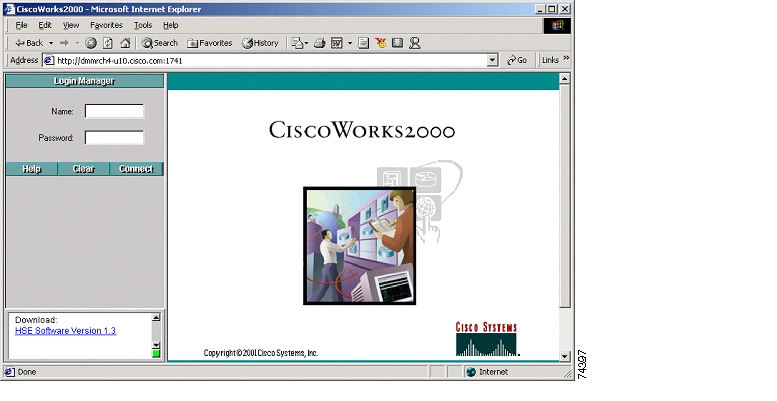
In the main CiscoWorks2000 desktop, the Login Manager appears.
Step 2
Figure 1 Initial Login
Step 3
Step 4
Using the MWFM Fault Monitor Console
This section contains the following information about using the MWFM Fault Monitor Console:
•
•
Viewing Network Alerts
Note
You can view a list of alerts that have been processed by MWFM from the Alerts Console window. An alert is a correlated event that has been deemed significant enough to warrant the attention of a network administrator.
The alerts displayed in the Alerts Console window are color-coded based on their severity, where:
•
•
•
•
•
Note
To view a list of alerts via the Alerts Console window, do the following:
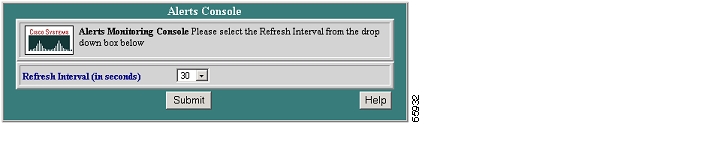
Step 1
Figure 2 Alerts Console Refresh Interval Window
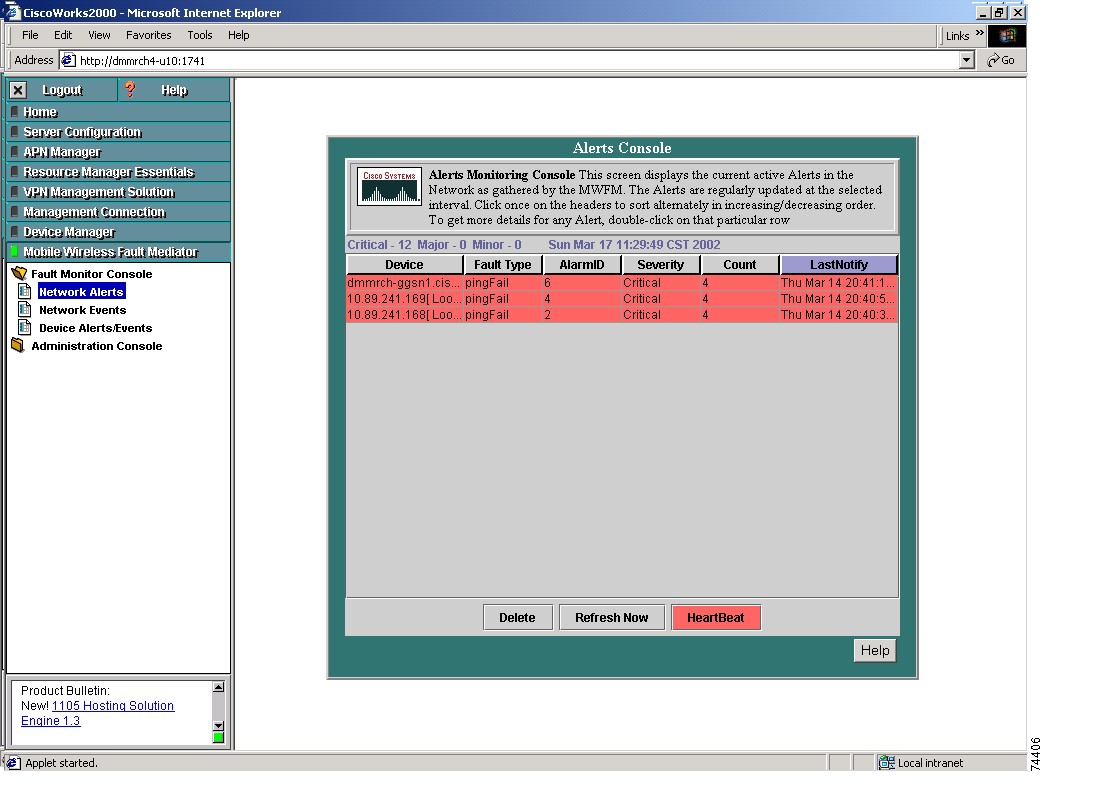
Step 2
Figure 3 Alerts Console Window
The Alerts Console window contains the following fields:
Step 3
Step 4
Viewing Detailed Information About an Alert
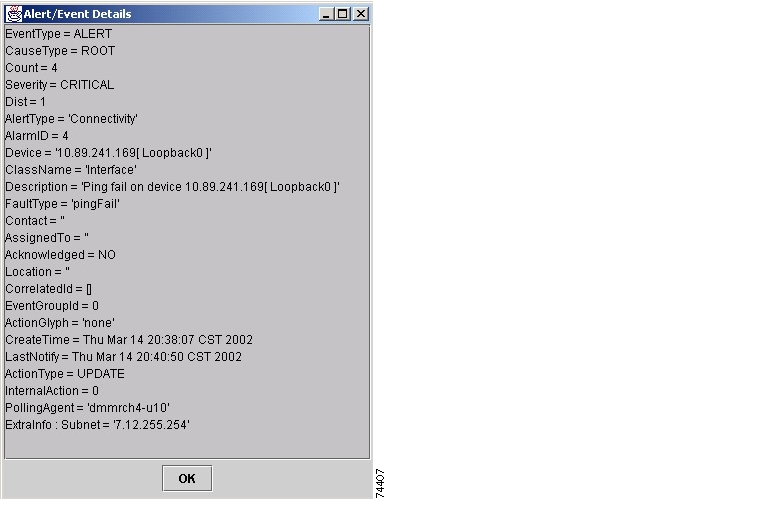
To view detailed information about an alert, open the Alerts Console window ( Figure 3), then double-click on the line of the alert, or right-click the line and select Details from the popup menu. A popup window containing the details of the alert is displayed ( Figure 4).
Figure 4 Alert Detail Popup
The Alert Detail popup contains information similar to the following. This information might vary depending on the type of alert.
Deleting an Alert
Any alert can be deleted by an operator with security privilege of Network Operator (NO) or higher.
To delete an alert, open the Alerts Console window ( Figure 3), then select the line of the alert and click Delete Alert, or right-click the line and select Delete from the popup menu. MWFM asks you to confirm the deletion. When you confirm, the selected alert is deleted from the database and the Alerts screen is refreshed.
Note
Viewing Network Events
Note
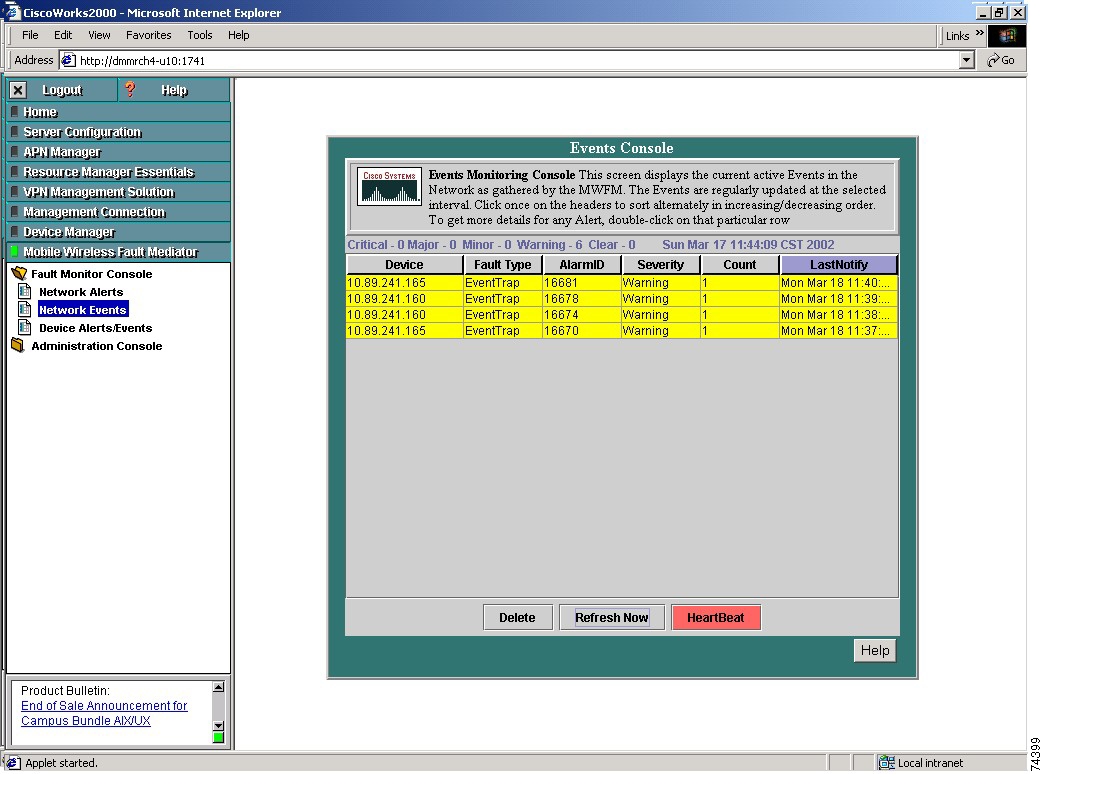
You can view a list of events occurring in the network from the Events Console window. The events displayed are primary events generated by MWFM active monitoring and devices present in the network. Active monitoring-related events are typically those events generated by polling agents such as Ping Polling Agent and the Simple Network Management Protocol (SNMP) Polling Agent. Device-generated events are typically SNMP notifications and syslog messages.
These events are gathered by the MWFM server and are correlated with topology information by the event correlation engine. The event correlation engine can then promote these events to alerts, depending on the event correlation methods employed.
The events displayed in the Events Console window are color-coded based on their severity, where:
•
•
•
•
•
Note
To view a list of events from the Events Console window, do the following:
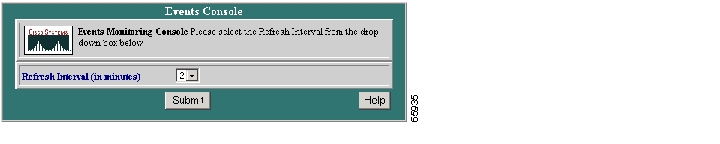
Step 1
Figure 5 Events Console Refresh Interval Window
Step 2
Figure 6 Events Console Window
The Events Console window contains the following fields:
Step 3
Step 4
Viewing Detailed Information About an Event
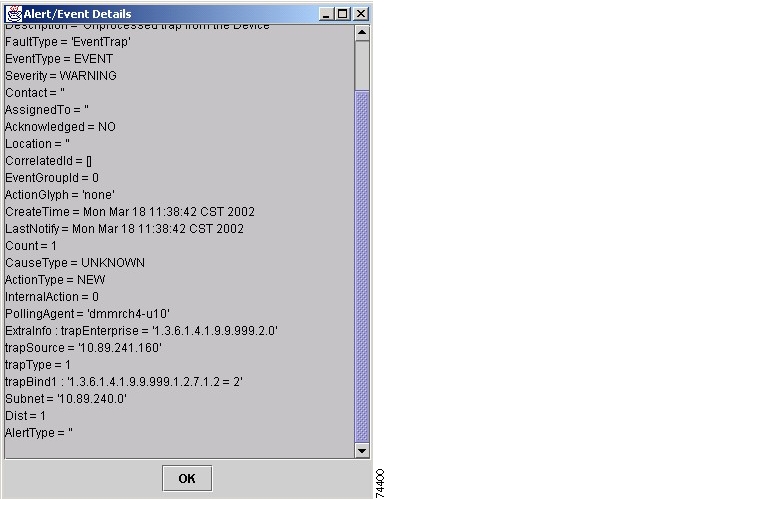
To view detailed information about an event, open the Events Console window ( Figure 6), then double-click on the line of the event, or right-click the line and select Details from the popup menu. A popup window containing the details of the event is displayed ( Figure 7).
Figure 7 Event Detail Popup
The Event Detail popup contains information similar to the following. This information might vary depending on the type of event.
Deleting an Event
Any event can be deleted by an operator with security privilege of Network Operator (NO), Network Administrator (NA), or System Administrator (SA).
To delete an event, open the Events Console window ( Figure 6), then select the line of the event and click Delete Alert, or right-click the line and select Delete from the popup menu. MWFM asks you to confirm the deletion. When you confirm, the selected event is deleted from the database and the Events screen is refreshed.
Note
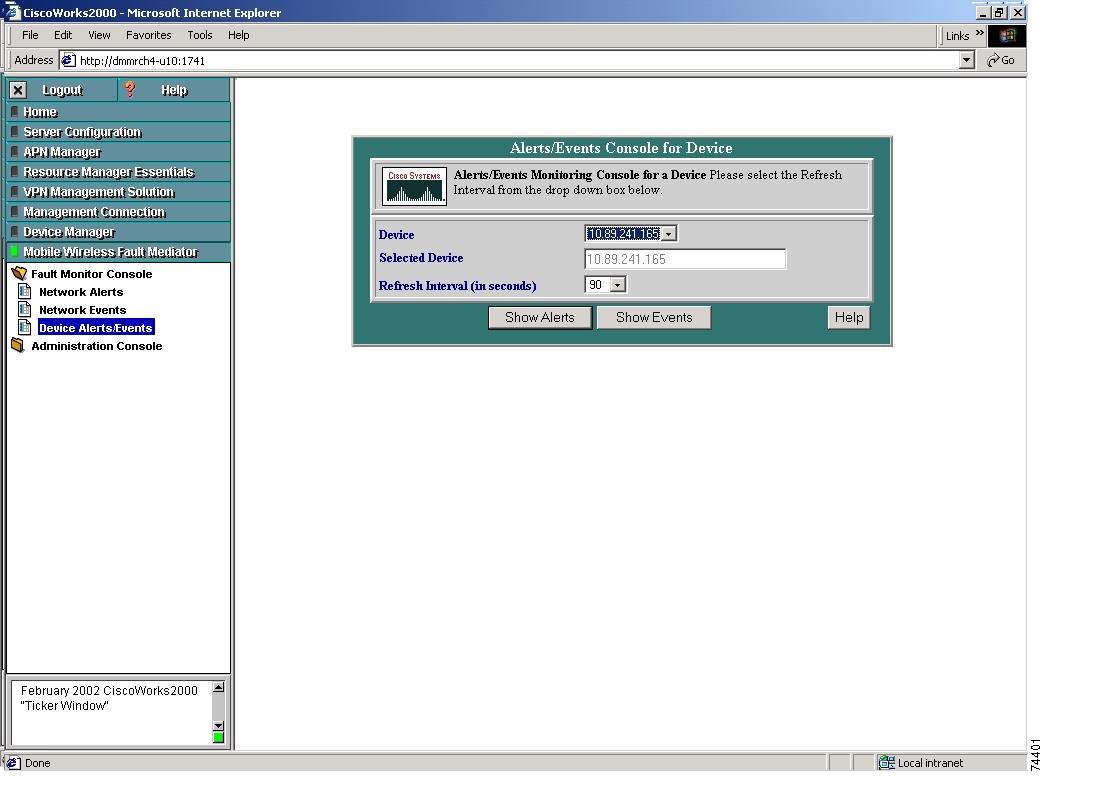
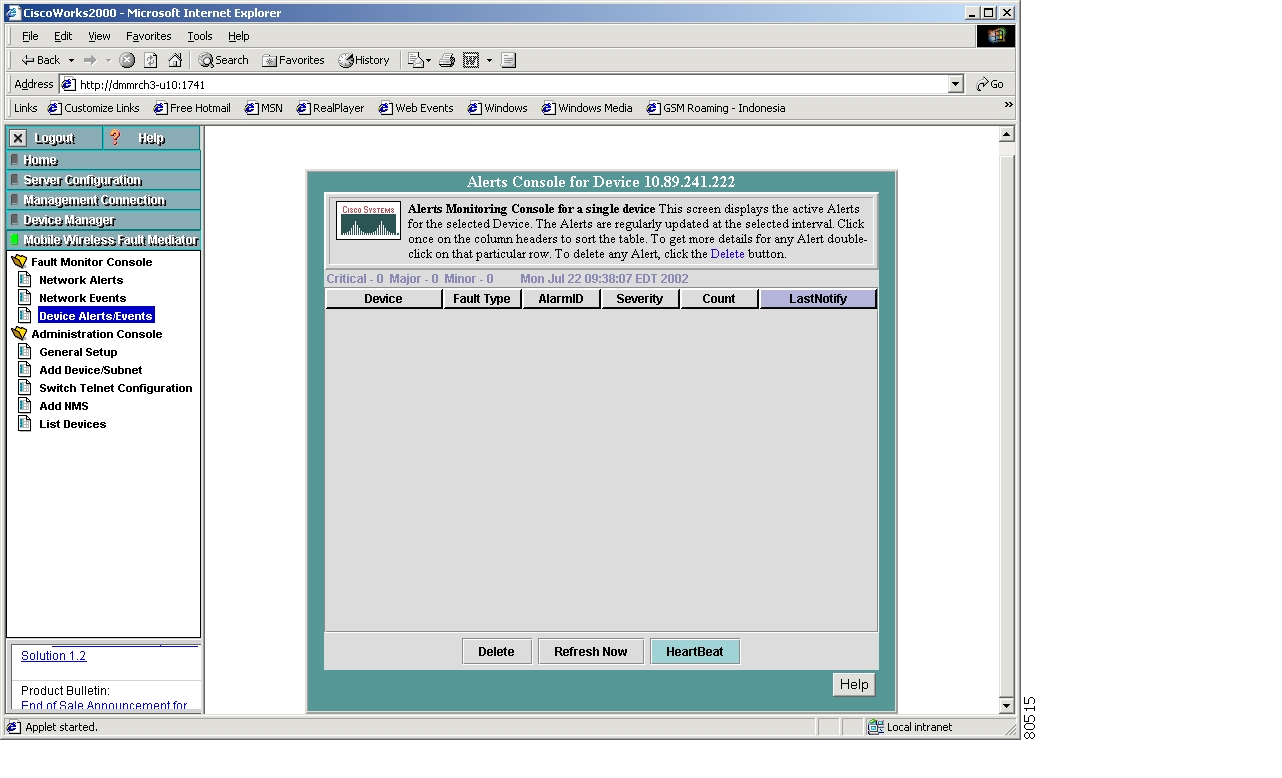
Using the MWFM Device Alerts/Events Console
To use the Device Alerts/Events console, use the following procedure:
Step 1
Figure 8 Alerts/Events Console for Device Window
The Alerts/Events Console for Device window contains the following fields:
Step 2
Figure 9 Alarms Console for Device Window
The Alarms Console for Device window contains the following fields:
Step 3
Step 4
To delete an alert, select the line of the alert and click Delete, or right-click the line and select Delete from the popup menu. MWFM asks you to confirm the deletion. When you confirm, the selected alert is deleted from the database and the Alerts screen is refreshed.
Note
Step 5
Step 6
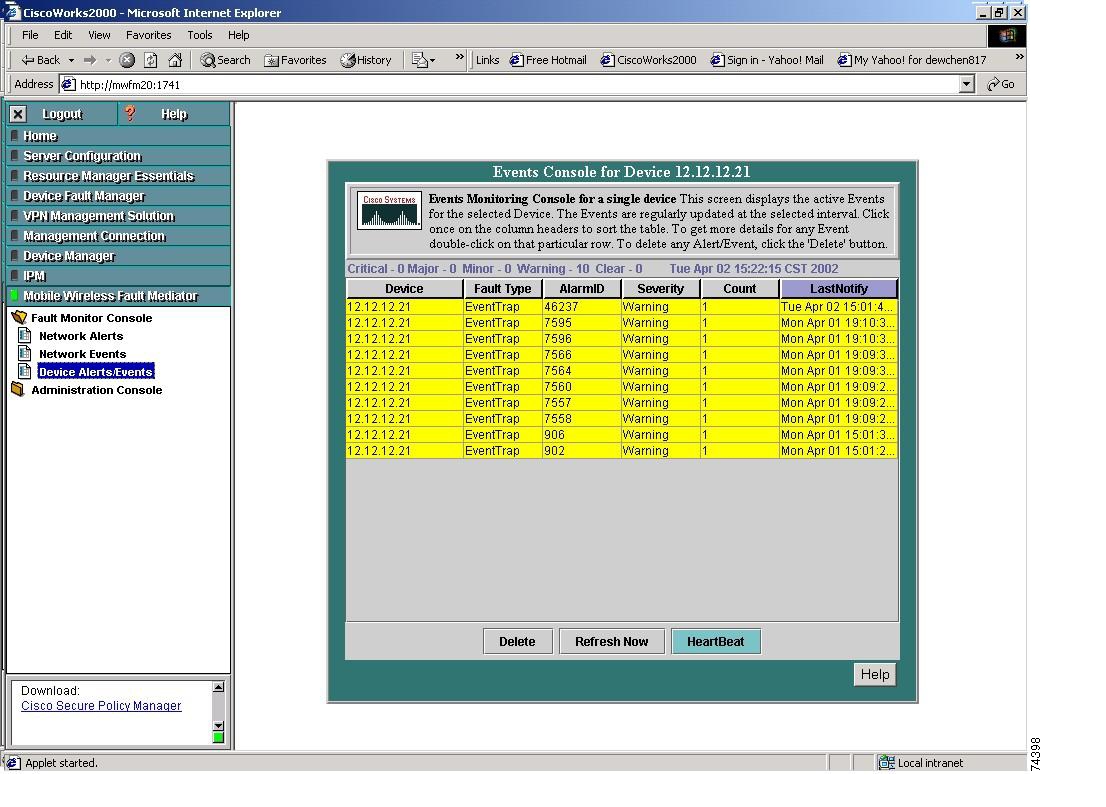
Step 7
Figure 10 Events Console for Device Window
The Events Console for Device window contains the following fields:
Step 8
Step 9
To delete an event, select the line of the event and click Delete, or right-click the line and select Delete from the popup menu. MWFM asks you to confirm the deletion. When you confirm, the selected event is deleted from the database and the Events screen is refreshed.
Note
Step 10
Step 11
Using the MWFM Administration Console
The MWFM Administration Console enables you to perform the following tasks:
•
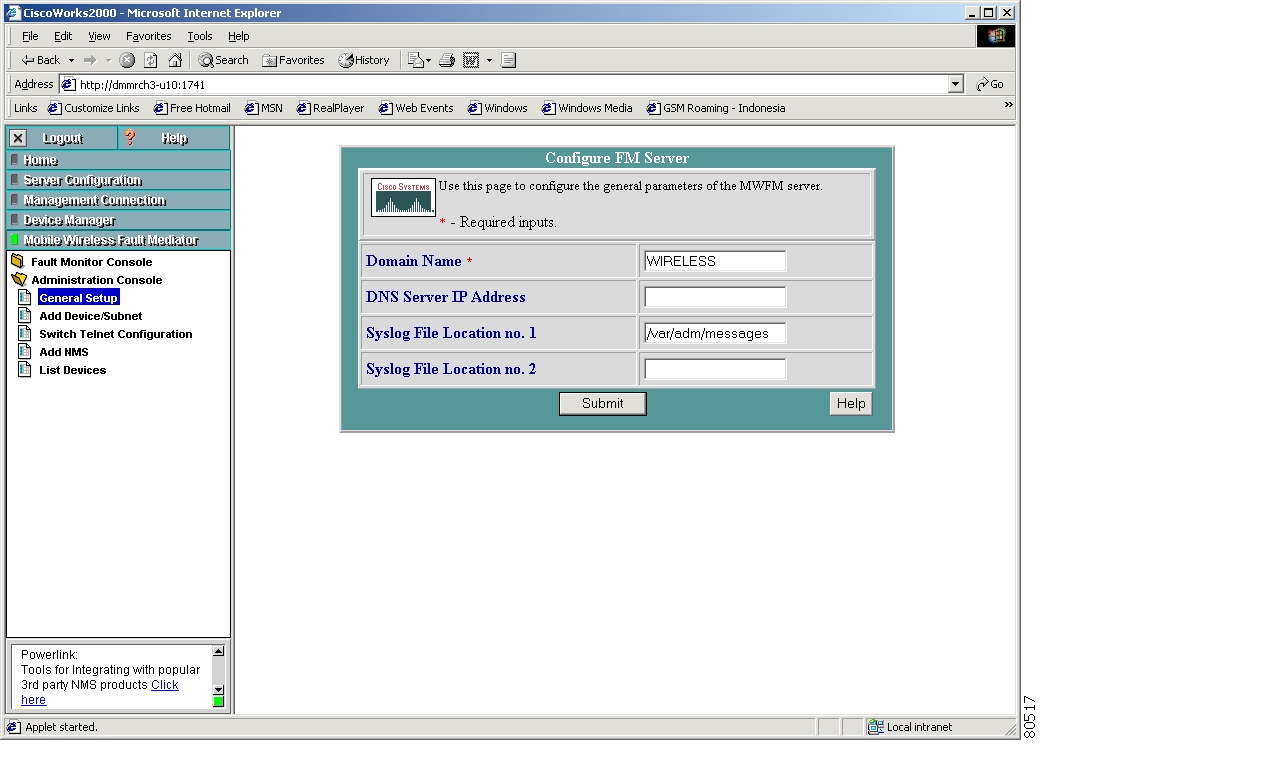
Configuring MWFM
An operator with security privilege of Network Administrator (NA) or System Administrator (SA) can configure general MWFM parameters, such as the MWFM domain name, the IP address of the DNS server, and the location of the syslog file.
To view and change the current configuration, use the following procedure:
Step 1
Figure 11 Configure FM Server Console
The Configure FM Server console contains the following fields:
Step 2
If you specify an incorrect name or an invalid IP address, MWFM issues an appropriate error message.
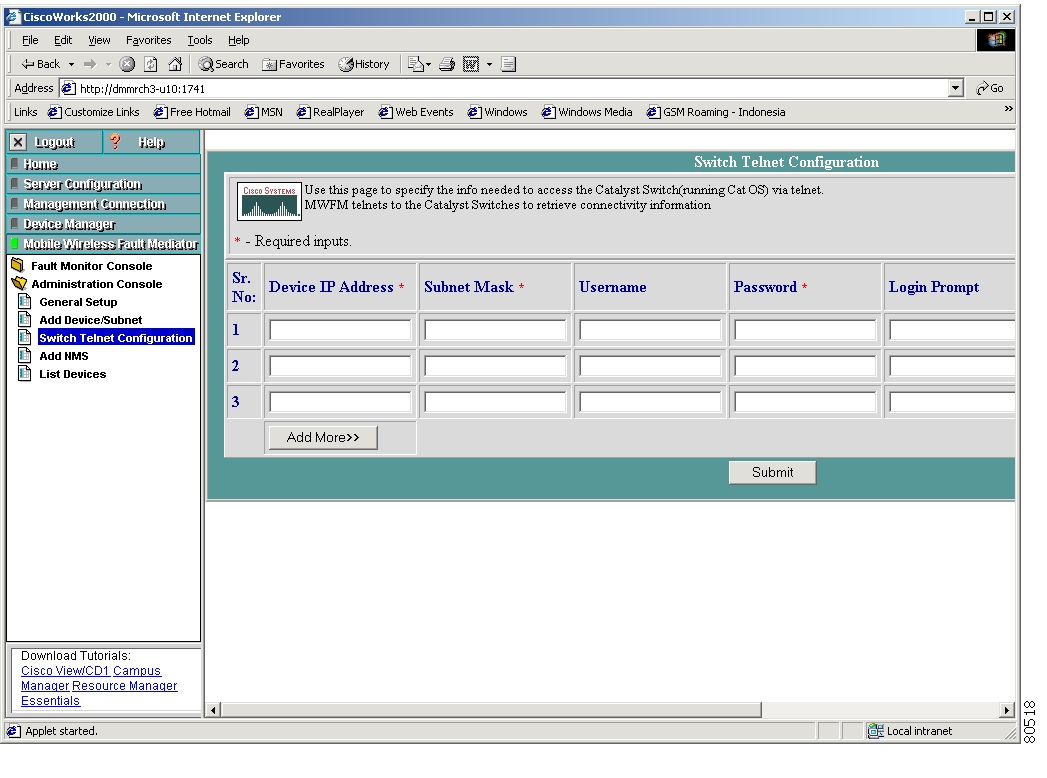
Configuring Switch Telnet
An operator with security privilege of System Administrator (SA) or higher can Telnet to a Catalyst switch that is running Cat OS.
To access a Catalyst switch via Telnet, use the following procedure:
Step 1
Figure 12 Switch Telnet Configuration Console
The Switch Telnet Configuration console contains the following fields:
Step 2
If you specify an invalid IP address or subnet mask, MWFM issues an appropriate error message.
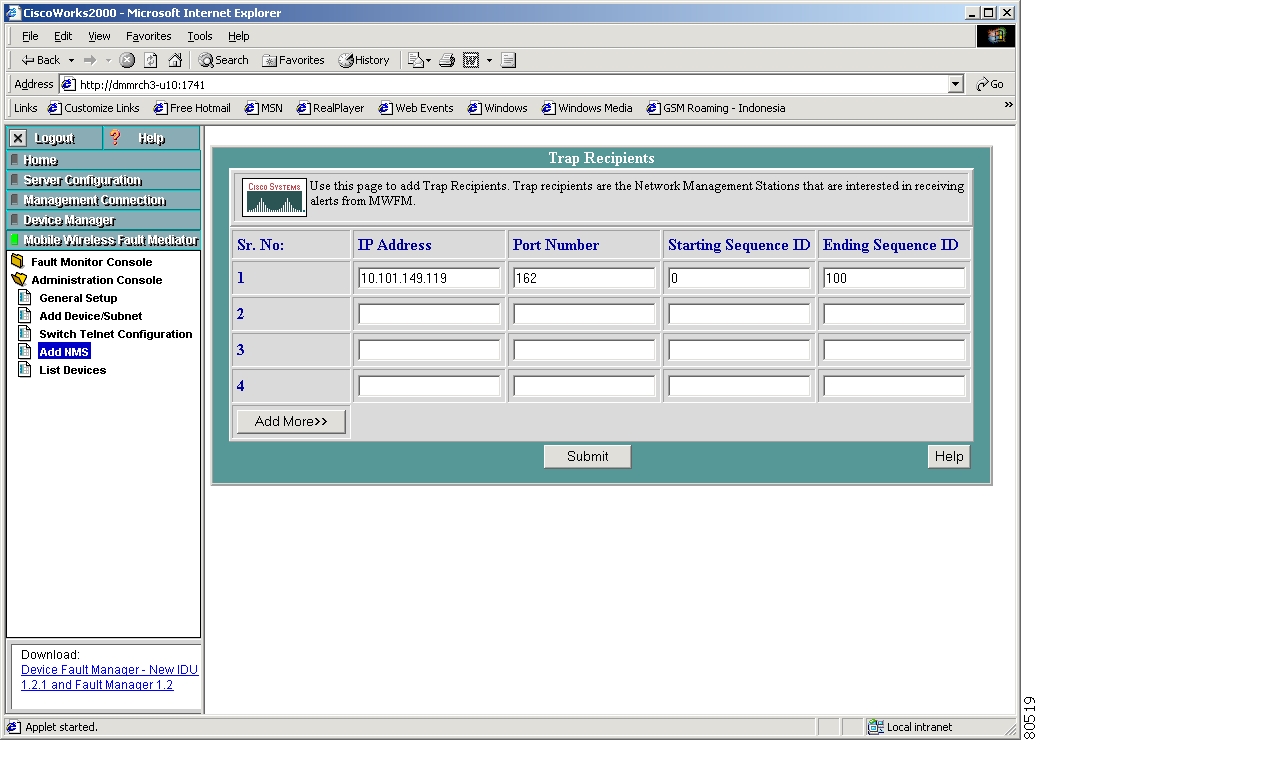
Adding NMS
An operator with security privilege of Network Administrator (NA) or System Administrator (SA) can add an NMS station as an MWFM trap recipient.
To add an NMS station to MWFM, use the following procedure:
Step 1
Figure 13 Trap Recipients Console
The Trap Recipients console contains the following fields:
Step 2
If you specify an invalid IP address, port number, or sequence ID, MWFM issues an appropriate error message.
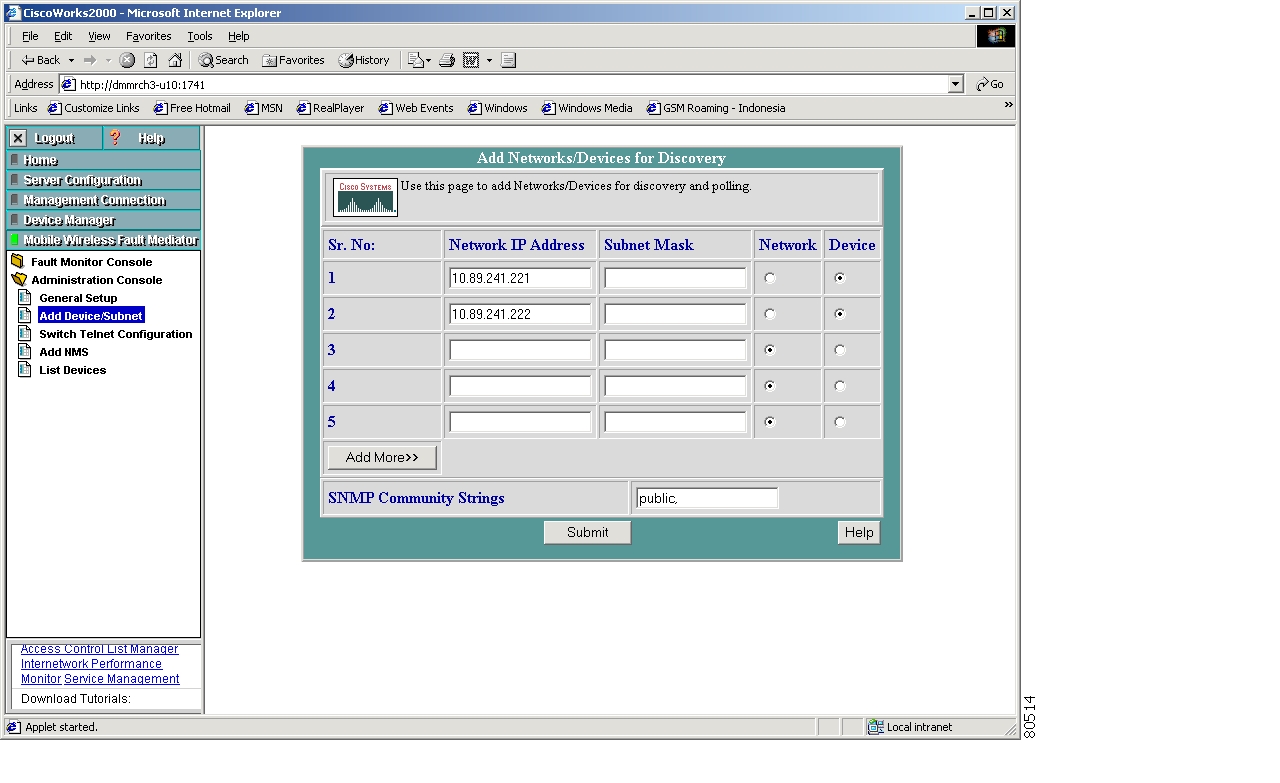
Adding Networks or Devices for Discovery
An operator with security privilege of Network Administrator (NA) or System Administrator (SA) can add new networks or devices for MWFM to monitor.
To add a new network or device, use the following procedure:
Step 1
Figure 14 Add Networks/Devices for Discovery Console
The Add Networks/Devices for Discovery console contains the following fields:
Step 2
If you specify an invalid IP address or subnet mask, MWFM issues an appropriate error message.
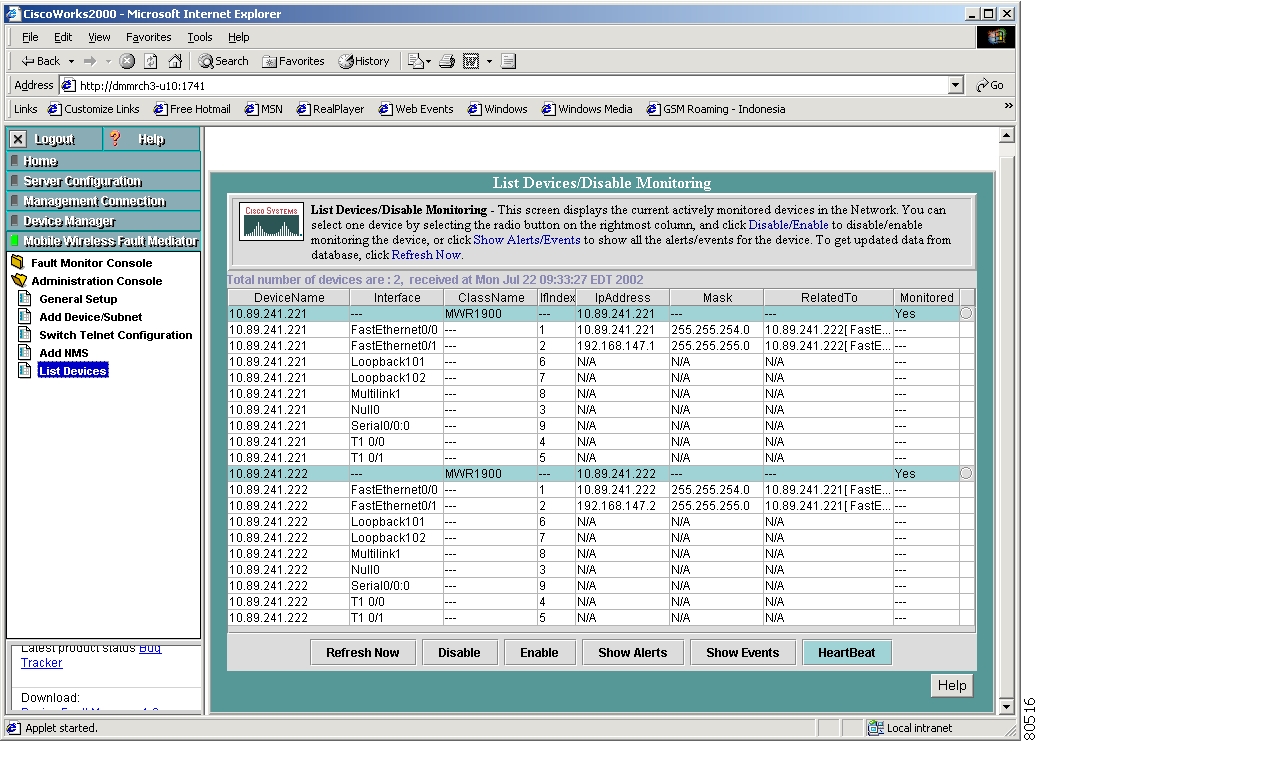
Listing Devices
To view a list of all devices in the network that are currently monitored by MWFM, along with their interfaces, use the following procedure:
Step 1
Figure 15 List Devices/Disable Monitoring Window
The List Devices/Disable Monitoring window contains the following fields:
Step 2
Step 3
Step 4
Step 5
Step 6
Step 7
Using the MWFM HeartBeat Console
Each MWFM GUI console window displays a color-coded HeartBeat button, which enables you to view detailed status for the current MWFM processes.
The color of the HeartBeat button indicates the aggregated status of the MWFM processes, where:
•
•
•
The color of the HeartBeat button is refreshed every 15 seconds, based on the HeartBeat records polled from the backend.
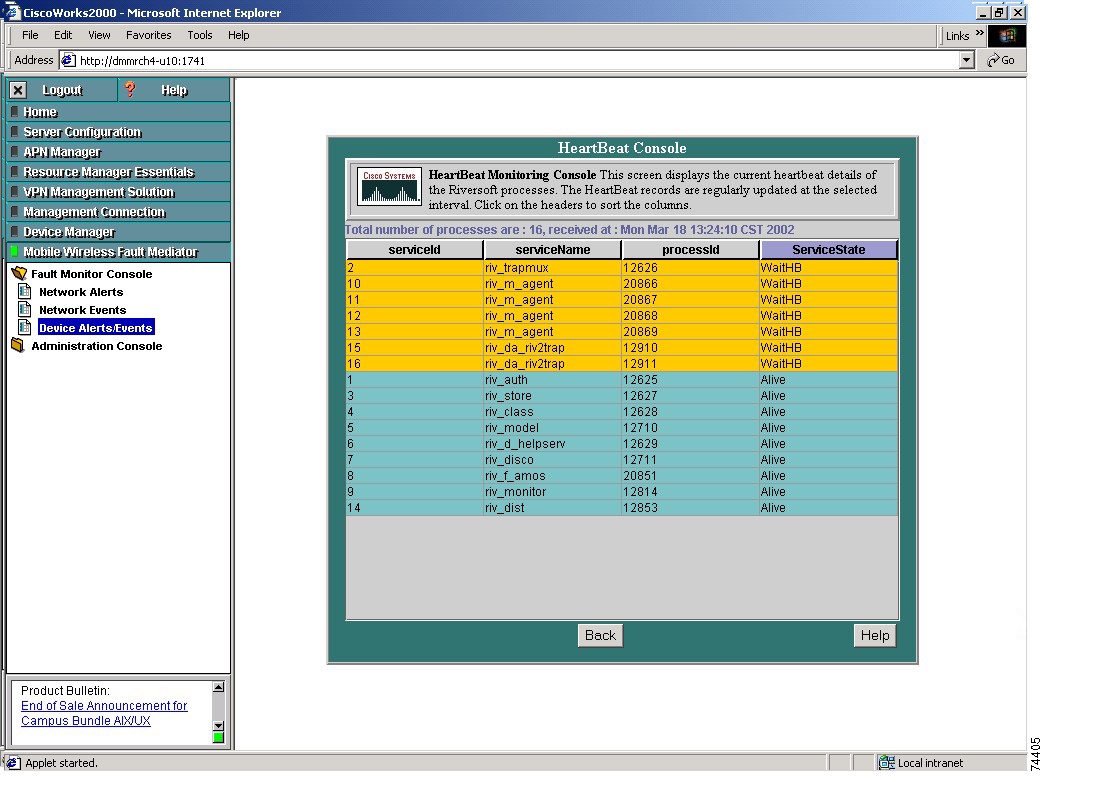
To view detailed status for the current MWFM processes, open one of the console windows, then click HeartBeat. MWFM displays the HeartBeat console ( Figure 16).
Figure 16 HeartBeat Console Window
Each individual line in the HeartBeat Console window is color-coded, where:
•
•
•
The HeartBeat Console window contains the following fields:
To sort the table based on the data in a particular column, click the header of the column. To reverse the sort order, click the header a second time.
This data in this window refreshes every 15 seconds.
Troubleshooting
The following sections contain information that might be helpful when troubleshooting error messages or conditions.
Viewing CiscoWorks2000-Related Messages
To view CiscoWorks2000-related messages that do not display on the GUI, do the following:
•
To enable the native JVM console when using Internet Explorer:
–
–
–
To enable the native JVM console when using Netscape:
–
–
•
–
–
Resolving Error Messages and Conditions
The CiscoWorks2000 Desktop Does Not Appear on the Browser
If the CiscoWorks2000 desktop does not appear on the browser, verify that the CiscoWorks2000 Server is running correctly.
To verify the CiscoWorks2000 processes are running correctly, on the server running CiscoWorks2000, do the following:
Step 1
Step 2
Step 3
•
•
Step 4
Step 5
On Solaris:
Step 1
Step 2
Step 3
Step 4
•
•
Step 5
Step 6
Note
Error Message "No Java 2 SDK Support for Applet" Displays
If the error message "No Java 2 SDK Support for Applet Displays" on the MWFM console, download and install the Java 2 SDK Standard Edition 1.3.1 on the client machine from the Sun website (http://java.sun.com/j2se/) and restart the GUI.
Error Message "Please check if mwfm Server is up and running" Displays
If the error message "Please check if mwfm Server is up and running" displays, verify that the MWFM Server is functioning normally as explained below.
Verifying that the MWFM Server is Functioning Normally
If CiscoWorks2000 is running properly, but yet you are unable to access the MWFM GUI, try the following:
•
•
•
•
If none of the above explains or fixes the condition, the MWFM Server processor load could be high. Server load is initially high due to multiple processes consuming CPU at the same time which can cause occasional timeouts from the rendezvous. This condition is significantly reduced after the MWFM discovery process is completed.
Obtaining Documentation
The following sections explain how to obtain documentation from Cisco Systems.
World Wide Web
You can access the most current Cisco documentation on the World Wide Web at the following URL:
Translated documentation is available at the following URL:
http://www.cisco.com/public/countries_languages.shtml
Documentation CD-ROM
Cisco documentation and additional literature are available in a Cisco Documentation CD-ROM package, which is shipped with your product. The Documentation CD-ROM is updated monthly and may be more current than printed documentation. The CD-ROM package is available as a single unit or through an annual subscription.
Ordering Documentation
Cisco documentation is available in the following ways:
•
http://www.cisco.com/cgi-bin/order/order_root.pl
•
http://www.cisco.com/go/subscription
•
Documentation Feedback
If you are reading Cisco product documentation on Cisco.com, you can submit technical comments electronically. Click Leave Feedback at the bottom of the Cisco Documentation home page. After you complete the form, print it out and fax it to Cisco at 408 527-0730.
You can e-mail your comments to bug-doc@cisco.com.
To submit your comments by mail, use the response card behind the front cover of your document, or write to the following address:
Cisco Systems
Attn: Document Resource Connection
170 West Tasman Drive
San Jose, CA 95134-9883We appreciate your comments.
Obtaining Technical Assistance
Cisco provides Cisco.com as a starting point for all technical assistance. Customers and partners can obtain documentation, troubleshooting tips, and sample configurations from online tools by using the Cisco Technical Assistance Center (TAC) Web Site. Cisco.com registered users have complete access to the technical support resources on the Cisco TAC Web Site.
Cisco.com
Cisco.com is the foundation of a suite of interactive, networked services that provides immediate, open access to Cisco information, networking solutions, services, programs, and resources at any time, from anywhere in the world.
Cisco.com is a highly integrated Internet application and a powerful, easy-to-use tool that provides a broad range of features and services to help you to
•
•
•
•
•
You can self-register on Cisco.com to obtain customized information and service. To access Cisco.com, go to the following URL:
Technical Assistance Center
The Cisco TAC is available to all customers who need technical assistance with a Cisco product, technology, or solution. Two types of support are available through the Cisco TAC: the Cisco TAC Web Site and the Cisco TAC Escalation Center.
Inquiries to Cisco TAC are categorized according to the urgency of the issue:
•
•
•
•
Which Cisco TAC resource you choose is based on the priority of the problem and the conditions of service contracts, when applicable.
Cisco TAC Web Site
The Cisco TAC Web Site allows you to resolve P3 and P4 issues yourself, saving both cost and time. The site provides around-the-clock access to online tools, knowledge bases, and software. To access the Cisco TAC Web Site, go to the following URL:
All customers, partners, and resellers who have a valid Cisco services contract have complete access to the technical support resources on the Cisco TAC Web Site. The Cisco TAC Web Site requires a Cisco.com login ID and password. If you have a valid service contract but do not have a login ID or password, go to the following URL to register:
http://www.cisco.com/register/
If you cannot resolve your technical issues by using the Cisco TAC Web Site, and you are a Cisco.com registered user, you can open a case online by using the TAC Case Open tool at the following URL:
http://www.cisco.com/tac/caseopen
If you have Internet access, it is recommended that you open P3 and P4 cases through the Cisco TAC Web Site.
Cisco TAC Escalation Center
The Cisco TAC Escalation Center addresses issues that are classified as priority level 1 or priority level 2; these classifications are assigned when severe network degradation significantly impacts business operations. When you contact the TAC Escalation Center with a P1 or P2 problem, a Cisco TAC engineer will automatically open a case.
To obtain a directory of toll-free Cisco TAC telephone numbers for your country, go to the following URL:
http://www.cisco.com/warp/public/687/Directory/DirTAC.shtml
Before calling, please check with your network operations center to determine the level of Cisco support services to which your company is entitled; for example, SMARTnet, SMARTnet Onsite, or Network Supported Accounts (NSA). In addition, please have available your service agreement number and your product serial number.
This document is to be used in conjunction with the documents listed in the "Related Documentation" section.
CCIP, the Cisco Arrow logo, the Cisco Powered Network mark, the Cisco Systems Verified logo, Cisco Unity, Follow Me Browsing, FormShare, Internet Quotient, iQ Breakthrough, iQ Expertise, iQ FastTrack, the iQ Logo, iQ Net Readiness Scorecard, Networking Academy, ScriptShare, SMARTnet, TransPath, and Voice LAN are trademarks of Cisco Systems, Inc.; Changing the Way We Work, Live, Play, and Learn, Discover All That's Possible, The Fastest Way to Increase Your Internet Quotient, and iQuick Study are service marks of Cisco Systems, Inc.; and Aironet, ASIST, BPX, Catalyst, CCDA, CCDP, CCIE, CCNA, CCNP, Cisco, the Cisco Certified Internetwork Expert logo, Cisco IOS, the Cisco IOS logo, Cisco Press, Cisco Systems, Cisco Systems Capital, the Cisco Systems logo, Empowering the Internet Generation, Enterprise/Solver, EtherChannel, EtherSwitch, Fast Step, GigaStack, IOS, IP/TV, LightStream, MGX, MICA, the Networkers logo, Network Registrar, Packet, PIX, Post-Routing, Pre-Routing, RateMUX, Registrar, SlideCast, StrataView Plus, Stratm, SwitchProbe, TeleRouter, and VCO are registered trademarks of Cisco Systems, Inc. and/or its affiliates in the U.S. and certain other countries.
All other trademarks mentioned in this document or Web site are the property of their respective owners. The use of the word partner does not imply a partnership relationship between Cisco and any other company. (0206R)
Copyright © 2002, Cisco Systems, Inc.
All rights reserved.
![]()
![]()
![]()
![]()
![]()
![]()
![]()
![]()
Posted: Tue Jan 4 09:53:57 PST 2005
All contents are Copyright © 1992--2005 Cisco Systems, Inc. All rights reserved.
Important Notices and Privacy Statement.