CiscoView Wireless (CV) is an SNMP-based device management software application with which you can configure and monitor information for Cisco Internetworking Products.
CiscoView Wireless runs in two distinct modes:
Stand-alone
Client/server
About the Stand-Alone Version
The stand-alone version of CiscoView Wireless is a Windows application. All components of CiscoView Wireless and its support software are on the same system and communicate directly with the managed devices.
CiscoWorks for Windows (CWW5.0) suite includes the stand-alone version of CiscoView Wireless.
For detailed information on CWW 5.0, refer to the Cisco Works Windows 5.0 documentation, or go to:
CiscoView Wireless runs as a client applet within a browser. The server component of the client server is called CD One. A CiscoView Wireless client can talk to a managed device by using the server. The client/server version is available for two different operating systems:
Solaris
Microsoft Windows NT.
Because the CiscoView Wireless client runs within a browser, you can run the client on Solaris and Microsoft Windows operating platforms.
For documentation on CD One 3rd Edition and CiscoView Wireless client that runs on CD One, go to:
Note CiscoView Wireless Quick Reference Guide describes only the client/server version of CiscoView
Wireless that runs on the Solaris operating system.
Overview of System Components
The CiscoView Wireless CD contains the client/server version of CiscoView Wireless and these components:
CD One for the Solaris workstation
CiscoView Wireless device packages that contain wireless feature support for:
Headend - uBR7200 for Cisco uBR7200 series universal broadband routers
Subscriber unit - Rtr3600 for Cisco 3600 series routers, Rtr2600 for Cisco 2600 series routers
The following software components are in the following locations:
The CD One software is in the root directory of the CD.
CiscoView Wireless device packages are in the directory /CV_packages/.
Software components required but not included in the CiscoView Wireless CD are:
Solaris patches
Browsers for CiscoView Wireless clients.
CiscoView Wireless Package Upgrade
The CiscoView Wireless CD contains the CiscoView Wireless packages with support for point-to-multipoint wireless feature set. These packages will be updated as problems are solved and new features are added. You can download the updated packages from: ftp://ftp.cisco.com/cisco/netmgmt/ciscoview/5.0/packages
About Point-to-Multipoint (P2MP) Radio Line Card Support
In an operational system, a wireless link is established between a point-to-multipoint (P2MP) radio line card in a Cisco uBR7200 series universal broadband router at one end and a complementary P2MP radio line card in a Cisco 26xx or a 36xx series router at the other end. CiscoView Wireless supports the P2MP line card on the following three platforms:
Cisco uBR7200 series universal broadband routers
Cisco 26xx series routers
Cisco 36xx series routers
The P2MP radio line card supports two views:
Physical
Logical
As a radio line card starts a wireless interface, you can see the physical appearance of the radio line card and its real-time status in the physical view. The wireless line card also starts one over-the-air downstream channel and multiple over-the-air upstream channels, which appear in the logical view as tangible connectors.
These connectors look and behave like physical connectors and provide access to the characteristics of downstream and upstream channels supported by the line card. You can switch between the physical and logical views by using menus associated with the line card.
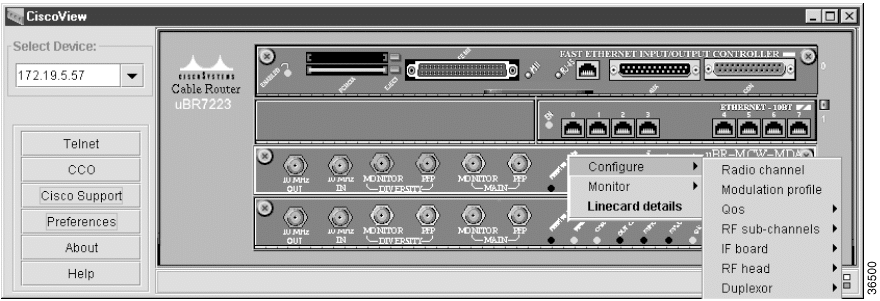
For example, Figure 1 shows the physical view for a Cisco uBR7200 series router with two P2MP radio line cards in slots 2 and 3. Each line card has:
External clock references.
Input: Shows whether an external clock reference is connected to the line card.
Output: Shows whether the line card is acting as a clock reference.
The monitor and power feed panel (PFP) connectors for the main and diversity antenna.
The various LEDs on the line card.
Figure 1-1 Headend Physical View
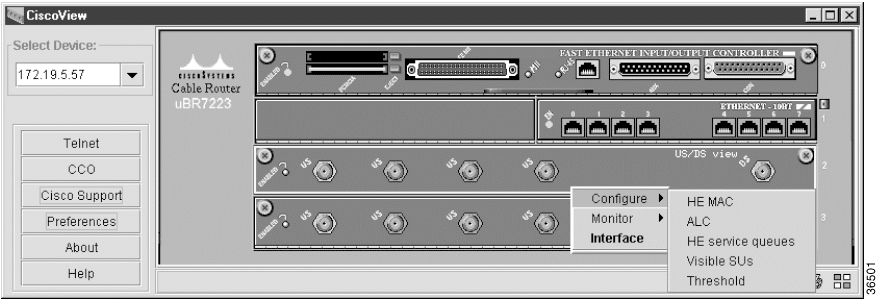
Figure 2 shows the logical view of the P2MP headend line card in the Cisco uBR7200 router and shows the downstream and upstream channels supported by the line card.
Figure 1-2 Headend Logical View
About Headend P2MP Line Cards
Table 2 shows the supported feature set for the wireless point-to-multipoint headend line card.
Describes modulation profile for an interval usage code for one or more upstream channels
Physical View:
Configure>Modulation Profile
To create a new modification profile menu, use the modulation profile table.
Logical view:
Click on the US port for a menu.
Configure>Modulation profile
Signal Quality
Describes the quality of upstream channels in terms of codeword errors, SINR, and so on
Logical view:
Click on the US port for a menu.
Configure>Signal quality
Downstream
Configuration
Configuration for a single downstream channel
Physical view:
Configure>RFsub-Channels>
Downstream
or
Logical view:
Click on the DS port for a menu.
Configure> Downstream Channel
Media Access Control (MAC)
Configuration
Describes attributes of each media access control (MAC) interface
Logical view:
Configure>HE MAC
Status
Status for a single MAC layer
Logical view:
Monitor>HE MAC status
Subscriber Units
Status
Reset SU
Status information for each subscriber unit in the system
Logical view:
Configure>Visible SUs
Logical view:
Click on the US port for a menu.
Configure>Visible SUs
Service
Profile
Describes attributes of a single class of service
Physical view:
Configure>Qos>Qos details
Scheduler
Attributes for each upstream MAC scheduler (QOS) used to control subscriber registration
Rate limiting attributes for each upstream/downstream scheduler supporting QOS
Logical view:
Configure>Qos (Su-Registration)
Logical view:
Configure>Qos (Bandwidth-control)
Queues
Describes the attributes of a single upstream bandwidth service queue
Logical view:
Configure>HE services queue
Logical view:
Configure>Request Q>Details
About Subscriber Unit P2MP Line Cards
Table 3 shows the supported feature set for the wireless point-to-multipoint headend line card.
Table 1-2 Subscriber Unit Supported Feature Set
Element
Feature
Description
Navigational Path
RF
Revision information
Assembly and board revision information
Physical view:
Configure>RF Head>Main RF>Hardware details
or
Right click on the Main connector.
Configuration
NumRxAnt, Cable loss, TxMuteDuration, and so on
Physical view:
Configure>Radio Channel
Configuration parameter and state
Information about min/max freq, RF Osc/supply/temp status, and so on
Physical view:
Configure>RF Head>Main RF> Status
OR
Right click on the Main connector.
Statistics
Histograms
Timelines
Snapshots
Thresholds
Control, summary, and data tables
Physical view:
Monitor> Radio Signal Attributes
Logical View:
Click on the DS port for a menu.
Monitor>Radio Signal Attributes
Diagnostics
Loopback at various RF points
Physical view:
Configure>Radio Channel
IF
Revision information
Assembly and board revision information
Physical view:
Configure>IF board>Hardware details
Configuration parameter and state
Tx/Rx Osc state, input/output frequency
Physical view:
Configure>IF board> Status
Diagnostics
Loopback at various IF points
Physical view:
Configure>Radio Channel
Duplexer
Configuration information
Passband min/max frequency and insertion loss
Physical view:
Configure> Duplexer> Main/Diversity
LED
Configuration and status
Tx:tranmitdata
Rx:recievedata
OS:outofservice
MA:majoralarm,
MI:minoralaram,
CR:carrier
EN:interfaceEnable indication
Available on the physical view.
Upstream
Configuration
Configuration for a single upstream channel
Physical view:
Configure>Upstream Channels
Logical view:
Click on the US port for a menu.
Configure> Upstream
Service Queues
Describes the attributes of a single upstream bandwidth service queue
Logical view:
Configure>Service queues
Downstream
Configuration
Configuration for a single downstream channel
Physical view:
Configure>Downstream Channels
Logical view:
Right click on the DS port for a menu.
Configure>Downstream
Signal quality
Describes physical sublayer (PHY) quality for a downstream channel
Logical view:
Right click on the DS port for a menu.
Configure>Signal Quality
Monitor>Radio link metrics
Media Access Control (MAC)
Configuration
Describes attributes of each MAC interface
Logical view:
Configure>Mac Info
Status
Status for a single MAC layer
Logical view:
Monitor>Mac Status>Status Objects
Monitor>Mac Status>Status Counters
About Advanced Radio Signal Analysis
With CiscoView Wireless, you can configure and monitor radio signal parameters in various ways. You can change the following signal attributes:
Common to both headends and subscriber units:
Signal to interference noise ratio (SINR) for the main and diversity antennas
Timing Offset
Received power at the main and diversity antennas
Channel delay spread at the main and diversity antennas
Specific to headends only
Ambient noise
Specific to subscriber units only
Received power delta at the main and diversity antennas
Total transmit power
CiscoView Wireless provides the following classes of features to configure and monitor radio signal parameters:
Histograms
RF Thresholds
Timelines
Snapshots
About Real-Time Histograms
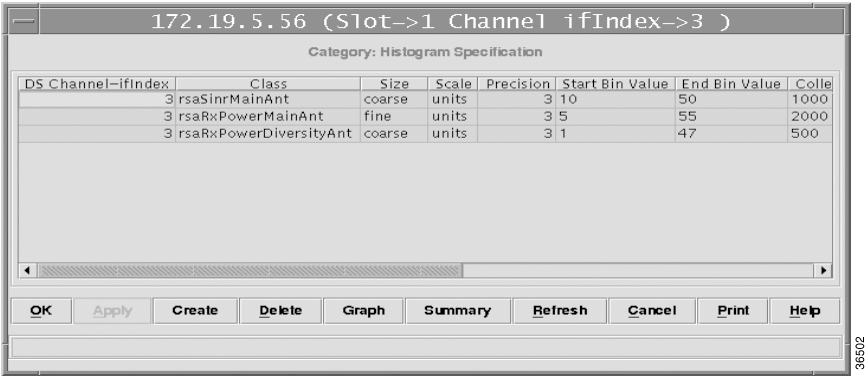
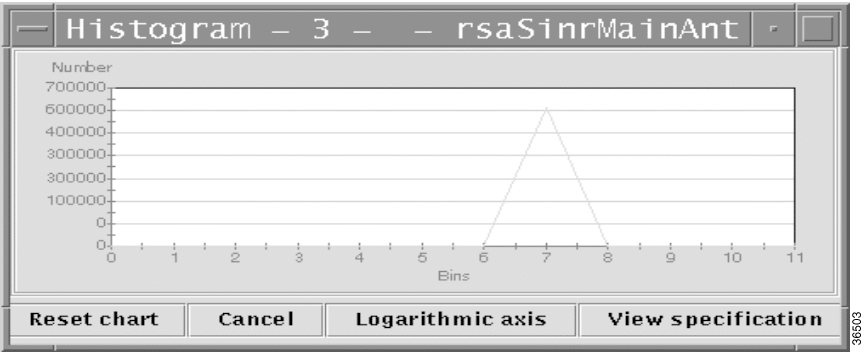
A Histogram represents:
A technique of capturing, processing, and storing radio signal information in an easy to interpret format
A graphical representation of the captured data
With CiscoView Wireless, you can create histogram specifications on the managed device. Once the specification is created, the managed device captures the signal information. Then, you can set up the histogram to capture data for a long period of time for a single upstream or for one subscriber unit that is registered with the headend. CiscoView Wireless can then graph the collected data in a periodic manner.
Figure 1-3 Histogram Specification Table
Figure 1-4 The SINR Histogram
.
Creating a Histogram
With CiscoView Wireless, you can retrieve the captured histogram data (from the managed device) at regular intervals and store them in a database at the server. You can retrieve and view the stored data at a later date
Step 1 Click on the Create option in the histogram specification table.
Step 2 Select the Persistent option in the histogram specification. The Histogram specification appears in the Histogram History. [Chassis>Histogram History>This device/All devices].
For each entry in the Histogram History Table, there is a data file in binary format on the server at the location <CD One install directory>/CSCOpx/www/classpath/devpkg_P2MP where the histogram values are updated as specified by update rate parameter.
Step 3 To stop the collection of histograms permanently, click Stop Collection.
Step 4 To convert the data in the binary file to ASCII format, select the histogram specification from the histogram history table, and click Bin to ASCII.
Step 5 To graph the saved data, select a specification from the Histogram History Table and click Graph.
About RF Thresholds
With CiscoView Wireless, you can establish thresholds on radio signal parameters. A threshold is defined as a transition relative to a specified value. The different types of transitions are:
UpChange
DownChange
HighThreshold
LowThreshold
UpLimit
LowLimit
When a threshold is crossed, the managed device generates a trap. You can associate a threshold with a timeline, and when the threshold is crossed, the timeline is captured.
About Timelines
Timelines represent:
A technique of capturing and storing a limited set of sampled raw radio signal information.
A graphical representation of the captured data.
You can create timeline specifications on the managed device. Once the specification is created, the managed device captures the signal information. Once captured, the data must be cleared by another clear request before you can initiate another capture. You can capture the data under two conditions:
If an RF threshold is not associated with the timeline specification, then the data is captured as soon as the create request is sent to the managed device.
If an RF threshold is associated with the timeline specification, then the data is captured when the threshold is crossed.
You can create timeline specifications on the managed device for the radio signal attributes and graph the data captured by a timeline specification.
About Snapshots
Snapshots represent:
A technique of capturing and storing radio signal data that has undergone various levels of signal processing. The critical difference between a timeline and a snapshot is that a snapshot can be set up to monitor up to four simultaneous attributes.
A graphical representation of the captured data.
You can create snapshot specifications on the managed device. Once the specification is created, the managed device captures the signal information. Once the data is captured, it must be cleared by another clear request before you can initiate another capture. You can also graph the data captured by a snapshot specification.