Table Of Contents
Viewing Statistics
TCP Statistics
SSL Statistics
PKI Statistics
Viewing Statistics
CVDM-SSLSM allows you to view the statistics of the traffic through the SSL Module. The values are not auto-refreshed. You can manually refresh the values.
CVDM-SSLSM provides statistical information on the following:
• TCP Statistics
• SSL Statistics
• PKI Statistics
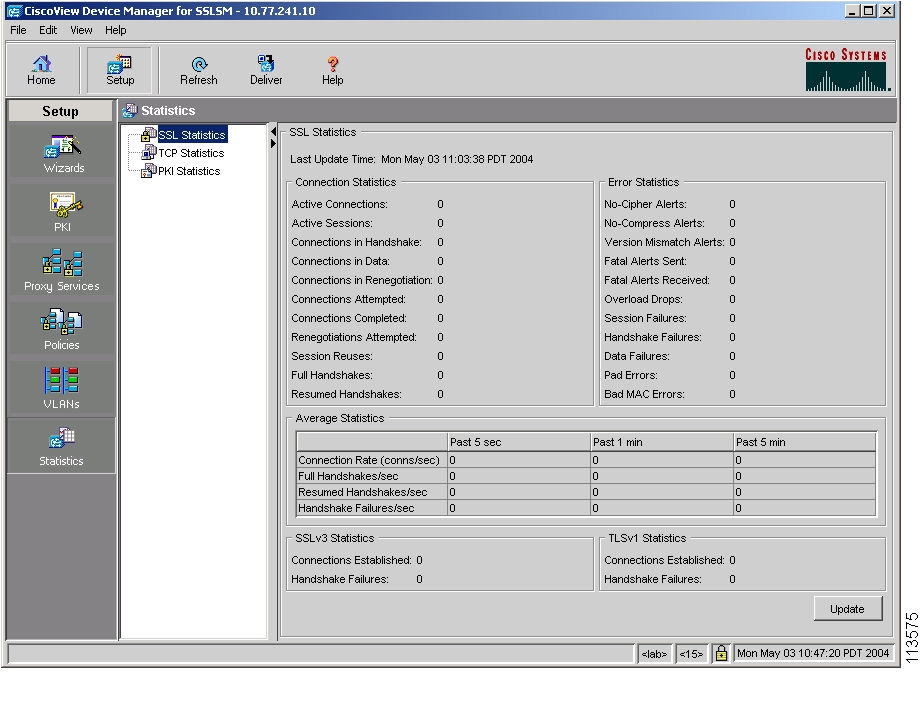
Figure 10-1 Statistics Page
TCP Statistics
To view TCP Statistics:
Step 1 Click Setup in the task bar, then select Statistics from the left-most pane.
Step 2 Select TCP Statistics from the Object Selector.
The following fields appear:
Field
|
Description
|
Last Update Time
|
The time at which the statistics information was last updated.
|
Show Counter Value Change (Delta)
|
Values are:
Delta—Select this option to view the counter value change (delta) between subsequent updates. When this option is selected, the measurement period between subsequent updates will be displayed.
Absolute—Displays the cumulative value.
|
Connection Statistics
|
Connections in Established State
|
Number of connections in ESTABLISHED state.
|
Current in TIME-WAIT State
|
Number of connections in TIME-WAIT state.
|
Connections Initiated
|
Number of TCP connections initiated by the SSLSM.
|
Connections Dropped
|
Number of connections that were dropped.
|
Connections Closed
|
Number of connections that were closed.
|
Connections Accepted
|
Number of TCP connections accepted by the SSLSM.
|
Click Update to refresh the values.
SSL Statistics
To view SSL Statistics:
Step 1 Click Setup in the task bar, then select Statistics from the left-most pane.
Step 2 Select SSL Statistics from the Object Selector.
The following fields are displayed:
Field
|
Description
|
Last Update Time
|
The time at which the statistics information was last updated.
|
Show Counter Value Change (Delta)
|
Values are:
Delta—Select this option to view the counter value change (delta) between subsequent updates. When this option is selected, the measurement period between subsequent updates will be displayed.
Absolute—Displays the cumulative value.
|
Connection Statistics
|
Active Connections
|
Number of Active SSL connections
|
Active Sessions
|
Number of Session IDs in use.
|
Connections in Handshake
|
Number of connections in the Handshake phase.
|
Connections in Data
|
Number of connections in data phase.
|
Connections in Renegotiation
|
Number of connections in re-negotiation phase.
|
Connections Attempted
|
Number of connections attempted.
|
Connections Completed
|
Number of connections that were completed.
|
Renegotiations Attempted
|
Number of re-negotiations attempted.
|
Session Reuses
|
Number of times when the session got reused.
|
Full Handshakes
|
Number of Full Handshakes performed.
|
Resumed Handshakes
|
Number of resumed handshakes performed.
|
Error Statistics
|
No-Cipher Alerts
|
Number of Handshake Failure alerts sent due to unsupported Cipher suites
|
No-Compress Alerts
|
Number of Handshake Failure alerts sent due to unsupported compression scheme.
|
Version Mismatch Alerts
|
Number of Handshake Failure alerts sent due to unsupported SSL version.
|
Fatal Alerts Sent
|
Number of fatal alerts sent.
|
Fatal Alerts Received
|
Number of fatal alerts received.
|
Overload Drops
|
Number of connections that were declined due to overload.
|
Session Failures
|
Number of instances when the allocation failed.
|
Handshake Failures
|
Number of connections that failed in the Handshake phase.
|
Data Failures
|
Number of connections that failed due to data errors (Pad Error/Bad MAC Error)
|
Pad Errors
|
Number of SSL records received with error in padding.
|
Bad MAC Errors
|
Number of SSL records received with Bad MAC.
|
Average Statistics
|
Connection Rate (conns/sec)
|
Number of connections in a second.
|
Full Handshakes/sec
|
Number of handshakes in a second.
|
Resumed Handshakes/sec
|
Number of handshakes resumed in a second.
|
Handshake Failures/sec
|
Number of handshake failures in a second.
|
SSLv3 Statistics
|
Connections Established
|
Number of SSLv3 connections established.
|
Handshake Failures
|
Number of SSLv3 handshakes failed.
|
TSLv1 Statistics
|
Number of TSLv1 connections.
|
Connections Established
|
Number of connections established.
|
Handshake Failures
|
Number of handshakes failed.
|
Timeout Statistics
|
SYN Timeouts
|
Number of SYN Timeouts.
|
Idle Timeouts
|
Number of Idle Timeouts.
|
Reassembly Timeouts
|
Number of Reassembly Timeouts.
|
FIN-WAIT2 Timeouts
|
Number of FIN-WAIT2 Timeouts.
|
Drop Statistics
|
Invalid MSS Drops
|
Connections dropped due to unsupported MSS size.
|
Connection Buffer Pool Drops
|
Number of connection buffer pool drops.
|
Packet Statistics (Transmit)
|
Total Packets
|
Number of packets transmitted
|
Data Packets
|
Number of data packets transmitted.
|
Retransmitted Packets
|
Number of packets retransmitted.
|
Packet Statistics (Receive)
|
Total Packets
|
Number of packets received
|
Packets in Sequence
|
Number of packets received in sequence.
|
Packets out of sequence
|
Number of packets received out of sequence.
|
Click Clear to clear the counter values on the SSLSM.
Click Update to refresh the values from the SSLSM.
Proxy SSL Statistics Summary
You can view a summary of the statistics for the client and server proxy.
To view Proxy Service Statistics Summary:
Step 1 Click Setup in the task bar, then select Statistics from the left-most pane.
Step 2 Select SSL Statistics > Client Proxy or Server Proxy from the Object Selector.
Step 3 Click the Summary tab.
The following fields are displayed:
Field
|
Description
|
Last Update Time
|
The time at which the statistics information was last updated.
|
Show Counter Values Change (Delta)
|
Values are:
Delta—Select this option to view the counter value change (delta) between subsequent updates. When this option is selected, the measurement period between subsequent updates will be displayed.
Absolute—Displays the cumulative value.
|
The table displays the following details:
Field
|
Description
|
Proxy Service
|
The name of the proxy service.
|
Connections
|
Attempted
|
Number of connected attempted.
|
Completed
|
Number of completed connections.
|
Active
|
Number of active connections.
|
Errors
|
Fatal Alarms
|
Number of Fatal Alarms.
|
Handshake Failures
|
Number of handshake failures.
|
Throughput (bytes)
|
Encrypted
|
Number of encrypted bytes.
|
Decrypted
|
Number of decrypted bytes.
|
Click Clear to clear the counter values on the SSLSM.
Click Update to refresh the values from the SSLSM.
Proxy SSL Statistics - Proxy Services
You can view the statistics for the proxy service (client proxy and service proxy).
To view Proxy Service Statistics:
Step 1 Click Setup in the task bar, then select Statistics from the left-most pane.
Step 2 Select SSL Statistics > Client Proxy or Server Proxy from the Object Selector.
Step 3 Select any of the proxy service from the list of configured proxy services.
The following fields are displayed:
Field
|
Description
|
Last Update Time
|
The time at which the statistics information was last updated.
|
Show Counter Value Change
|
Values are:
Delta—Select this option to view the counter value change (delta) between subsequent updates. When this option is selected, the measurement period between subsequent updates will be displayed.
Absolute—Displays the cumulative value.
|
The table displays the following details:
Field
|
Description
|
Proxy Service
|
The name of the proxy service. Click the proxy service name to view the details of the selected proxy service
|
Connections
|
Attempted
|
Number of connected attempted.
|
Completed
|
Number of completed connections.
|
Active
|
Number of active connections.
|
Errors
|
Fatal Alarms
|
Number of Fatal Alarms.
|
Handshake Failures
|
Number of handshake failures.
|
Throughput (bytes)
|
Encrypted
|
Number of encrypted bytes.
|
Decrypted
|
Number of decrypted bytes.
|
Click Clear to clear the counter values on the SSLSM.
Click Update to refresh the values from the SSLSM.
.Proxy Service SSL Statistics
You can view the statistics for a single proxy service (client proxy and service proxy).
To view Proxy Service Statistics:
Step 1 Click Setup in the task bar, then select Statistics from the left-most pane.
Step 2 Select SSL Statistics > Client Proxy or Server Proxy from the Object Selector.
Step 3 Select any of the proxy service from the list of configured proxy services.
The following fields are displayed:
Field
|
Description
|
Connection Counters
|
Connections Attempted
|
Number of connections attempted.
|
Connections Completed
|
Number of connections that were completed.
|
Full Handshakes
|
Number of Full Handshakes performed.
|
Resumed Handshakes
|
Number of resumed handshakes performed.
|
Active Connections
|
Connections in Handshake
|
Number of connections in the Handshake phase.
|
Connections in Data
|
Number of connections in data phase.
|
Connections in Renegotiation
|
Number of connections in re-negotiation phase.
|
Valid Sessions
|
Number of valid sessions.
|
Errors
|
Handshake Failures
|
Number of handshake failures.
|
Data Failures
|
Number of data failures.
|
Fatal Alerts Sent
|
Number of fatal alerts sent.
|
Fatal Alerts Received
|
Number of fatal alerts received.
|
No-cipher Alerts
|
Number of no cipher alerts.
|
No-compress Alerts
|
Number of no compress alerts.
|
Version Mismatch Alerts
|
Number of version mismatch alerts.
|
Bad MAC Received
|
Number of SSL records received with Bad MAC.
|
Pad Errors
|
Number of SSL records received with error in padding.
|
Session Limit Exceeds
|
|
Throughput
|
Bytes Encrypted
|
Number of bytes encrypted.
|
Bytes Decrypted
|
Number of bytes decrypted.
|
Click Clear to clear the counter values on the SSLSM.
Click Update to refresh the values from the SSLSM.
PKI Statistics
To view PKI Statistics:
Step 1 Click Setup in the task bar, then select Statistics from the left-most pane.
Step 2 Select PKI Statistics from the Object Selector.
The following fields are displayed:
Field
|
Description
|
Last Update Time
|
The time at which the statistics information was last updated.
|
Valid Signatures
|
Number of valid signatures.
|
Invalid Signatures
|
Number of invalid signatures.
|
Invalid Certificates
|
Number of invalid certificates.
|
Authentications with Warning (No CRL Check)
|
Number of authentications with warning.
|
Number of CRL Polling
|
Number of CRL polling.
|
Requests with no Peer Certificate
|
Number of requests received with no peer certificate.
|
CRL Query Failures
|
Number of CRL queries failed.
|
Unauthorized Requests
|
Number of unauthorized requests.
|
No Certificate Chain
|
Number of requests without certificate chains.
|
Root Certificate not Self-signed
|
Number of root certificates without self-signature.
|
No DER Encoded Certificate
|
Number of Certificates without DER encoding.
|
No Memory
|
Number of certificates failures due to lack of memory.
|
Bad DER Certificate Length
|
Number of certificates with bad DER certificate length.
|
Failed to get Key from Certificate
|
Number of requests that failed to get a key from the certificate.
|
Click Clear to clear the counter values on the SSLSM.
Click Update to refresh the values from the SSLSM.