|
|

Table Of Contents
Performance Utilization Report
Reports
After you complete your assessments, you can generate four reports that show your network's readiness for deploying a Cisco TelePresence solution. You should complete the questionnaire before generating the report.
Completing the Questionnaire
The questionnaire extracts information about your network that cannot be determined through inventory collection or compliance analysis. Although this step is optional, we recommend it for a more thorough and accurate assessment of your network. It contains questions about the following:
•
IP addressing
•
•
•
•
•
•
•
Generating the Report
Step 1
Step 2
•
•
Step 3
Note
Step 4
Viewing Reports
After you complete the steps to generate the report, the Report Generation Status page appears. Three buttons are available on this page:
•
•
•
–
–
–
–
Executive Report
This report gives feedback on your organization's network readiness to deploy a Cisco TelePresence Solution. Recommendations and feedback for planning and designing your network are based on the state of your network andthe deployment options you chose at the beginning of the assessment.
This report
•
•
•
•
Performance Utilization Report
This report contains information about how individual devices perform on each network path or in network inventory.
Utilization is calculated by taking the daily or hourly average CPU/memory/bandwidth utilization of each device and separating them into the following threshold categories:
•
•
•
Utilization Calculation Example 1
This example explains how utilization is calculated for one day.
Performance Study Details
•
•
•
•
Note
•
Note
Utilization Severity Levels and Threshold Percentages:
•
•
•
The report displays the graph shown in Figure 5-1:
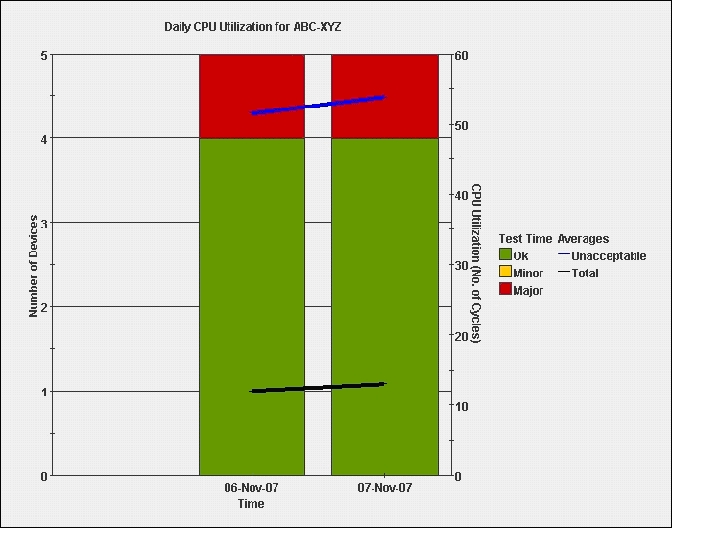
Figure 5-1 ABC-XYZ Path : Average Device Utilization for Two Days
TelePresence Readiness Assessment Manager checks each sample value against the threshold and marks it as bad or good depending on the threshold violation. The bad sample rate is obtained by dividing the number of bad samples by the total number of samples. If the bad sample percentage is greater than 20% then the devices is considered as bad. The category of the severity of the device depends on the average of the bad sample values.
For example, Device 1 had the following utilization values for November 6:
•
•
•
Device 1 average utilization = ( ( 4 x 188) + (40 x 20) + ( 60 x 52 ) ) / 288 = 16.2 %
Note
Devices are considered bad if 20% or higher of the samples are bad. Bad samples are samples that violate the threshold (51% or higher). In this example, Device 1 is considered bad since 21% (60 samples / 288 samples) of the samples had Major utilization (52%). All other devices recorded on November 6 had the following average utilization:
•
•
•
•
The daily average for all devices on November 6 is ( 16.2 + 13 + 17 + 10 + 12 ) / 5 = 13.64 % (as shown in Figure 5-1). The bad average is 52%.
The following values were taken on November 7:
•
–
–
There are no bad samples. 90% ( 280 / 288 ) of samples are categorized with severity level OK.
•
–
There are no bad samples. Samples are categorized with severity level OK.
•
–
–
There is a bad sample average of 28% ( 80 / 288 ) with severity level Major. This device is considered bad since the bad sample average is more than 20%.
•
–
There are no bad samples. Samples are categorized with severity level OK.
•
–
There are no bad samples. Samples are categorized with severity level OK.
Figure 5-1 shows the bar graph with four devices having good utilization with severity level OK (green color). Since Device 3 has a bad sample average of 28%, the November 7 bar graph displays one device having high utilization with severity level Major (red color).
The total and bad sample averages are shown as line graphs. The right y-axis represents utilization. The black line denotes total average of samples. The blue line denotes total average of bad samples.
Utilization Calculation Example 2
This example shows how utilization is calculated each hour. Calculation is based on the average samples collected each hour.
Performance Study Setup
•
•
•
•
•
•
Threshold Percentages:
•
•
•
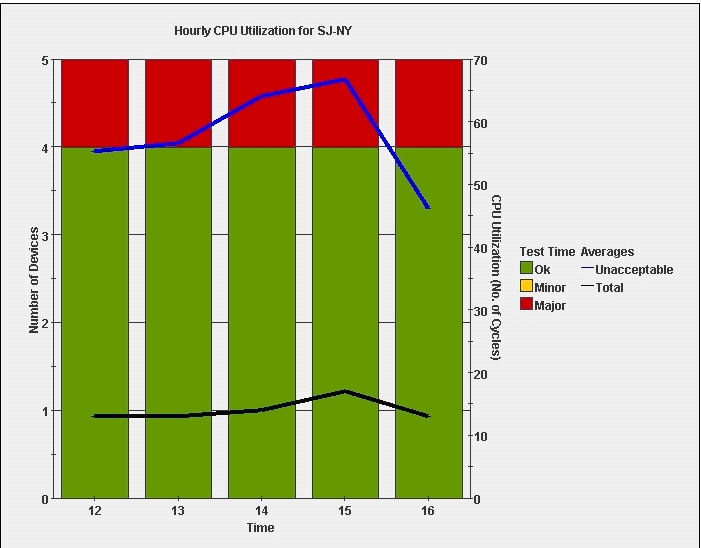
The report displays the graph shown in Figure 5-2
Figure 5-2 ABC-XYZ Hourly CPU Utilization
On November 6, Device 1 had a bad sample average value of 55% for hours 12 and 13. All other devices for hours 12 and 13 had good samples. On the graph, the red color for hours 12 and 13 represent Major utilization for Device 1. The blue line represents the bad sample average (55%).
Device 2 had good samples on November 6, but had bad samples on November 7 for hours 14, 15, and 16. Since at least one device (Device 1 or Device 2) had bad samples across all hours, the graph shows one device in red with major utilization.
The table following the graph displays the devices that experienced major utilization per hour information including violated thresholds, maximum values, and corresponding timestamps.
Compliance Analysis Report
This report analyzes device compliance (according to device network best practices), recommends types of Cisco TelePresence devices, and displays recommendations based on the answers you gave in the questionnaire.
Device compliance is calculated using the highest severity of a rule that the device does not comply with.
Note
For example, if Device 1 does not comply with Rule 1: STP Convergence (Informational) and Rule 8: Check QOS (Critical), the device is shown as noncompliant and assigned a severity level of Critical (bar will be red). See the following example ( Figure 5-3):
Figure 5-3 Device Compliance Summary Example
New York
2
0 - Compliant 2 - Noncompliant
0 - NotApplied
San Jose
3
0 - Compliant 1 - Noncompliant
0 - NotApplied
Traffic Simulation Report
This report analyzes Cisco TelePresence traffic in your existing network. Video and audio traffic analysis is based on reports for each network path from traffic analysis agents deployed at strategic locations in your network .
Figure 5-4 is an example of a traffic simulation graph displaying daily video jitter results.
Figure 5-4 Traffic Simulation Graph for Daily Video Jitter
Performance Study Setup
Test name: test 1
Length of study: 2 days
Calculations are similar to those described in the Performance Utilization Report. The bar represents the traffic time. If the sample violates the threshold, the 30 second traffic time is marked as bad and the severity is dependant on the average violated sample value.The line graphs represent the total average and bad average value.
Note
In this example, jitter has the following time thresholds:
•
•
•
Note
![]()
![]()
![]()
![]()
![]()
![]()
![]()
![]()
Posted: Thu Jan 24 20:22:37 PST 2008
All contents are Copyright © 1992--2008 Cisco Systems, Inc. All rights reserved.
Important Notices and Privacy Statement.