|
|

Table Of Contents
Starting the Service Level View
Understanding the Layout of the Service Level View
Using the Physical Connectivity View
Starting the Physical Connectivity View
Launching Cisco netManager Tools
Launching Administration Pages for Devices
Connecting to the Device Using Web Launch
Using Topology Views
There are two types of topology views available in Cisco netManager: the Service Level View and the Physical Connectivity View.
Note
The Service Level View is available only if you have purchased a license that monitors IP communication devices.
The following topics describe these views:
•
•
•
Using the Service Level View
Note
Cisco netManager's Service Level View displays a logical topology view of your Cisco IP communications network. You can access the Service Level View from your HomeSpace workspace or from Go > Views > Service Level.
The Service Level View shows all the Cisco Unified Communications Manager clusters; all instances of Cisco Unified Communications Manager Express; associated gateways and application servers. The Service Level View is designed so that you can set it up and leave it running, providing an ongoing monitoring tool that signals you when something needs attention.
Note
You can use the Service Level View to:
•
•
•
•
Starting the Service Level View
To start the Service Level View, select Go > Views > Service Level View.
Understanding the Layout of the Service Level View
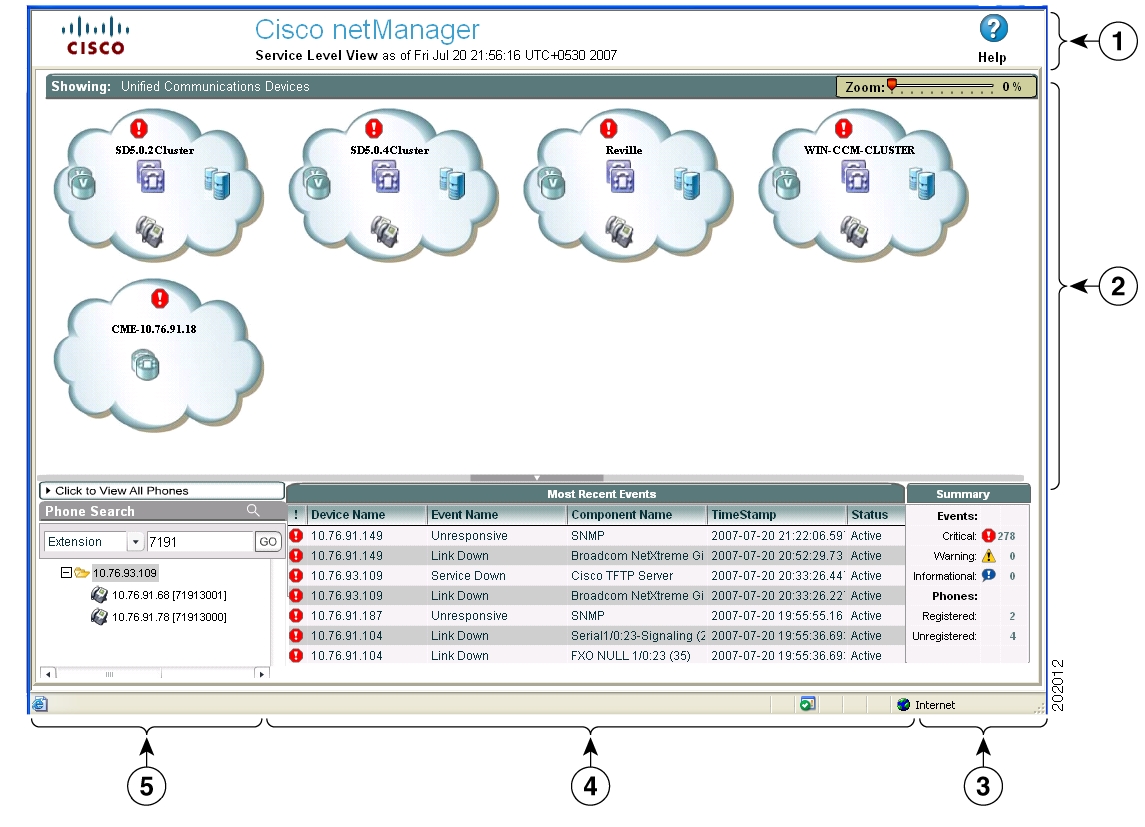
Figure 17-1 shows an example of the Service Level View.
Figure 17-1 Service Level View
Launch Information and View Status Bar Area.The launch information area shows the time on the server when the Service Level View was started. The view status bar lists the selected view, which is shown in the map display pane.
Most Recent Events Pane. This displays real-time active monitoring and displays the top 7 critical events sorted by severity and time the event occurred (including those devices not represented in the map). You can sort these events by clicking the column name.
Map Display Pane—The map display pane shows a map-based view. For details on working with the map display pane, see The Map Display Pane.
Phones Pane—The phones pane allows you to locate a phone or view a phone's reports.
Summary Pane—Displays the total number of critical, warning and informational events. It also displays the number of registered and unregistered phones.
The Phones Pane
In the phones pane, you can search for a specific phone endpoint and view the phones report. For more information, see the following topics:
•
•
Using the Search Tool to Locate a Phone
When you click on a phone from the phone endpoint search results, the map display pane displays a drilled-down view, with the phone highlighted. The phone will have a logical link to the Cisco Unified Communications Manager to which it is registered.
Step 1
Step 2
Step 3
Launching a Phone Report from the Service Level View
Step 1
•
•
The Map Display Pane
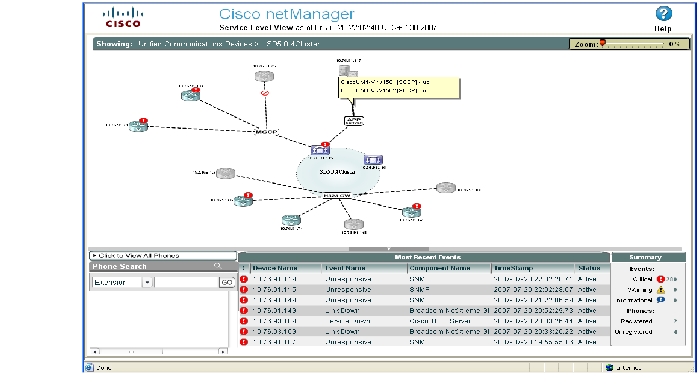
The map display pane shows the registration status of IP telephony devices. This information is displayed in a map-based view. You can drill down to devices in the display pane by clicking the cluster cloud. To get back to the cluster cloud view, click on the Unified Communications Devices link (located just at the bottom of the View Status Bar Area).
Drilling down on these clouds show the individual devices with relevant information. This gives you a quick snapshot of the overall health of your IP communications network.You can easily locate devices and links that may cause problems and view the underlying infrastructure of your IP communications network.You can view link/port status and device information by moving your cursor over any link or device icon. For more information on device icons and links, see Topology Views Legend. In general, the color of the icons represent the following:
•
•
•
Note
Figure 17-2 Map Display of Service Level View
For example, in Figure 17-2, the following Service Level View information is displayed:
•
•
•
•
•
•
•
•
•
•
Note
Note
Using the Physical Connectivity View
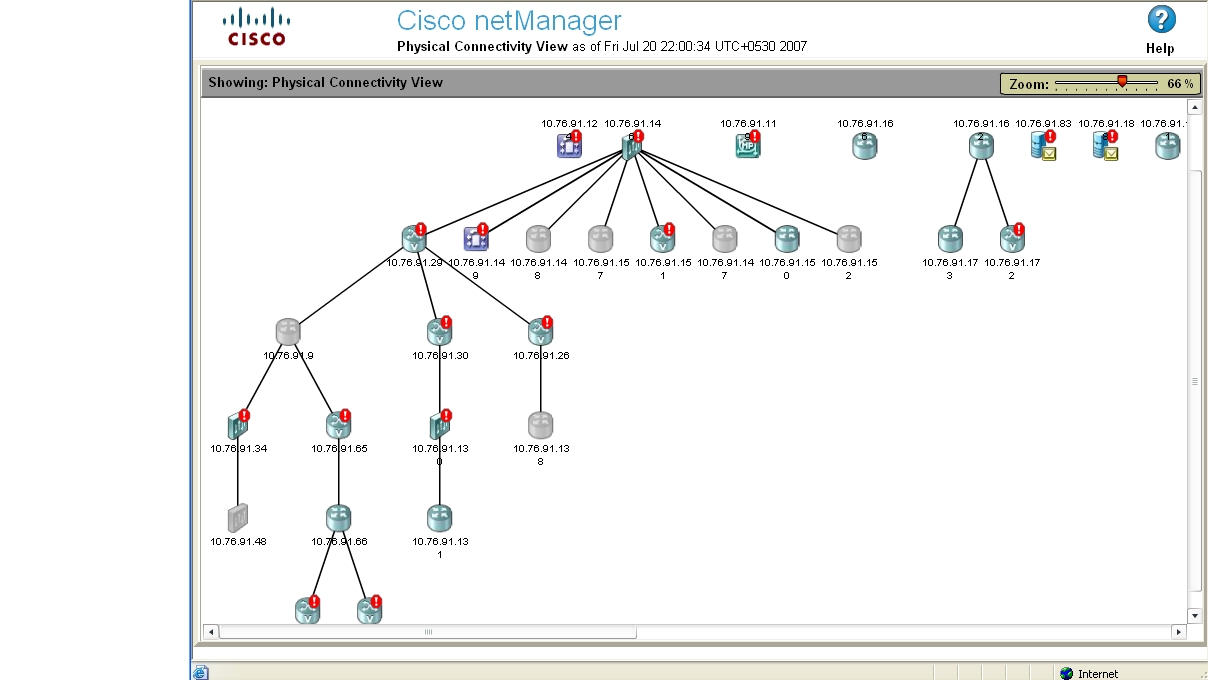
The physical connectivity view gives you a visual representation of all physical devices and connections in your network. This view gives a quick snapshot of your entire network including its overall health. From the physical connectivity view, you can easily see which devices and connections are down.
Note
•
You can view link/port status and device information by moving your cursor over any link or device icon. For more information on device icons and links, see Topology Views Legend. In general, the color of the icons represent the following:
•
•
•
•
Note
From within the physical connectivity view, you can also launch several Cisco netManager tools, external applications, and device administration pages. To access these tools and applications, right-click on an object in the view and the available options are displayed in a menu box. For more information, see "Launching Network Tools" section.
Figure 17-3 shows an example of the Physical Connectivity View.
Figure 17-3 Physical Connectivity View
Starting the Physical Connectivity View
To start the Physical Connectivity View, select Go > Views > Physical Connectivity View.
Topology Views Legend
Table 17-1 and Table 17-2 describe the icons and the link status that can appear in the both topology views.
Note
Launching Cisco netManager Tools
You can access several Cisco netManager tools as well as external applications through both topology views.
Note
You can do the following:
•
•
•
•
•
•
Viewing Events Information
Step 1
Step 2
Viewing Device Information
Step 1
Step 2
Step 3
Viewing Phones Report
You can view an associated phones report. If you are viewing an associated phones report for a switch, the report displays the phones that are connected to the switch. If you are viewing an associated phones report for a Cisco Unified CallManager or Cisco Unified CallManager Express, the report displays all the phones connected to the Cisco Unified CallManager or Cisco Unified CallManager Express, registered or unregistered.
Step 1
Step 2
The Phones report for the selected device appears.
Launching Administration Pages for Devices
Some devices will allow you to launch its administration page. The availability of these pages depends on the device type. For example, Cisco Unified CallManager and Cisco Unity devices provide access to their administration pages.
Step 1
Step 2
The following list shows the possible options (depending on the device):
•
•
•
•
•
•
The administration page opens.
Connecting to the Device Using Web Launch
Step 1
Step 2
Step 3
Launching Network Tools
Each view provides you with launching points for network tools that help you check on the connectivity of network devices. From the Service Level view you can launch the following external applications:
Note
Using the Ping Tool
This tool sends out an ICMP (Internet Control Message Protocol) echo request to the network device identified in the Address/Host name field. The results of this request appears on the right side of the page after the request has been made.
Step 1
Step 2
Address/Host name. The target of the Ping echo request. Enter the host name or IP address of the device you want to check.
Timeout. Enter the amount of time (in milliseconds) for the tool to wait on a response from the device. The Ping fails if this time limit is exceeded.
Count. Enter the number of data packets sent by the Ping tool.
Packet size. Enter the size (in bytes) of the packets you want the Ping tool to send. 32 bytes is the default.
Results.This is an explanation of the results of the tests:
•
•
•
Using the Lookup Tool
Lookup is a debugging tool that lets you query your Internet domain name system (DNS) server for information about a domain and its registered hosts. Lookup can show you what happens when an application on your network uses your DNS server to find the address of a remote host.
Step 1
Step 2
Address/Host name. Enter the host name or IP address of the device you want to trace the route to.
Lookup Type. Select the lookup type from the drop-down list.
A. Look up the host's Internet address from the hostname.
PTR. Look up the hostname from the Internet address.
Using the Trace Route Tool
This tool sends out echo requests to a specific device, then traces the path it takes to get to that IP address or host name. This is useful in finding out where on your network an interruption occurs.
Step 1
Step 2
Address/Host name. Enter the host name or IP address of the device you want to trace the route to.
Timeout. Enter the amount of time (in milliseconds) for the tool to wait on a response from the device. The Trace Route fails if this time limit is exceeded.
Max hops. Enter the maximum number of hops you want to limit the route to. It is generally felt that 32 hops should be enough to find any device on the internet.
Result. Success or Failure. This is the general result of each hop in the Trace Route process.
RTT #1/#2/#3. The tool sends out three ping requests to each hop in the route to the device. These columns show the round trip time for each of the requests.
Address. The IP address of each device encountered on the path.
Host name. The host name of each device encountered on the path.
Using the Telnet Tool
Step 1
Step 2
![]()
![]()
![]()
![]()
![]()
![]()
![]()
![]()
Posted: Fri Dec 21 14:13:04 PST 2007
All contents are Copyright © 1992--2007 Cisco Systems, Inc. All rights reserved.
Important Notices and Privacy Statement.