|
|

Table Of Contents
Solaris Installation Instructions
Linux Installation Instructions
Starting and Stopping the Application
Reinitialize Address Management Database
Export Address Management Database
Import Address Management Database
Route Monitoring Configuration
Downloading Router Configurations
Validate Router Configurations
Displaying a Router's Configuration
Validating a Single Router Configuration
Displaying a Router's RP Mappings
Application Maintenance and Troubleshooting
System Requirements
Operating Systems:
•
Solaris 8
•
•
Minimum Recommended Systems:
Sun Fire V100•
•
•
•
Sun Fire V210•
•
•
•
Sun Fire 280R•
•
•
•
Note
Intel PIII 1GHz (running RHEL AS 4)•
•
Note
<INSTALLDIR>/mmtsys/sys/events.log
<INSTALLDIR>/mmtsys/sys/rmspolld.log
<INSTALLDIR>/httpd_perl/logs/error_log
Solaris Installation Instructions
Cisco Multicast Manager
Copyright (c) 2003-2004 Cisco Systems, Inc. All Rights Reserved.
Installation
Solaris 2.8
Solaris 2.9
This must be done as root.
The application currently has to be installed in /opt/RMSMMT and requires
approximately 300MB of disk space.
If there isn't enough room in /opt create the RMSMMT directory on another
partition then create a symbolic link to it from /opt.
e.g.,
# mkdir /space/RMSMMT
# cd /opt
# ln -s /space/RMSMMT RMSMMT
# chown -h mmtuser:mmtuser RMSMMT
Note
# cd /spaceand issue the following command:# chown -R mmtuser:mmtuser RMSMMTOtherwise, the installation will take care of creating the directory and
setting the ownership for you.
If installing from CDROM:
# cd /cdrom/cdrom0
# ./setup.sh
If for some reason vold is not running you will have to manually mount the cdrom:
# mount -rt hsfs /dev/sr0 /cdrom
or
# mount -rt hsfs /dev/dsk/c0t6d0s2 /cdrom
If installing from the tar file create a tmp directory and place the tar file
there.
# cd /tmp
# mkdir rms
# cd rms
# gunzip -c mmt-sol-2.1-X-full.tar.gz | tar xvf -
# ./setup.sh
You should then be able to start and stop the server with:
/opt/RMSMMT/S98mmt
and
/opt/RMSMMT/K98mmt
The default login is admin/rmsmmt
Note
The S98mmt script will only start the apache server. You will have to manually start
the polling daemon through the application if desired.
During installation the K98mmt script is installed in the /etc/rc0.d directory.
This will ensure that the polling daemon shuts down properly upon system reboot.
The server is configured by default to run on port 8080. If you want to change it
just edit the /opt/RMSMMT/httpd_perl/conf/httpd.conf file.
#=====[ Sample Installation ]=====#root@ganymede/export/home/mike/mmtinstall-> ./setup.shInstalling Cisco Multicast Manager Version 2.1Copyright (c) 2003-2004 Cisco Systems, Inc. All Rights Reserved.The application installs in /opt/RMSMMT. Do you wish to continue? [y/n]: yCreating mmtuser gid...Creating mmtuser uid...Locking mmtuser account...Installing Apache...Installing Perl...Installing MIBS...Installing support files...Installing K98mmt to /etc/rc0.d to ensure proper shutdown of application...Would you like the S98mmt script installed in /etc/rc3.d to start the application upon system boot? [y/n]: ySeeding IP Address database with reserved Multicast Addresses...Modifying httpd.conf file for this system...Installation Finished.Linux Installation Instructions
Cisco Multicast Manager
Copyright (c) 2003-2004 Cisco Systems, Inc. All Rights Reserved.
Installation
Red Hat Enterprise Linux AS Release 3 (Taroon Update 4)
This must be done as root.
The application currently has to be installed in /usr/local/netman and requires
approximately 300MB of disk space.
If there isn't enough room in /usr/local create the netman directory on another
partition then create a symbolic link to it from /usr/local.
e.g.,# mkdir /space/netman# cd /usr/local# ln -s /space/netman netman# chown -h mmtuser:mmtuser netmanIf you symbolically link /usr/local/netman to the actual installation directory as
shown above, then when the installation is complete you MUST cd to the
actual installation directory: in this example
# cd /spaceand issue the following command:# chown -R mmtuser:mmtuser netmanOtherwise, the installation will take care of creating the directory and
setting the ownership for you.
If installing from CDROM:
# cd /mnt/cdrom
# ./setup.sh
If installing from the tar file create a tmp directory and place the tar file
there.
# cd /tmp
# mkdir rms
# cd rms
# gunzip -c mmt-linux-2.1-X-full.tar.gz | tar xvf -
# ./setup.sh
You should then be able to start and stop the server with:
/usr/local/netman/S98mmt
and
/usr/local/netman/K98mmt
The default login is admin/rmsmmt
Note
The S98mmt script will only start the apache server. You will have to manually start
the polling daemon through the application if desired.
During installation the K98mmt script is installed in the /etc/rc0.d directory.
This will ensure that the polling daemon shuts down properly upon system reboot.
The server is configured by default to run on port 8080. If you want to change it
just edit the /usr/local/netman/httpd_perl/conf/httpd.conf file.
#=====[ Sample Installation ]=====#root@ganymede/export/home/mike/mmtinstall-> ./setup.shInstalling Cisco Multicast Manager Version 2.3Copyright (c) 2003-2004 Cisco Systems, Inc. All Rights Reserved.The application installs in /usr/local/netman. Do you wish to continue? [y/n]: yCreating mmtuser gid...Creating mmtuser uid...Locking mmtuser account...Installing Apache...Installing Perl...Installing MIBS...Installing support files...Installing K98mmt to /etc/rc0.d to ensure proper shutdown of application...Would you like the S98mmt script installed in /etc/rc3.d to start the application upon system boot? [y/n]: ySeeding IP Address database with reserved Multicast Addresses...Modifying httpd.conf file for this system...Installation Finished.Licensing
Version 2.3 of the Cisco Multicast Managerl requires a license file. The base license is for CMM. The license for the Cisco Route Manager (CRM) must be purchased separately. The application licenses are contained in the license.key file. This file should be placed in the /opt/RMSMMT/mmtsys/sys directory on Solaris, and in the /usr/local/netman/mmtsys/sys directory on Linux. The file should be owned by mmtuser (chown mmtuser:mmtuser license.key), and be set read-only (chmod 0444 license.key). The license is tied to the IP address of the server that the application is running on.
Starting and Stopping the Application
To start the application, run the S98mmt script from the application's home directory: /opt/RMSMMT on Solaris, /usr/local/netman on Linux. To stop the application, run the K98mmt script. The S98mmt script also runs the S98mmtpolld script, which starts the polling daemon. The S98mmtpolld script can also be used as a watchdog script to ensure that the polling daemon is up and running. The root crontab configuration would be as follows:
Solaris
0,5,10,15,20,25,30,35,40,45,50,55 * * * * /opt/RMSMMT/S98mmtpolld
Linux
*/5 * * * * /usr/local/netman/S98mmtpolldThese entries will run the script every 5 minutes.
Logging Into CMM
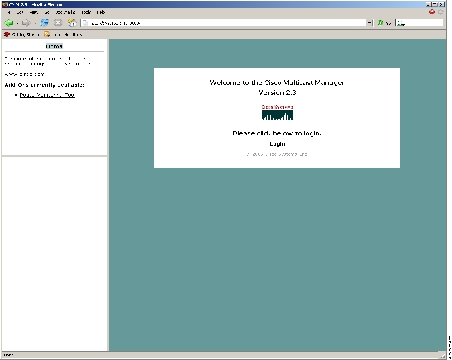
To access the application enter the IP address or the name of the server where the software is installed. For example: http://192.168.1.9:8080. The default port of 8080 can be changed as described in the installation instructions.
The default login for the application is admin/rmsmmt. The username and password can be entered after clicking "Login".
Figure 1-1
Initial Configuration
Before using the Cisco Multicast Manager (CMM), several options need to be configured, e.g., SNMP community strings.
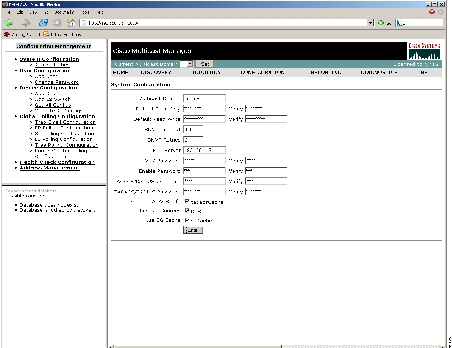
To get started click on "CONFIGURATION" and from the drop down menu or the left frame select "System Configuration".
Figure 1-2
Multicast Domain - A multicast domain, for management purposes, is defined here as a contiguous group of PIM neighbors sharing the same SNMP community string.
To delete an existing domain go to "Admin Utilities".Read Only - SNMP RO community string.
Read Write - SNMP RW community string. This is required for retrieving and validating device configurations.
SNMP Timeout and SNMP Retries - The default values are 0.8 and 2 respectively.
VTY Password - The VTY password is required if you want to issue show commands from the application. Certain features e.g., querying Layer 2 switches, also require this. If TACACS is being used, then a username and password can be supplied instead of the VTY password.
Enable Password - Not currently used.
TACACS/RADIUS Username and Password - If you are using TACACS/RADIUS then you can enter a username and password here. See VTY Password above.
Note
Cache TACACS Info - If this box is checked the application will cache the TACACS username and password until the browser is closed. This eliminates having to enter it each time you issue a router command from the application.
Resolve Sources - Performs DNS lookups on all sources found. The DNS name will then be displayed alongside the IP address on the "Show All Groups" screen. If the server is not configured for DNS then DO NOT check the box. If the box is checked you may receiver a slower response due to the fact that the application is trying to resolve names. This option is not recommended when the network contains a large number of S,Gs.
SG Cache - Some networks contain thousands of S,Gs. During discovery, the application will cache all the S,Gs found in the RPs. If this box is checked, the application will read the SG cache when displaying lists of sources and groups rather then retrieving them again from the RPs in the network. The cache is automatically refreshed if RPs are being polled as described later in this document. The cache can also be refreshed manually by clicking the "Refresh Cache" button on the "Show All Groups" screen. It is highly recommended to use this option. If there are no RPs in the domain being discovered, then the S,G cache is created by querying all the devices that have been discovered, as would be the case in a PIM Dense-Mode network. In this case the S,G cache will only be updated when the "Refresh Cache" button is clicked as described below.
Once all the fields are filled in click "Enter" and you will be taken to the discovery screen.Discovery
The next step in using the Cisco Multicast Manager is to discover the network. The discovery process is multicast specific and will only find devices that are PIM enabled. The application will then build a database of all devices found. Discovery should be re-run whenever new devices are added to the network, or the physical topology is changed. A single router can also be added or rediscovered on the network. A router being added must have a connection to a device that already exists in the database. A router that is being rediscovered is initially removed from the database, along with any neighbors that exist in the database. The router, and its neighbors are then added back into the database. This option would be used if a change on a device has caused a change in the SNMP ifIndexes.
Note
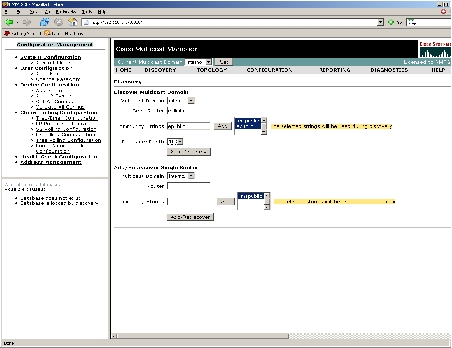
To perform a new discovery, select the domain you would like to discover from the "Multicast Domain" drop down list. Only the domains that have been configured from the "System Configuration" screen will appear here.
Enter the IP address or name of the "Seed Router", if DNS is in use. Then select a discovery depth, which will determine how many hops from the seed router the discovery will terminate. Single router discovery uses a discovery depth of 1.
Figure 1-3
Click on "Start" to begin the discovery. At this point the application will discover all routers in the network that are multicast enabled and have interfaces participating in multicast routing. If the discovery fails to find any routers or if there are routers in the network that were expected to be discovered but were not, then check the following:
•
•
•
•
•
As routers are discovered, they will be displayed in the browser window. When discovery is complete, the browser window will display the time it took to discover the network, and the number of devices discovered.
Discovery took 15 secondsDiscovered 5 routersThe amount of time the discovery takes will depend on the number of routers, number of interfaces and router types.
If the discovery seems to stop at a particular router or seems to pause, check that router's connectivity to its PIM neighbors. Also, check the PIM neighbor to see if it supports the PIM and IPMROUTE MIBs. Again, because the discovery is multicast specific, unless these MIBs are supported, the device will not be included in the database. Issuing the "sh snmp mib" command on a router will give this information.
Admin Utilities
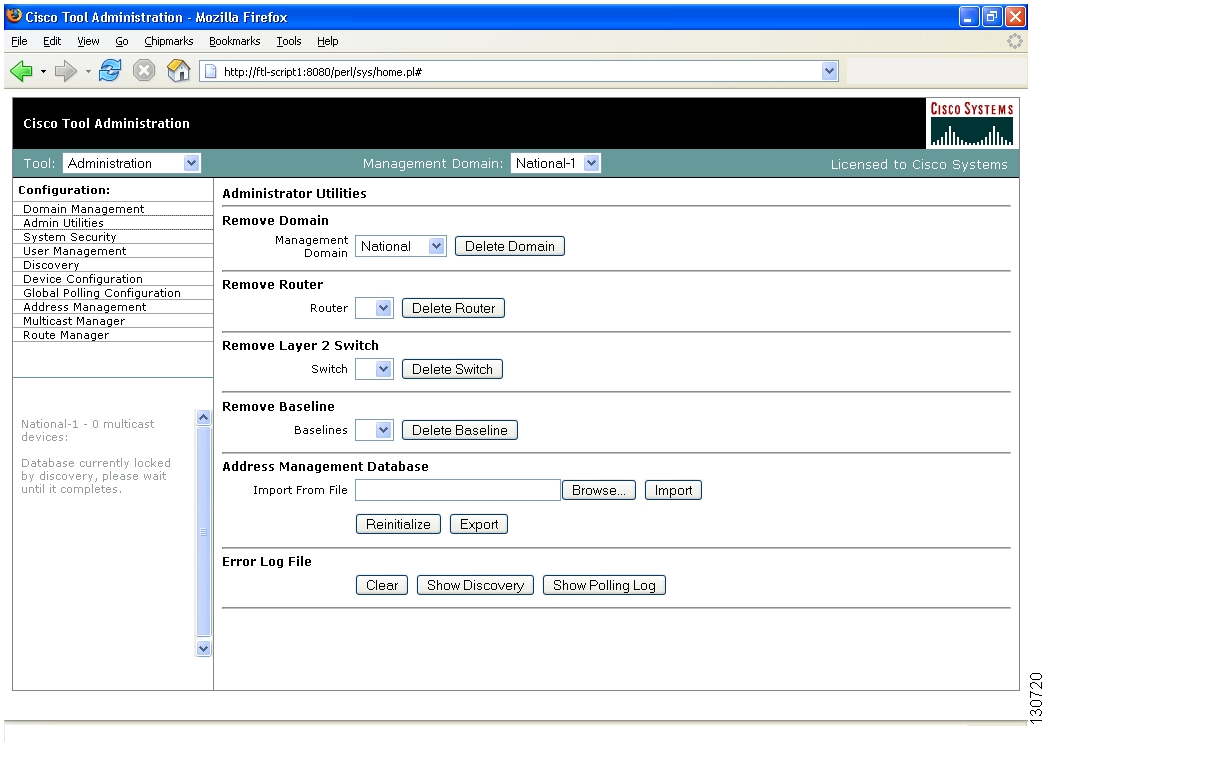
The Admin Utilities screen provides maintenance tools for the System Administrator.
Figure 1-4
Remove Domain
Removes all data associated with a multicast domain.
Note
Remove Device
Remove a specific device from a multicast domain. However, if the device is being polled, it will have to be removed from the polling configuration first.
Remove Baseline
Removes a forwarding tree baseline along with any associated tree change information.
Reinitialize Address Management Database
Clicking "Reinitialize" will restore all the reserved multicast addresses to the IP address database.
Export Address Management Database
Clicking on "Export" will create a file in /tmp called mmtIPdb.csv which will contain the IP address database in csv format.
Import Address Management Database
Import a csv file into the IP address database. The file should be in the following format:
#import file format#this line will be skipped239.1.1.1,test group192.168.1.1,sourceAError Log File
Clear - Truncates the error_log.
Note
Show Discovery - displays the discovery specific messages contained in the error_log file.
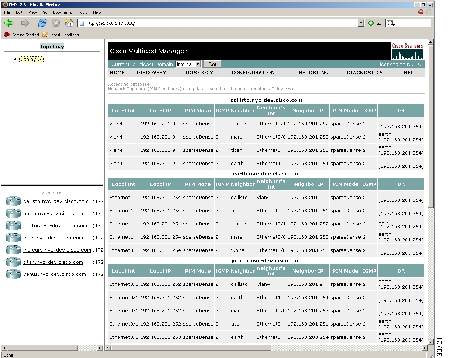
Topology
Clicking on "TOPLOGY" provides detailed multicast topology information for all routers in the current domain.
Figure 1-5
Note
"Display All" contains the following information:
•
•
•
•
•
•
•
•
•
•
•
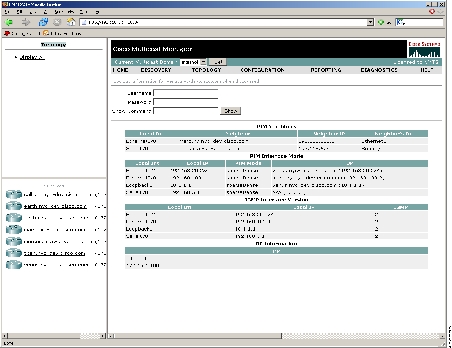
You can also access information about a certain router by clicking the router in the left frame.
Figure 1-6
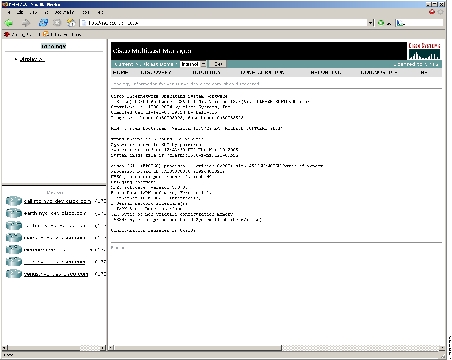
Another useful option is access to the command line interface (CLI) which allows you to use "show", "ping" and "traceroute" commands. Below is the output from a "show ver" command.
Figure 1-7
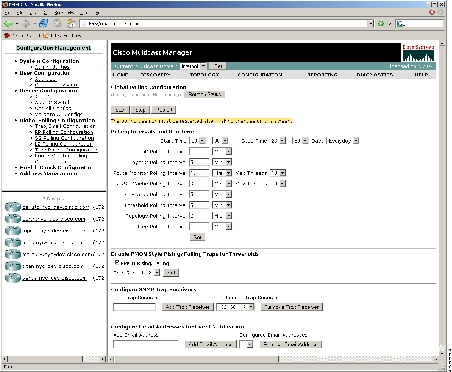
Configuration
Global Polling Configuration
The polling daemon provides proactive monitoring. After modifying any of the polling configuration screens, the polling daemon must be restarted for the changes to take effect.
Figure 1-8
The start and stop times specify when the polling daemon will run. The eight polling intervals allow for different monitoring frequencies for:
•
•
•
•
•
•
•
•
Setting anyone of these values less then 1 will disable that specific polling feature.
The status line next to the "Refresh Button" indicates how long the polling daemon has been running and how it was started. In the figure above it can be seen that the polling daemon was started by the watchdog script.
Topology polling will query the sysUpTime of each router in the multicast domain to see if it's been reloaded. If it has, the polling daemon will launch a Single Router Discovery of that device in the background. The reason for this is to ensure that the SNMP ifIndexes have not changed.
RP Status polling will query the sysUpTime of the RPs configured on the RP polling configuration screen. This query is simply done to report the availability of the RPs. If the RP responds, an rpReachable trap will be sent. If the RP does not respond, an rpUnreachable trap will be sent. Since at least one of these traps will be sent each polling interval, they can also be used to ensure that the polling daemon is up and running.
The RP/SG Cache polling and Route Monitor polling also have a "Max Threads" value associated with them. This value can be adjusted from 1 to 10 and controls how many devices are queried simultaneously. This option has been added in version 2.2 because the queries used for these two types of polling are SNMP getbulk queries, and can potentially return large amounts of data. Timeouts can be addressed by either reducing the number of max threads and/or adjusting the SNMP timeout and retry values on the "System Configuration" screen.
Note
The CMM polling daemon contains global and domain specific configuration options. The "Global Polling Configuration" screen allows you to specify:
•
•
•
•
Email addresses will be notified of SSG exceptions, and threshold and existence events. All traps specified in the CMM MIB will be sent to the SNMP trap receiver(s). The email addresses and SNMP trap receivers specified here will be used if domain specific email addresses and SNMP trap receivers are NOT specified. Domain specific email addresses and trap receivers can be configured from the "RP Polling Configuration" screen.
RMON Rising/Falling disables the continuous sending of PPS threshold traps. When this option is NOT checked, traps will be sent whenever the PPS rate for an S,G being monitored exceeds the specified thresholds. When this option is enabled, a trap will be sent only when the PPS rate initially exceeds either the high or low threshold. Once the PPS rate returns to the specified range, a normalized threshold trap will be sent. Since SNMP v1 traps are sent unreliably, a Trap-Repeat option is provided to allow the initial and normalized traps to be sent from 1-5 times when an event occurs.
RP Polling Configuration
This section allows you to add/remove the RPs to be monitored. You can also specify a Single S,G (SSG). Monitoring of the RPs includes checking for groups that have been added or removed. In the case of an SSG, the polling daemon will check to see that the group specified in the SSG entry has one and only one source sending to it.
Figure 1-9
An SNMP trap will be generated whenever a group is added or removed from an RP, or if an RP is unreachable. The rpAddition and rpDeletion traps can be disabled by un-checking "Enable RP Add/Delete Traps", and clicking "Set".
Note
Use the drop down list to select the RP or RPs you would like to monitor and then click "Monitor RP". If you would also like to monitor the number of groups on an RP, then specify a number in the "Group Limit" field. If the number of groups on an RP exceeds this value, an rpGroupThresholdExceeded trap will be sent.
If you wish to remove an RP that is currently being monitored, simply click "Delete" next to the RP in the table.
Note
Also, as stated earlier, this screen also provides for the configuration of domain specific trap receivers and email addresses.
SG Threshold Polling
This section allows you to configure the polling daemon to monitor a router for a specific S,G entry based upon high and low thresholds, or simply to see if the S,G exists on the router. If the source is specified as 0.0.0.0, the *,G is being monitored. If the threshold values are specified as -1, -1, then only the existence of the specified S,G is being checked for on the router. If threshold values are specified then there is also an option to set up to 50 time-based thresholds that will override the default value which is specified initially.
Figure 1-10
To facilitate the selection of S,Gs to be monitored, the application provides filtering by source or group. For example, select a group from the "Group" drop down list and click "Filter Sources". The "Source" drop down list will now only contain those sources that are sending to the selected group. To see the entire list again, simply click the "Reset S,G Lists" button.
Note
Once the source and group have been selected, then select a router from the "Router" drop down list.
Leaving the high and low thresholds at -1, indicates that the polling daemon will monitor the selected router for the existence of the specified S,G.
To monitor PPS for the selected S,G on this router, simply set the high and low threshold values to something other then -1.
Clicking "Add" will add this entry to the table shown above.
If the thresholds for a particular S,G are exceeded, a hiThresholdExceeded or loThresholdExceeded trap will be generated.
Note
To see the table of configured S,Gs, click "Display Configured SGs". The table can be sorted by Source, Group, or Router by clicking on the column heading. You can also filter what's displayed in the table by selecting any of the "Display Filter Options". These filter options are effective for the values shown in drop down boxes.
L2 Polling Configuration
This section allows you to configure Layer 2 switch ports to be monitored for PPS inbound and/or outbound. Only Layer 2 switches that have been manually added to the database will appear in the drop down list. There is also the option here to specify up to 50 time-based thresholds per switch port.
Figure 1-11
Begin by selecting a switch from the drop down list and clicking "Monitor Switch". This will populate the "Select Port To Monitor" drop down list. Once the direction is selected, and the high and low thresholds have been set, select the port to monitor and click "Monitor Port".
Note
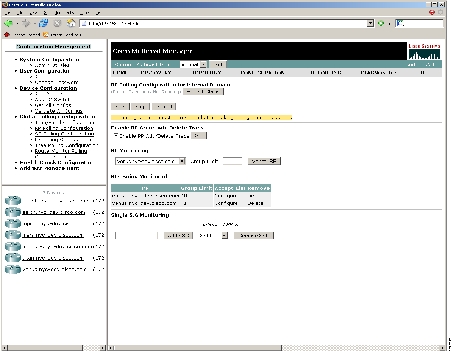
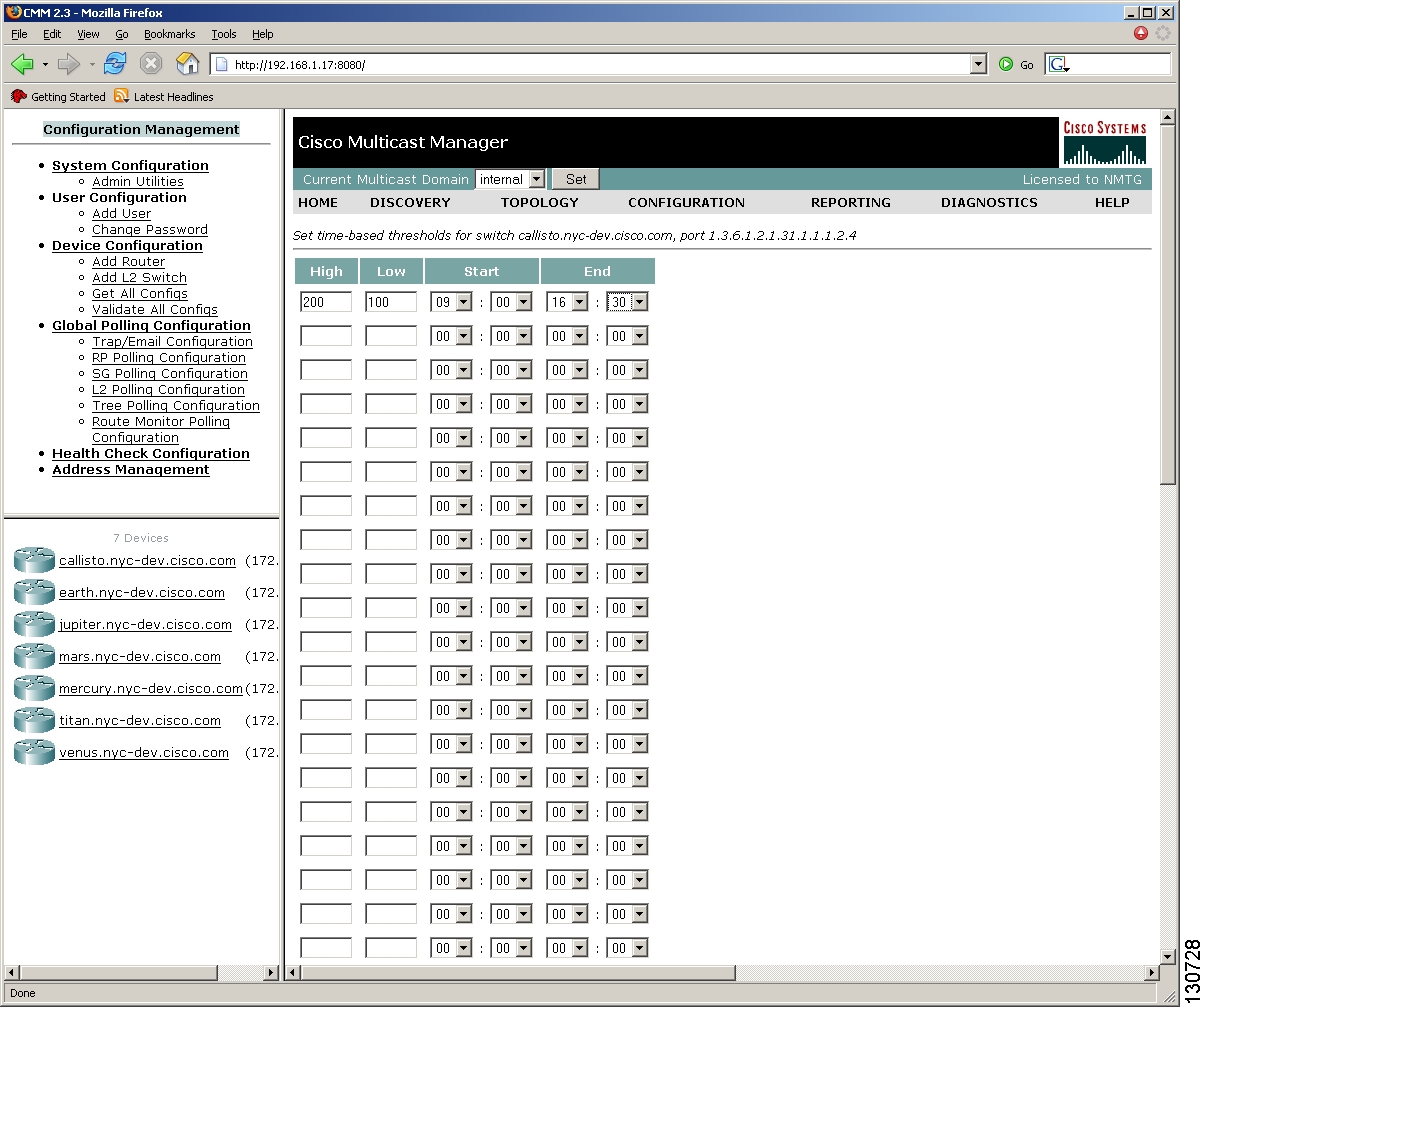
Time Based Thresholds
S,G Threshold polling and Layer 2 port monitoring allow you to configure different thresholds for different times throughout the day.
Figure 1-12
To configure time-based thresholds, click the "Time-based Thresholds" link next to the S,G or Layer 2 port entry in the table shown in Figs.9 and 10.
Up to 50 time-based thresholds can be configured for each entry. The thresholds will go into effect after the polling daemon is restarted.
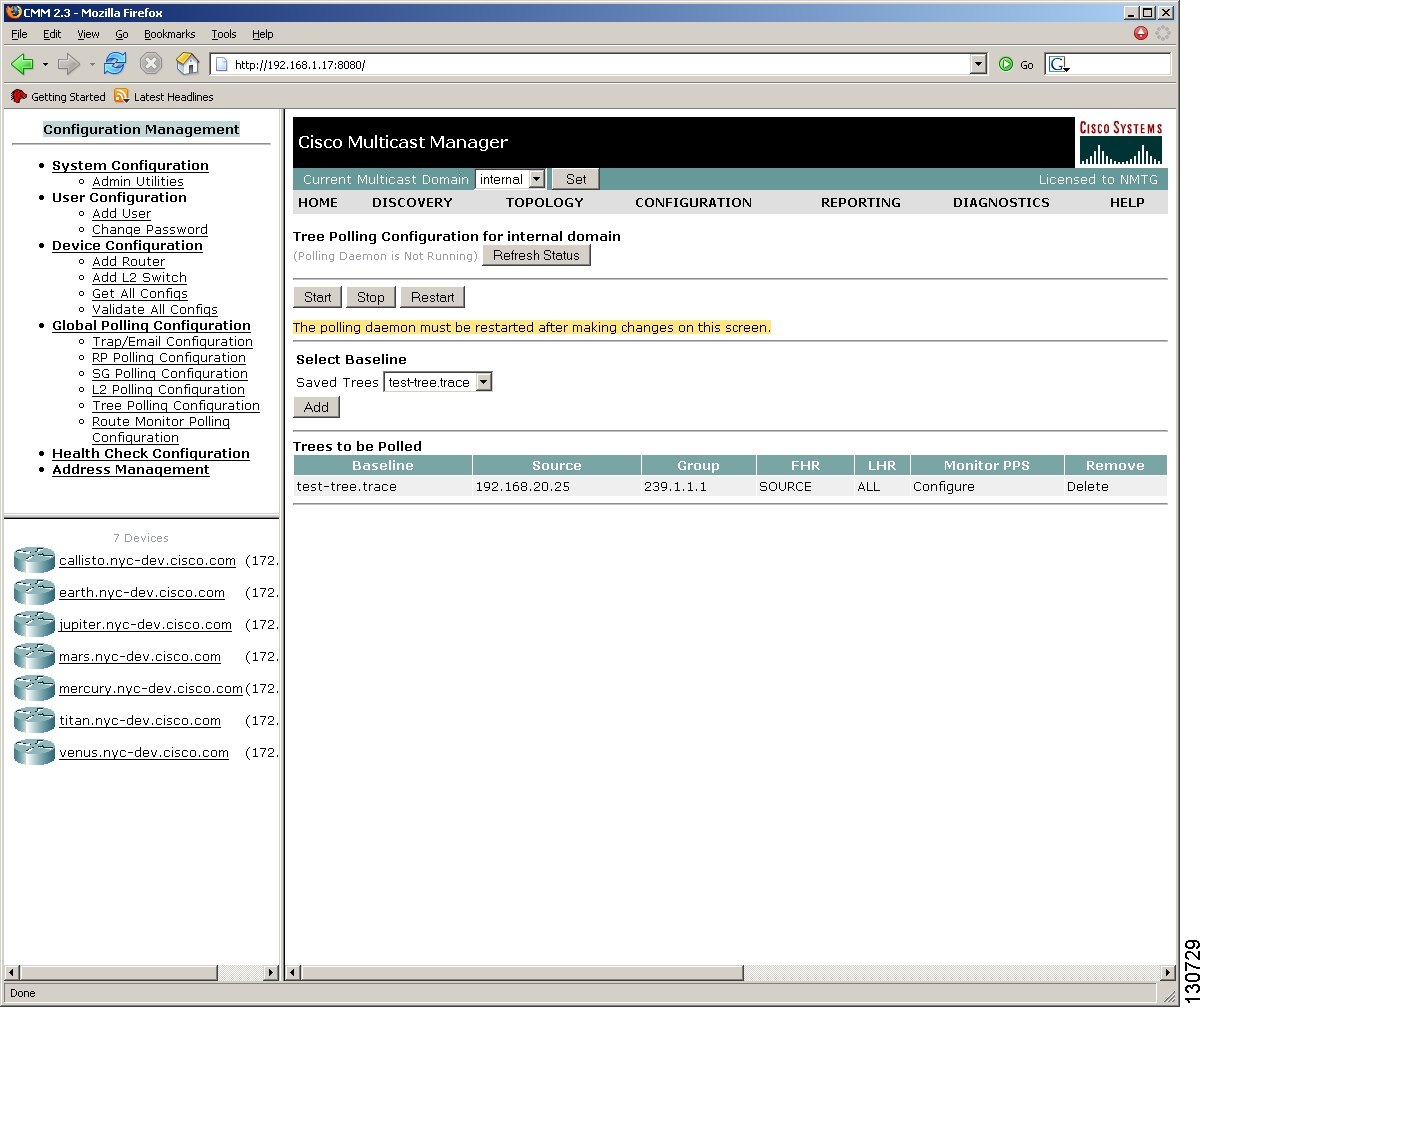
Tree Polling Configuration
The tree polling configuration screen allows multicast trees, saved as baselines to be monitored for any change in topology.
Figure 1-13
The "Saved Trees" drop down box provides a list of saved multicast trees to choose from. Simply select the desired baseline and click "Add". This baseline, which is specific for a certain S,G and FHR and LHR can now be monitored for changes. If a change is detected the application will log a trChanged event along with sending an SNMP trap. If the tree should revert to the baseline, a trReverted event will be logged, and an SNMP trap sent. These traps are only sent upon initial change, i.e., upon transition from the baseline, or back to the baseline.
As will all other polling features, the polling daemon must be restarted for any changes to go into effect.
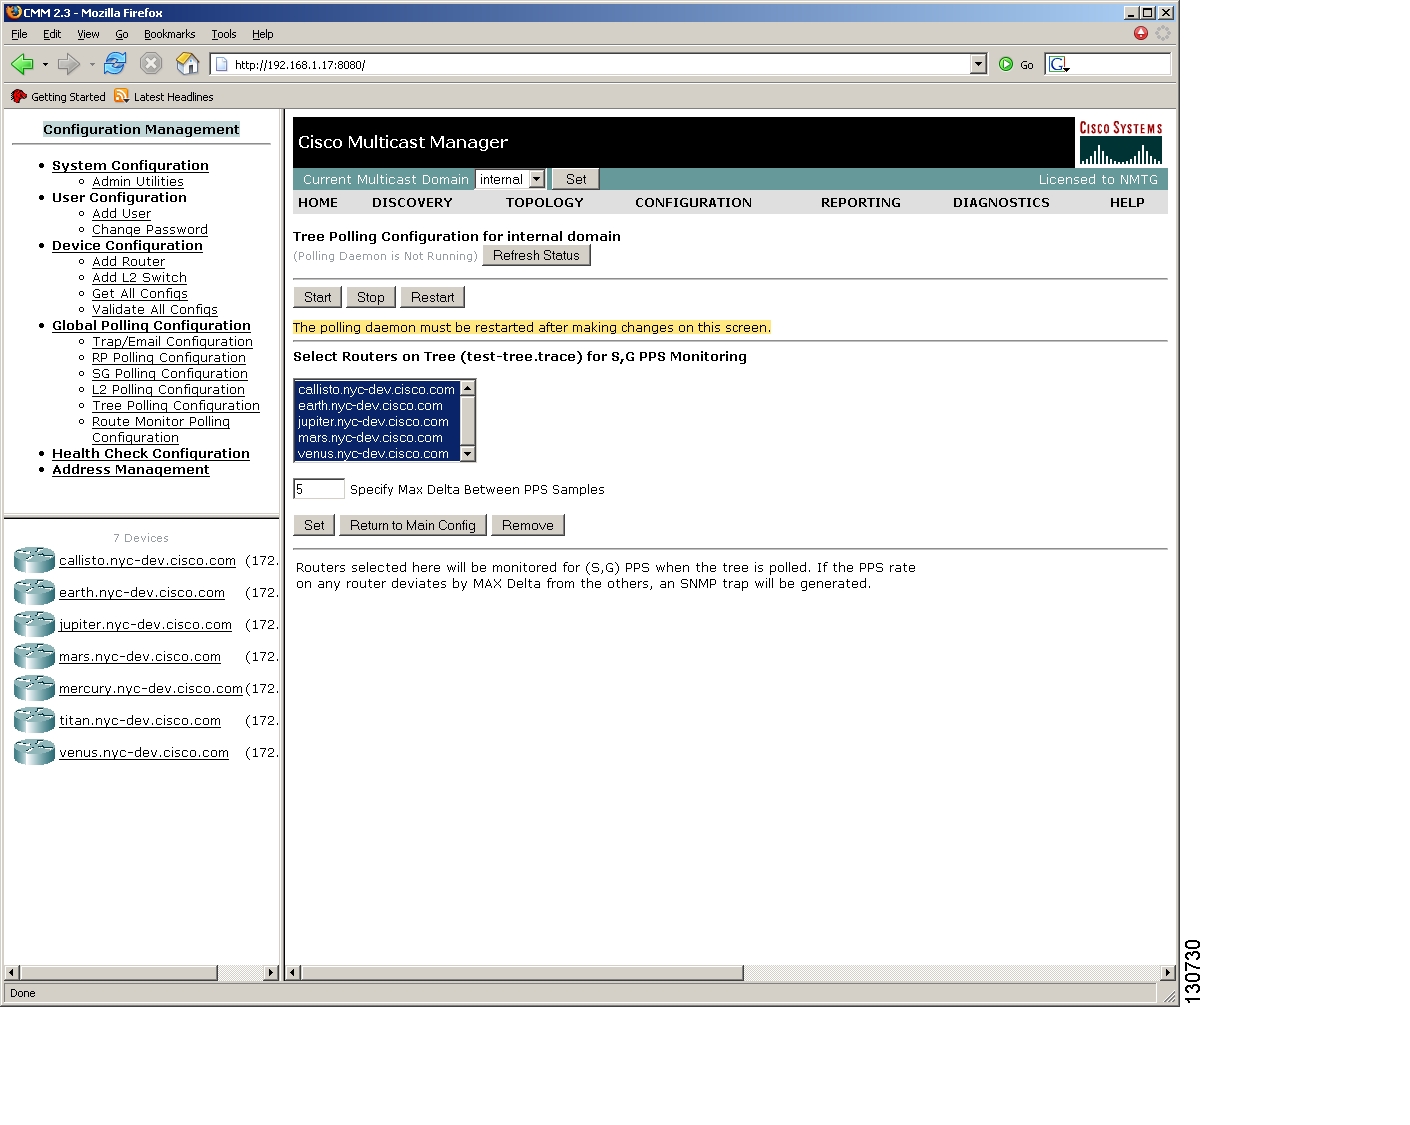
Clicking "Configure" under Monitor PPS, will display the screen shown below.
Figure 1-14
This screen shows the routers that exist on the forwarding tree for the selected baseline. Any number of routers on the tree can be selected and polled for PPS. The PPS rate obtained from each router will then be checked by the polling daemon to ensure that they're all within the specified delta - in this case 50. If the PPS rate deviates beyond 50 between any of the routers being polled, an SNMP trap will be generated and an event will be logged.
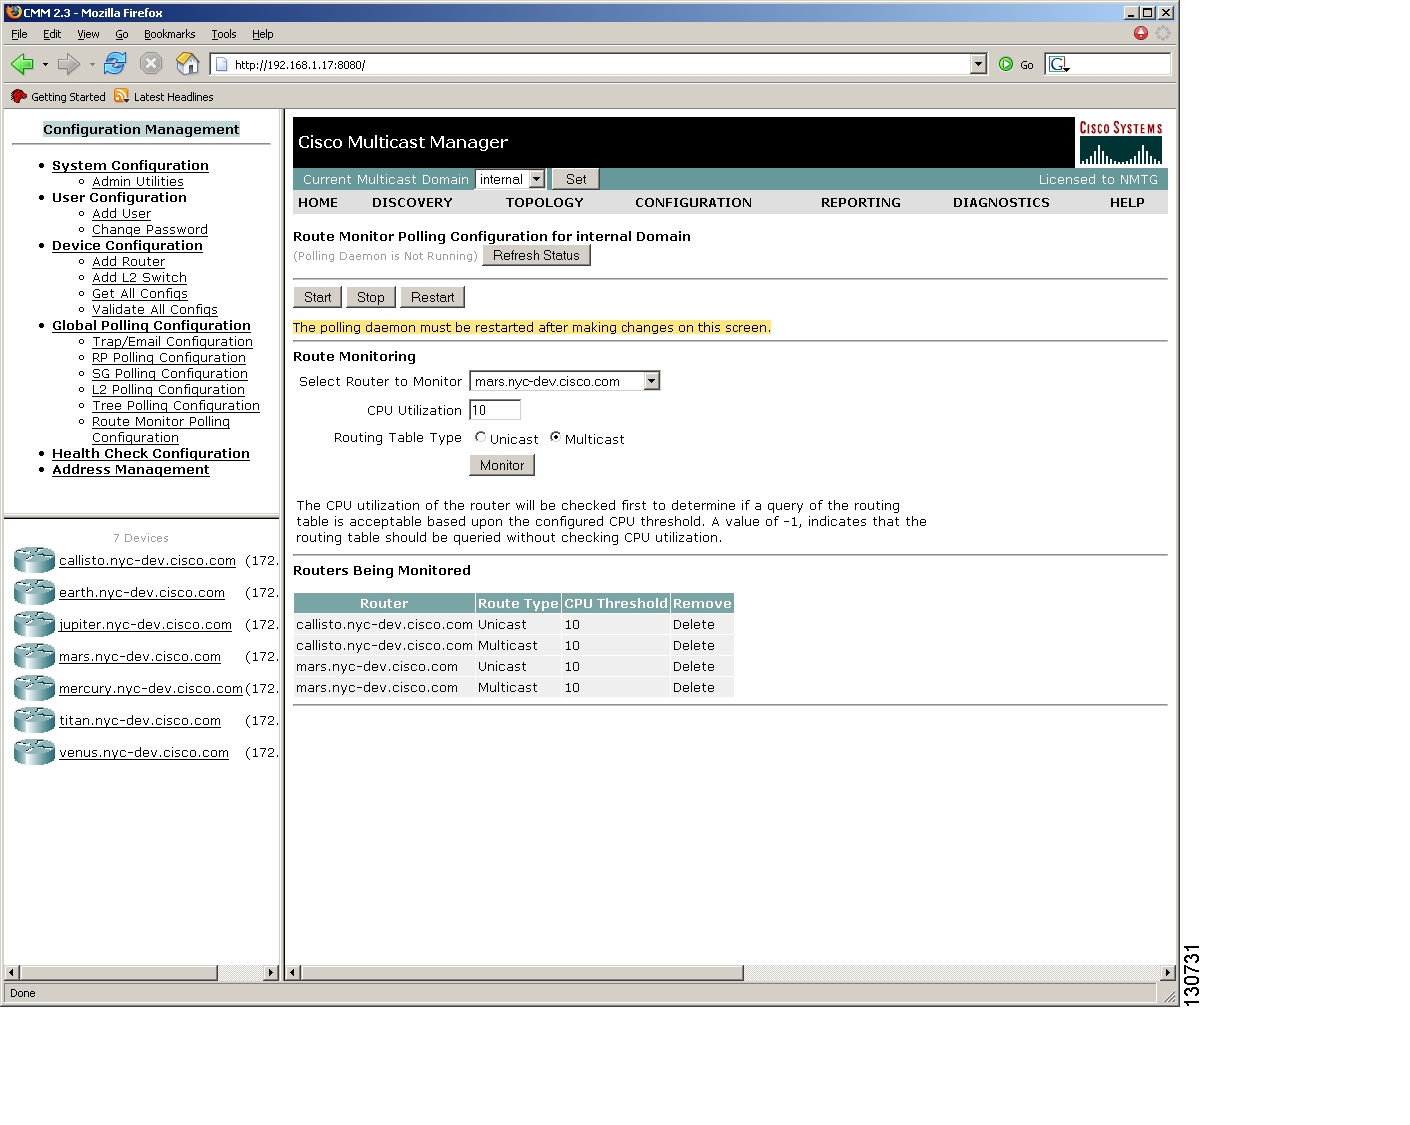
Route Monitoring Configuration
Routers configured on this screen will have their unicast and/or multicast routing tables checked for changes.
Figure 1-15
The CPU utilization of the router will be checked first to determine if a query of the routing table is acceptable based upon the configured CPU threshold. A value of -1 (the default), indicates that the routing table should be queried without checking CPU utilization. If a router is being queried for the first time, a baseline will be created in the form of routerName.unicast.db and stored in the /opt/RMSMMT/mmtsys/db/<domain> directory; for multicast it would be routerName.multicast.db. Subsequent queries will be checked against this baseline. If a change has been detected, a report will be generated and the baseline will be replaced with the current routing table.
Note
Querying the routing table via SNMP, can in certain cases cause the CPU utilization on the router to become excessively high which can potentially disrupt the network. Once recommendation stated in the
link below is to turn on CEF and use get-bulk requests.
http://www.cisco.com/en/US/tech/tk648/tk362/technologies_tech_note09186a00800948e6.shtmlCMM does use get-bulk requests when querying the routing table and provides for the adjustment of the number of routers queried simultaneously as described in the Global Polling Configuration section.
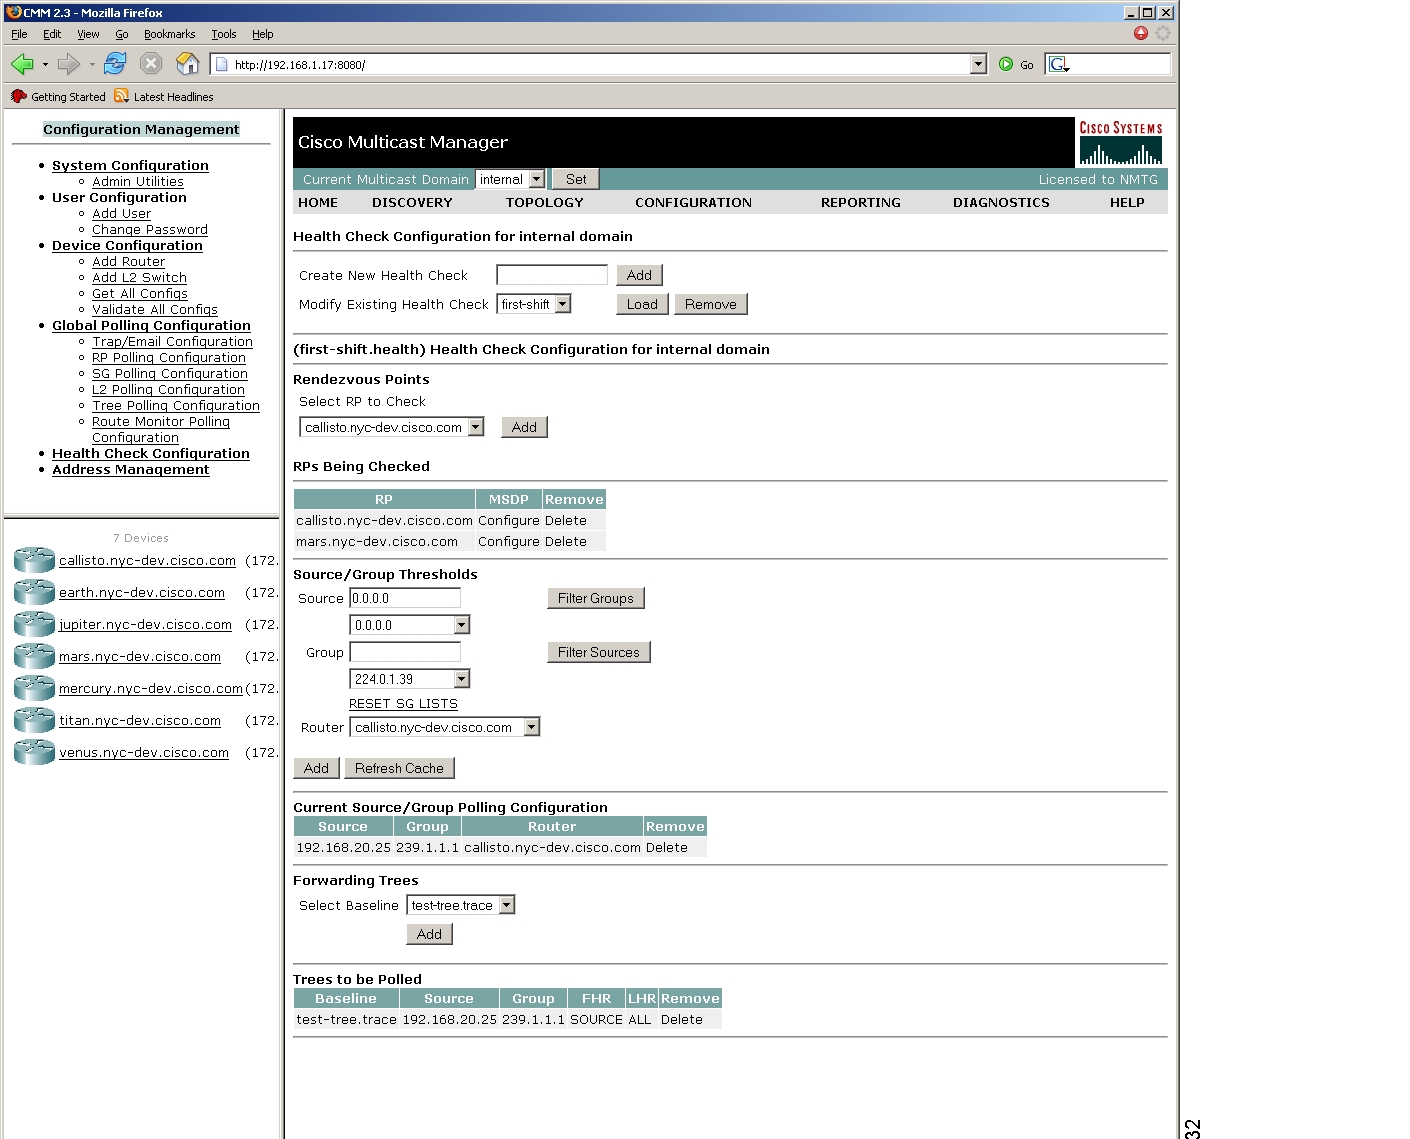
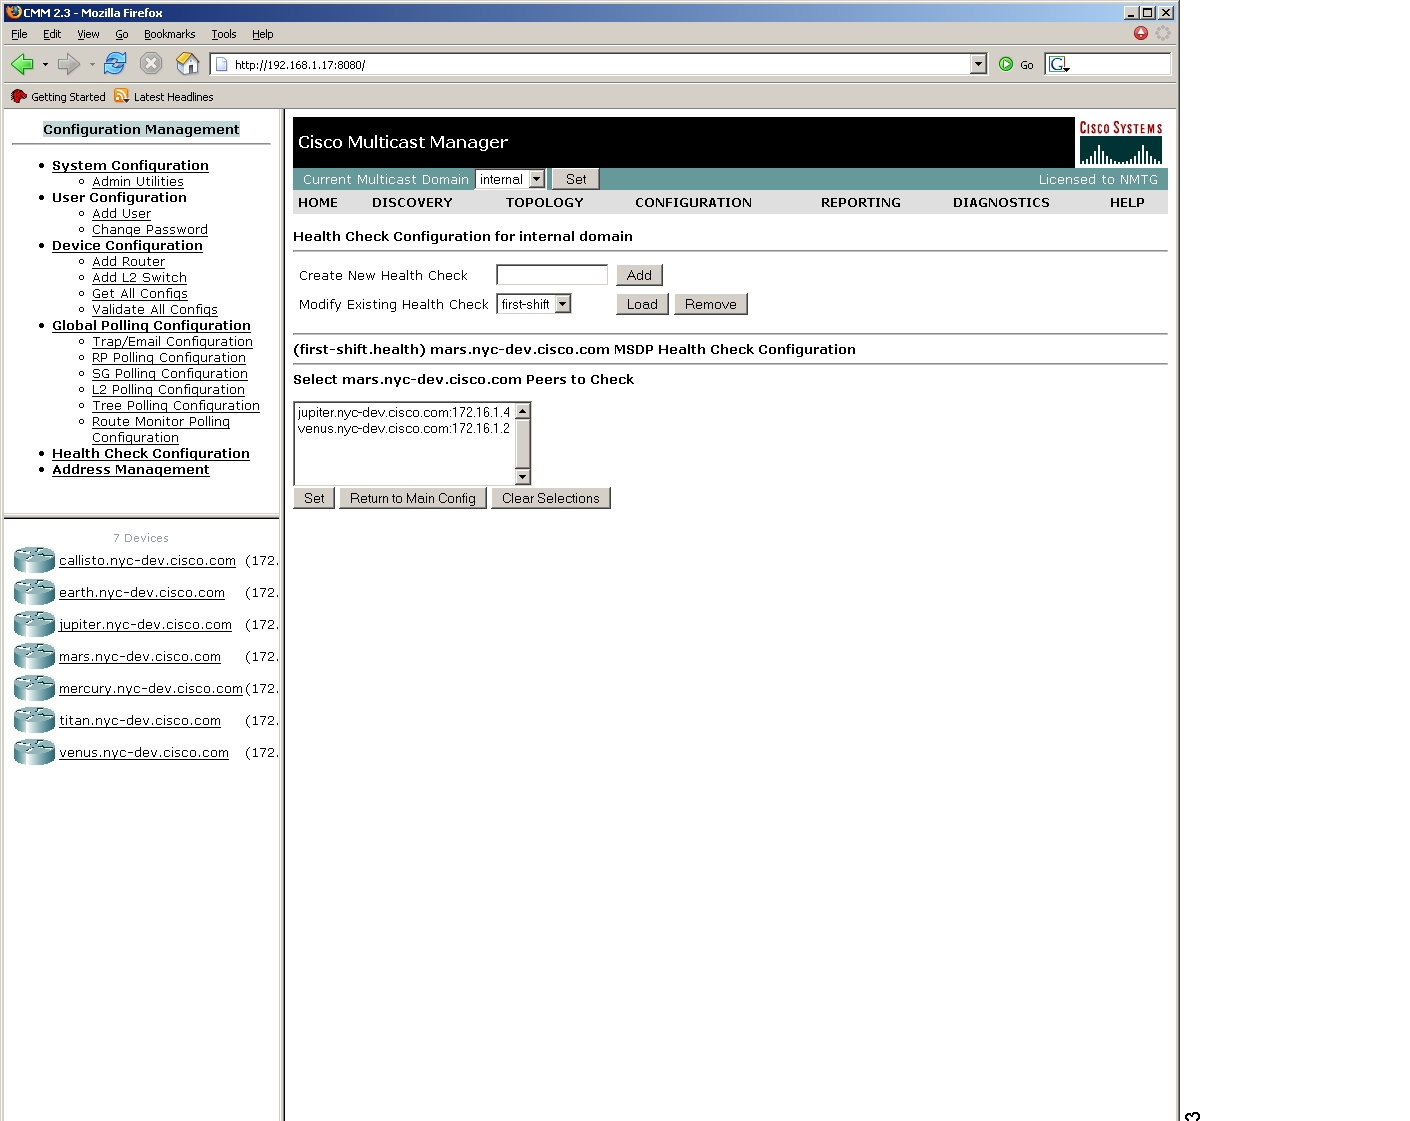
Health Check Configuration
Health checks provide a way for an operator to get an immediate status on several key multicast network indicators, including: status of selected RPs, MSDP status, existence of S,G entries on selected routers, and the status of multicast forwarding trees.
Figure 1-16
Health checks configured here are then run from the diagnostics screen. To create a new health check, simply provide a name in the "Create New Health Check" field and click "Add". To modify an existing health check, select it from the "Modify Existing Health Check" drop down list and click "Load". You can then add to or remove items from the health check. To remove an existing health check, select it from the drop down list and click "Remove". Clicking "Configure" under MSDP will display the screen shown below.
Figure 1-17
This screen allows the MSDP peers for the current RP to be selected to be checked.
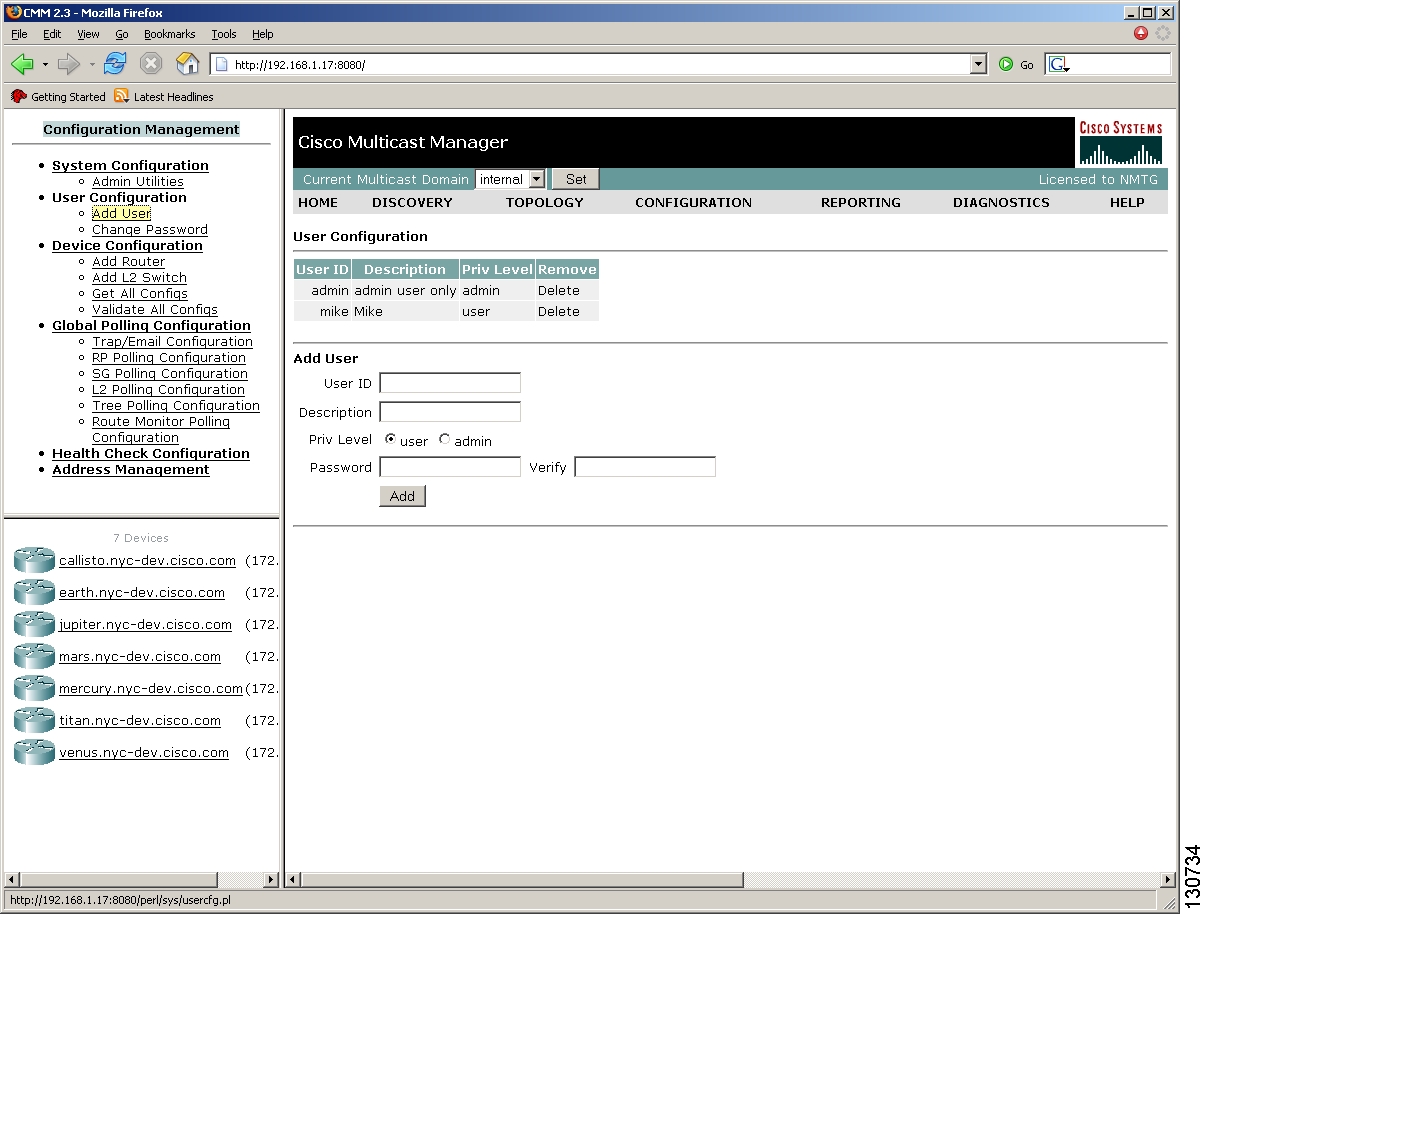
User Configuration
The application provides two privilege levels: user and admin. An administrator account is needed to configure multicast domains, run discovery, create users, create health checks, and use the "Admin Utilities".
Figure 1-18
To add a new user, enter a user ID and then select the appropriate privilege level. Enter the password in both the "Password" and "Verify" fields, and click "Add User". User's can change their password by clicking the "Change Password" link in the left frame shown above. However, only an administrator can delete users.
Note
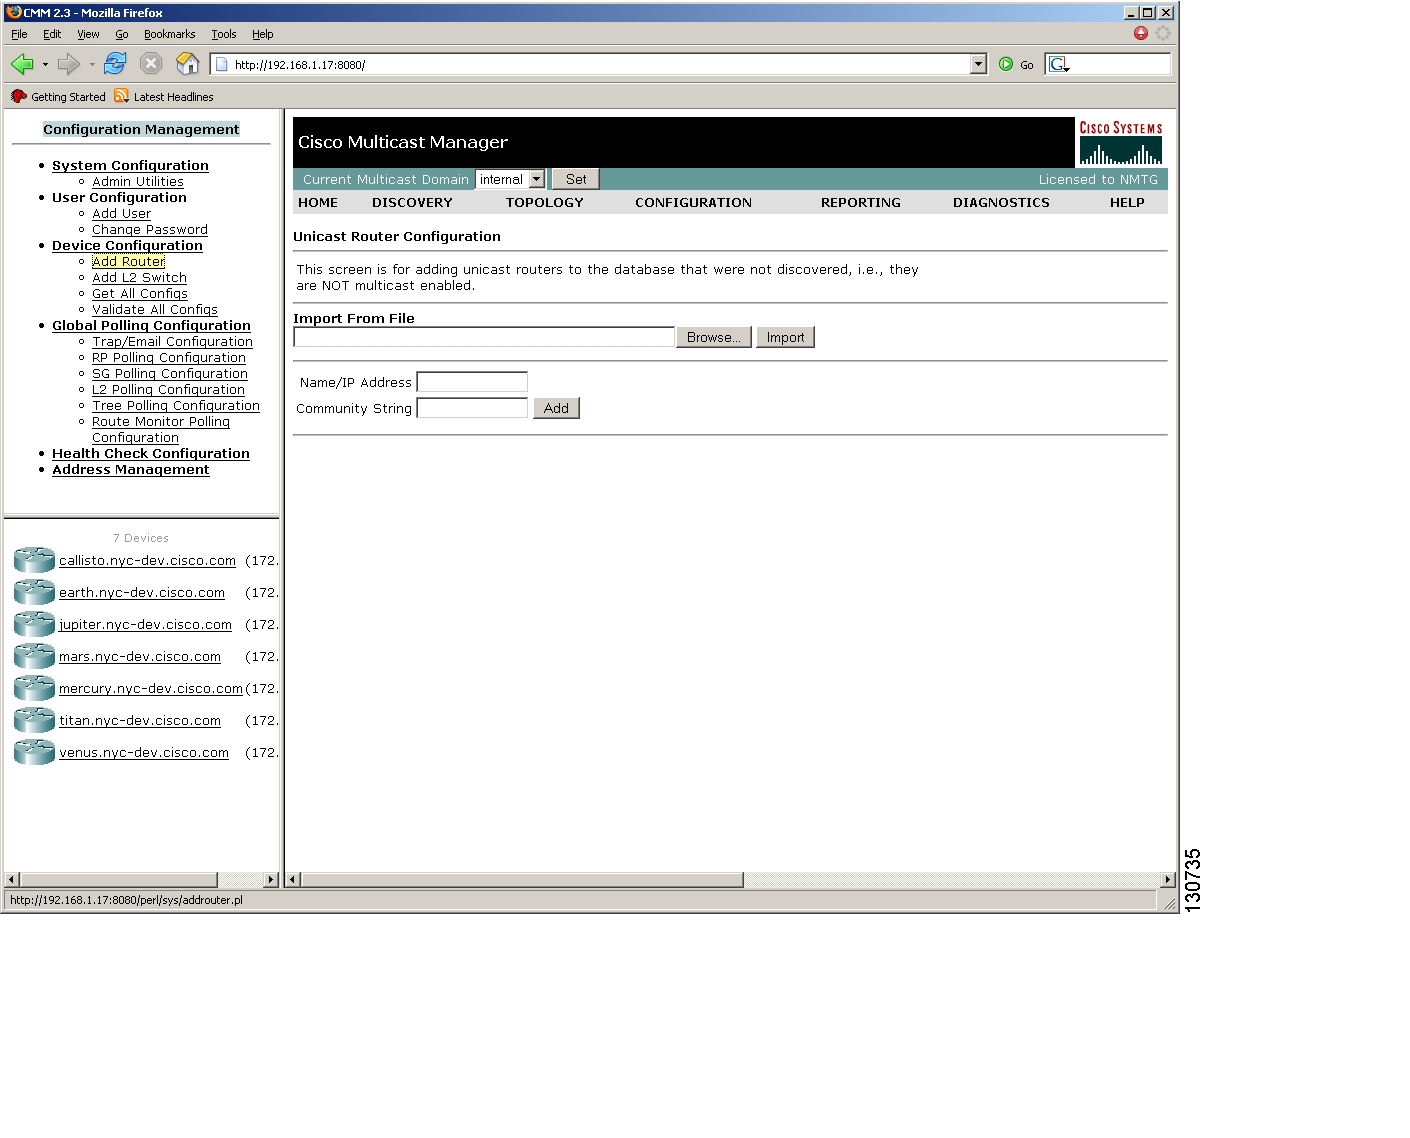
Adding Unicast Routers
This screen allows non-multicast enabled routers to be added to the database for route monitoring purposes.
Figure 1-19
To manually add a router to the database, enter the router name or IP address in "Name/IP Address" field and click "Add". To remove a router, select the router that you would like to remove from the drop down list and click "Remove".
To import a list of routers, click the "Browse" button, and locate the file containing the routers you wish to import. The file should be in the following format:
#import file format# this line will be skippedrouterArouterB172.16.1.1Once the file is selected, click the "Import" button.
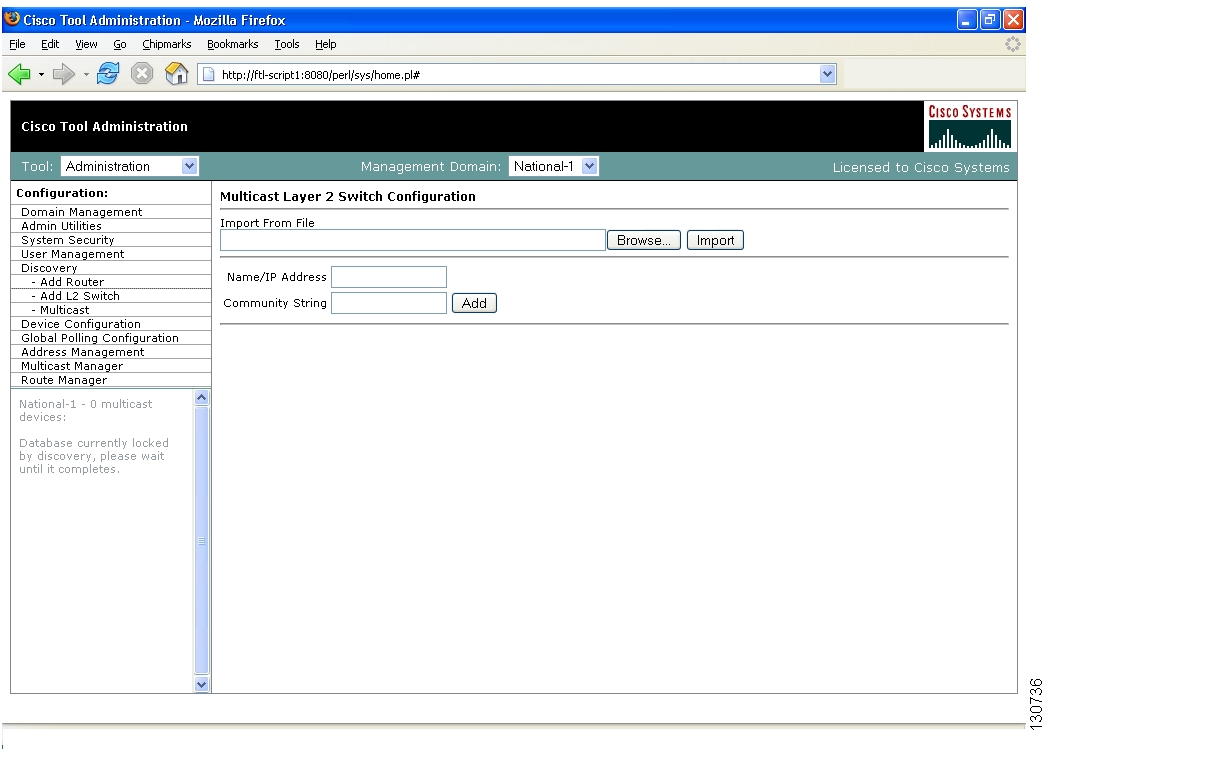
Adding Layer 2 Switches
The Cisco Multicast Manager can provide some information concerning the Layer 2 switches in a multicast network. However, these switches are not discovered automatically and have to be manually added to the database. Switches can be added individually, or imported in the form of a csv file.
Figure 1-20
To manually add a Layer 2 switch to the database, enter the switch name or IP address in "Name/IP Address" field and click "Add". To remove a Layer 2 switch, select the switch that you would like to remove from the drop down list and click "Remove".
To import a list of switches, click the "Browse" button, and locate the file containing the switches you wish to import. The file should be in the following format:
#import file format# this line will be skippedswitchA192.168.1.1switchC
Note
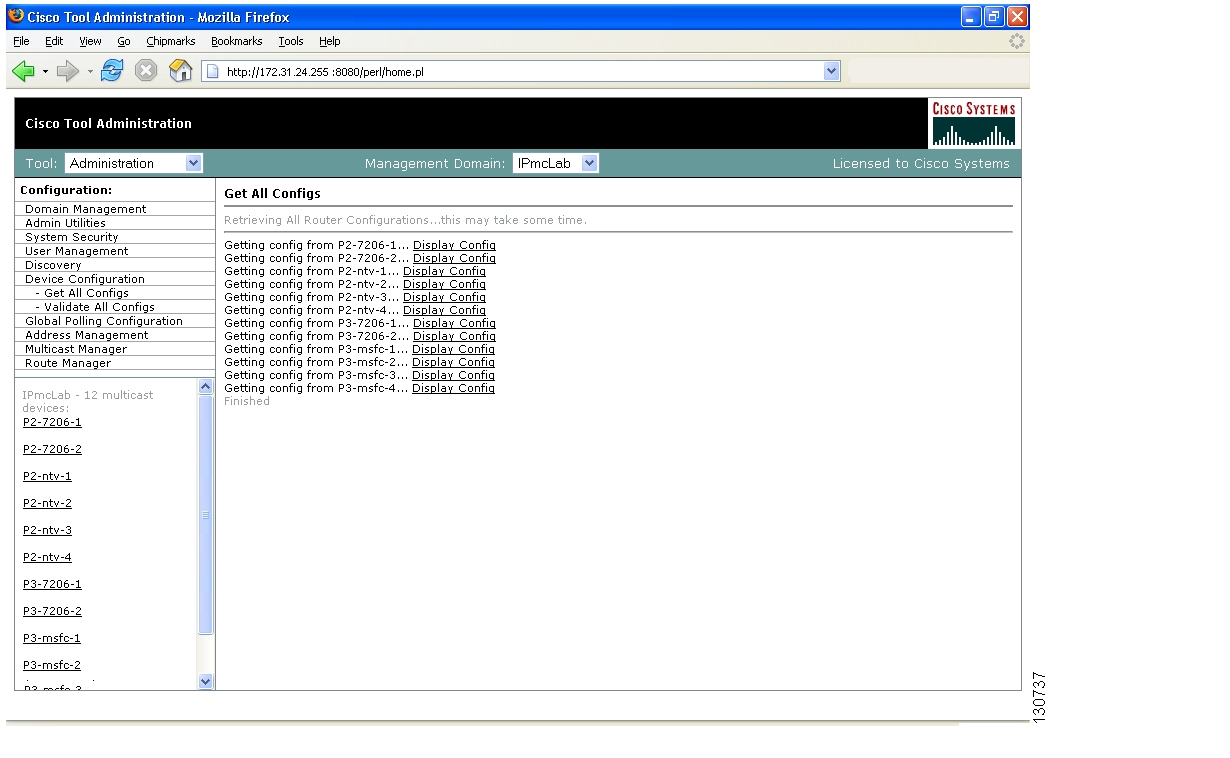
Downloading Router Configurations
Clicking on "Get All Configs" will cause the application to download the router configuration for each router in the database.
Note
Instructions for enabling TFTP on Linux and Solaris can be found in the CMM Installation guide.
Figure 1-21
This process may take some time depending on the number of routers in the current domain.
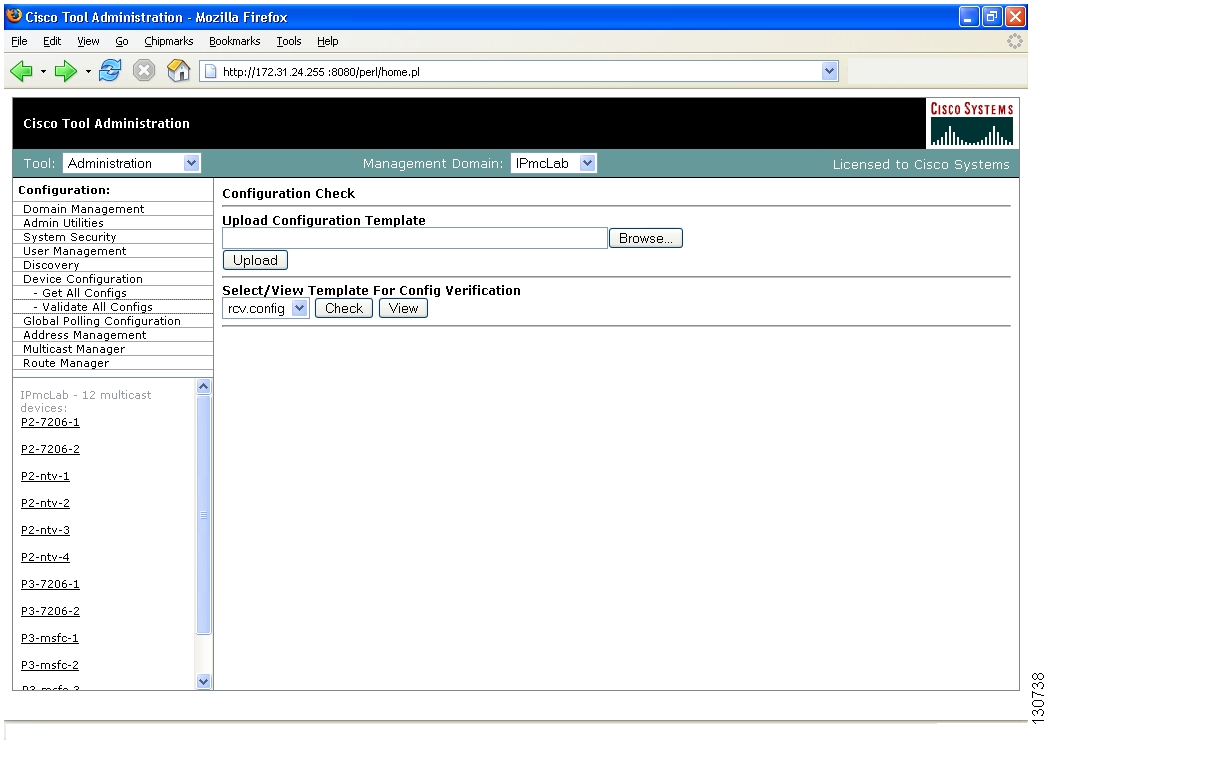
Validate Router Configurations
The "Validate All Configs" option allows router configurations to be verified against a template. Several sample templates are included with the application. A template can specify GLOBAL and INTERFACE specific commands that should be configured on a router. E.g.:
GLOBALhostnameaccess-classINTERFACE SERIALbandwidthINTERFACE GIGABITETHERNETdescriptionFigure 1-22
To use this option TFTP must be enabled on the server, and the SNMP read-write community string must be configured in the application. User defined templates can be uploaded using the "Browse/Upload" buttons. Templates should be created as plain ASCII text files. Specially formatted files, e.g., word processor documents, will not work. To view an uploaded template, select it from the drop down list, and click "View". To validate the router configurations for the current domain, click "Check". Each router's configuration will be downloaded to the server via TFTP, and checked against the specified template. The display will look similar to the following:
Figure 1-23
Address Management
The address management database provides a local mapping of name to IP address. The database initially contains reserved multicast addresses only. IP addresses can be entered manually or imported via a csv file from the Admin Utilities screen. The format of the file is shown below.
#import file format# this line will be skipped239.1.1.1,test group192.168.1.1,sourceAThe database can also be exported in csv file format.
Figure 1-24
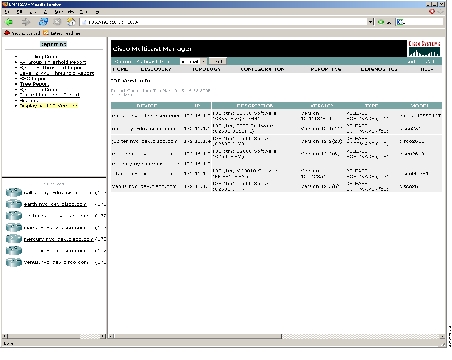
Display All IOS Versions
This option displays the IOS version of all routers discovered in the current domain.
Figure 1-25
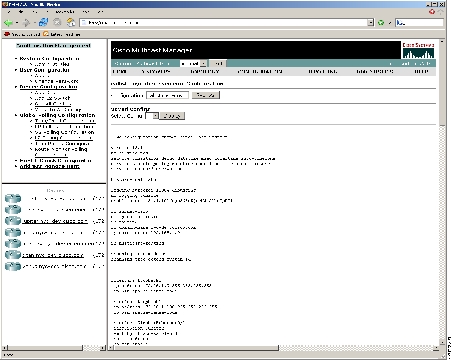
Displaying a Router's Configuration
To display a routers configuration click on "Configuration", then click the desired router. You can then click "Display Router Config" in the main frame. The configuration will only be available if it has been previously downloaded via "Get All Configs" or "Validate All Configs".
Figure 1-26
The router's configuration can also be saved under a different name. All saved configurations for the current router will appear in the "Select Config" drop down list.
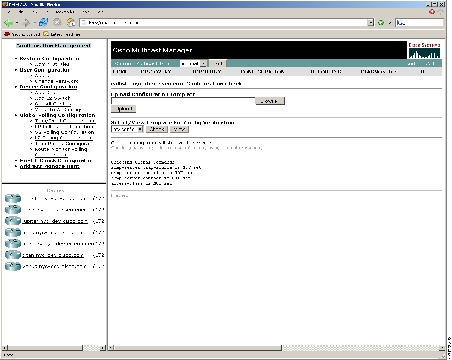
Validating a Single Router Configuration
You can also validate an individual router's configuration by clicking "Validate Router Config". The options and procedure are the same as described above in "Validate Router Configurations".
Figure 1-27
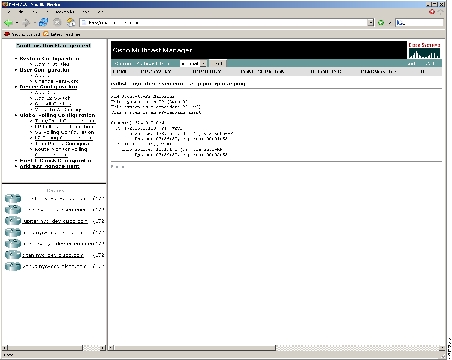
Displaying a Router's RP Mappings
To display the active RP for an individual router click "RP Mapping".
Figure 1-28
Note
Reporting
The following options are available under reporting:
•
•
•
•
•
•
•
•
•
Note
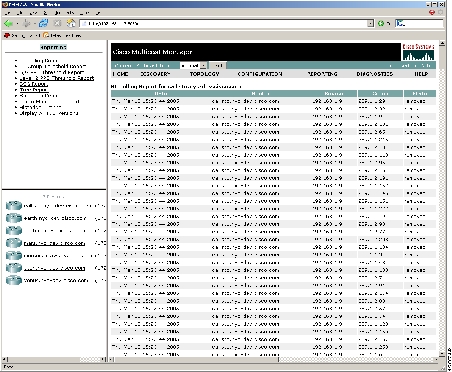
RP Polling Report
To display information about groups that have been added and/or removed from an RP, click on "RP Polling Report" and select the desired RP from the drop down list. You can also specify the maximum number of events to be displayed in the browser. Clicking the "Report" button will produce a report similar to the one shown below. The report will contain any events that have occurred in the last 24 hours.
Figure 1-29
Figure 1-30
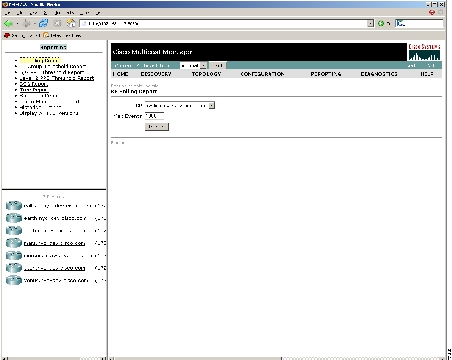
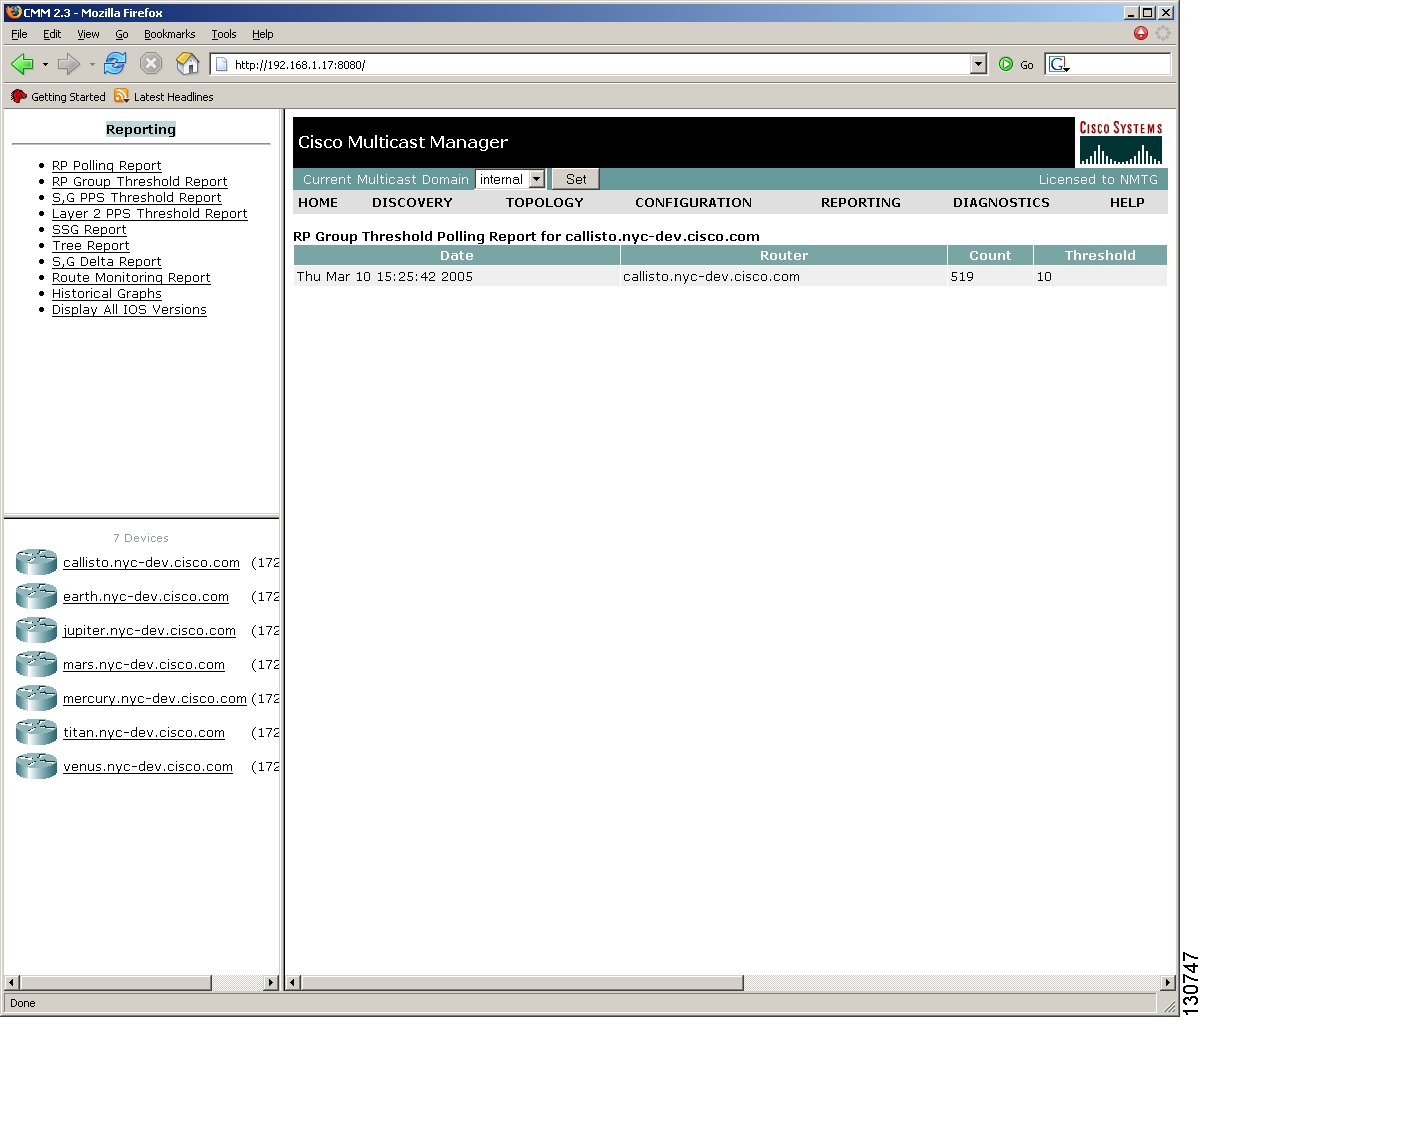
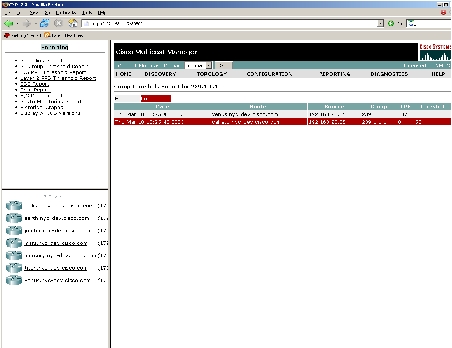
RP Group Threshold Report
To display information about the group limit set on an RP click on "RP Group Threshold Report" and select the desired RP from the drop down list. Clicking the "Report" button will produce a report similar to the one shown below. The report will contain any events that have occurred in the last 24 hours.
Figure 1-31
S,G PPS Threshold Report
To display information about sources that have exceeded the high or low threshold setting on PPS generated to a particular group, click on "S,G PPS Threshold Report", and enter the multicast group address. Clicking on "Report" will produce a report similar to the one shown below. The report will contain any events that have occurred in the last 24 hours.
Figure 1-32
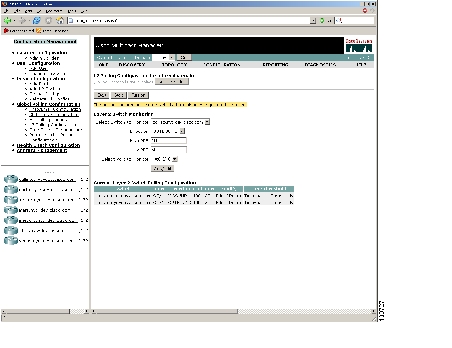
Layer 2 PPS Threshold Report
To display information about Layer 2 switch ports that have exceeded the high or lo threshold setting on multicast PPS click on "Layer 2 PPS Threshold Report", and select a switch. After selecting a switch, a drop down list will be displayed, that contains the ports for the switch. Selecting a port and clicking on "Report" will produce a report similar to the one shown below. The report will contain any events that have occurred in the last 24 hours.
Note
Figure 1-33
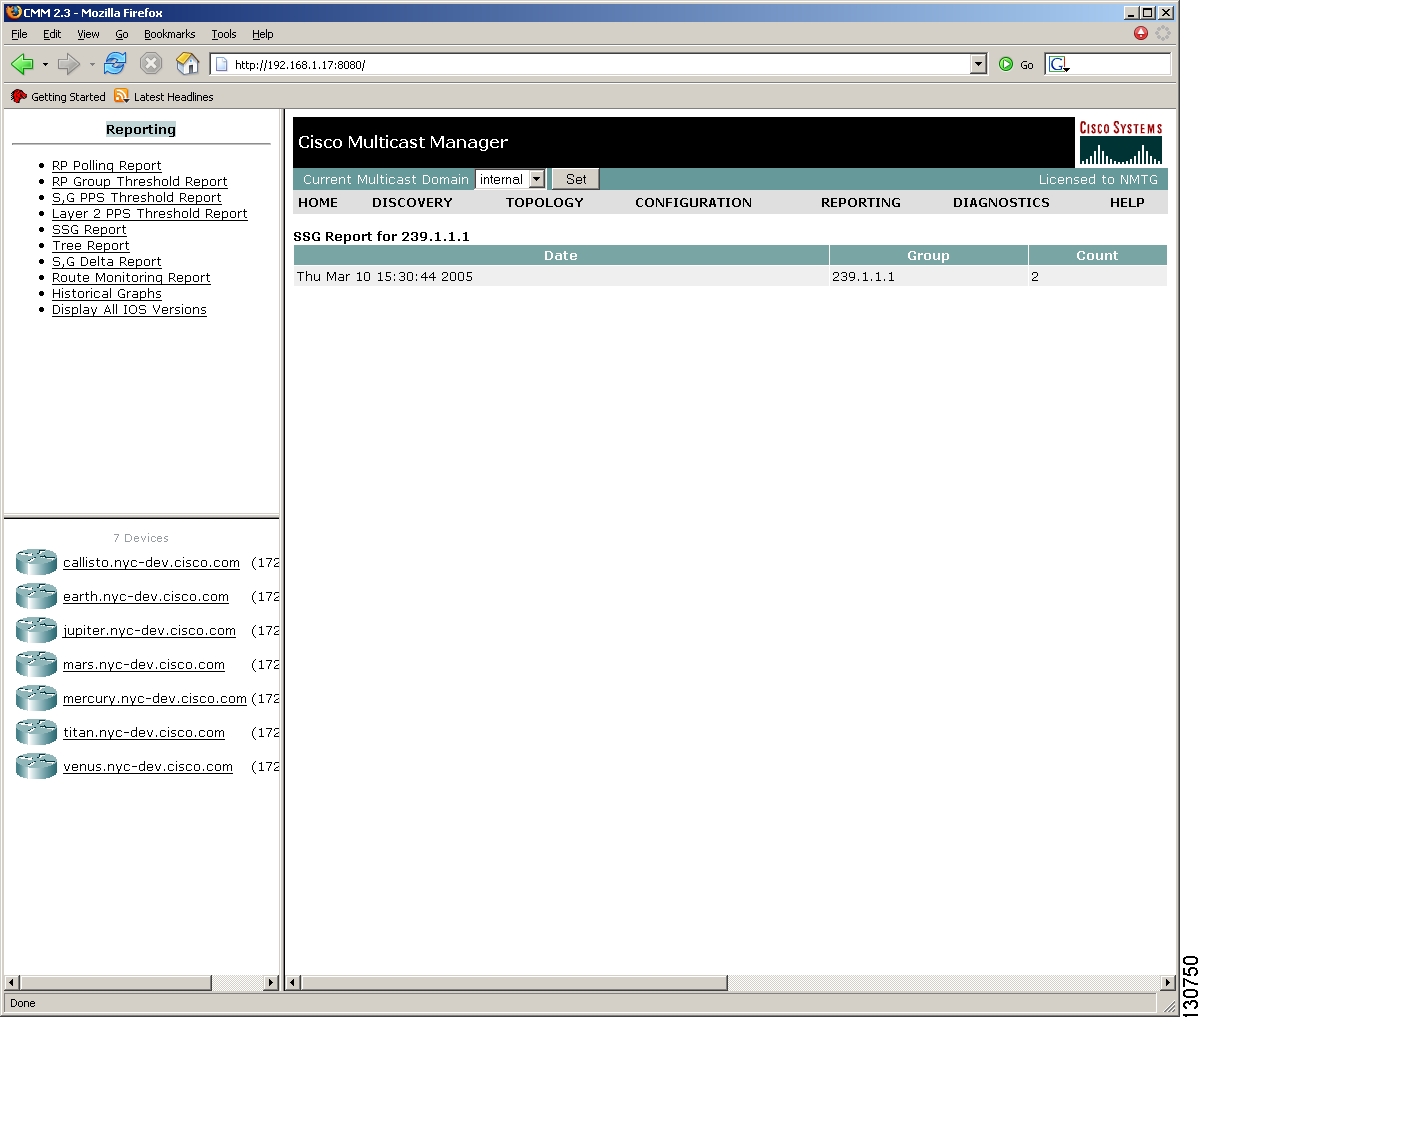
SSG Report
To display information about groups that have more than one sender, click on "SSG Report", and enter the multicast group address. Clicking on "Report" will produce a report similar to the one shown below. The report will contain any events that have occurred in the last 24 hours. The count indicates the number of sources sending to the group.
Figure 1-34
Tree Report
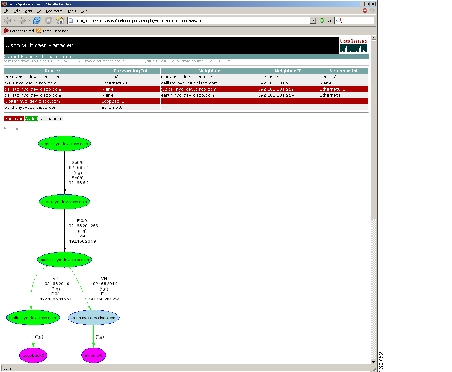
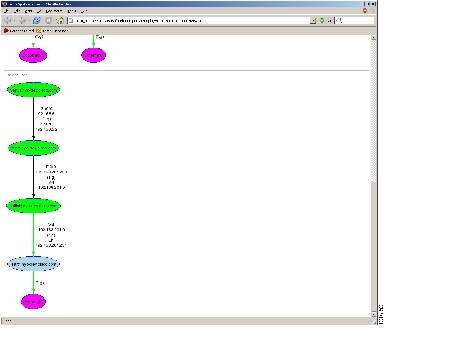
To display information about multicast trees that have changed, click "Tree Report", and select a baseline from the drop down list. A report similar to the one below will be displayed if any events have been logged for the selected baseline within the last 24 hours. Clicking "trchanged" in the third column in the report will graphically show the baseline, along with the changed tree.
Figure 1-35
Figure 1-36
Changes to the tree are highlighted in the table at the top as shown in the figure above. The baseline and the current tree are also shown graphically.
Figure 1-37
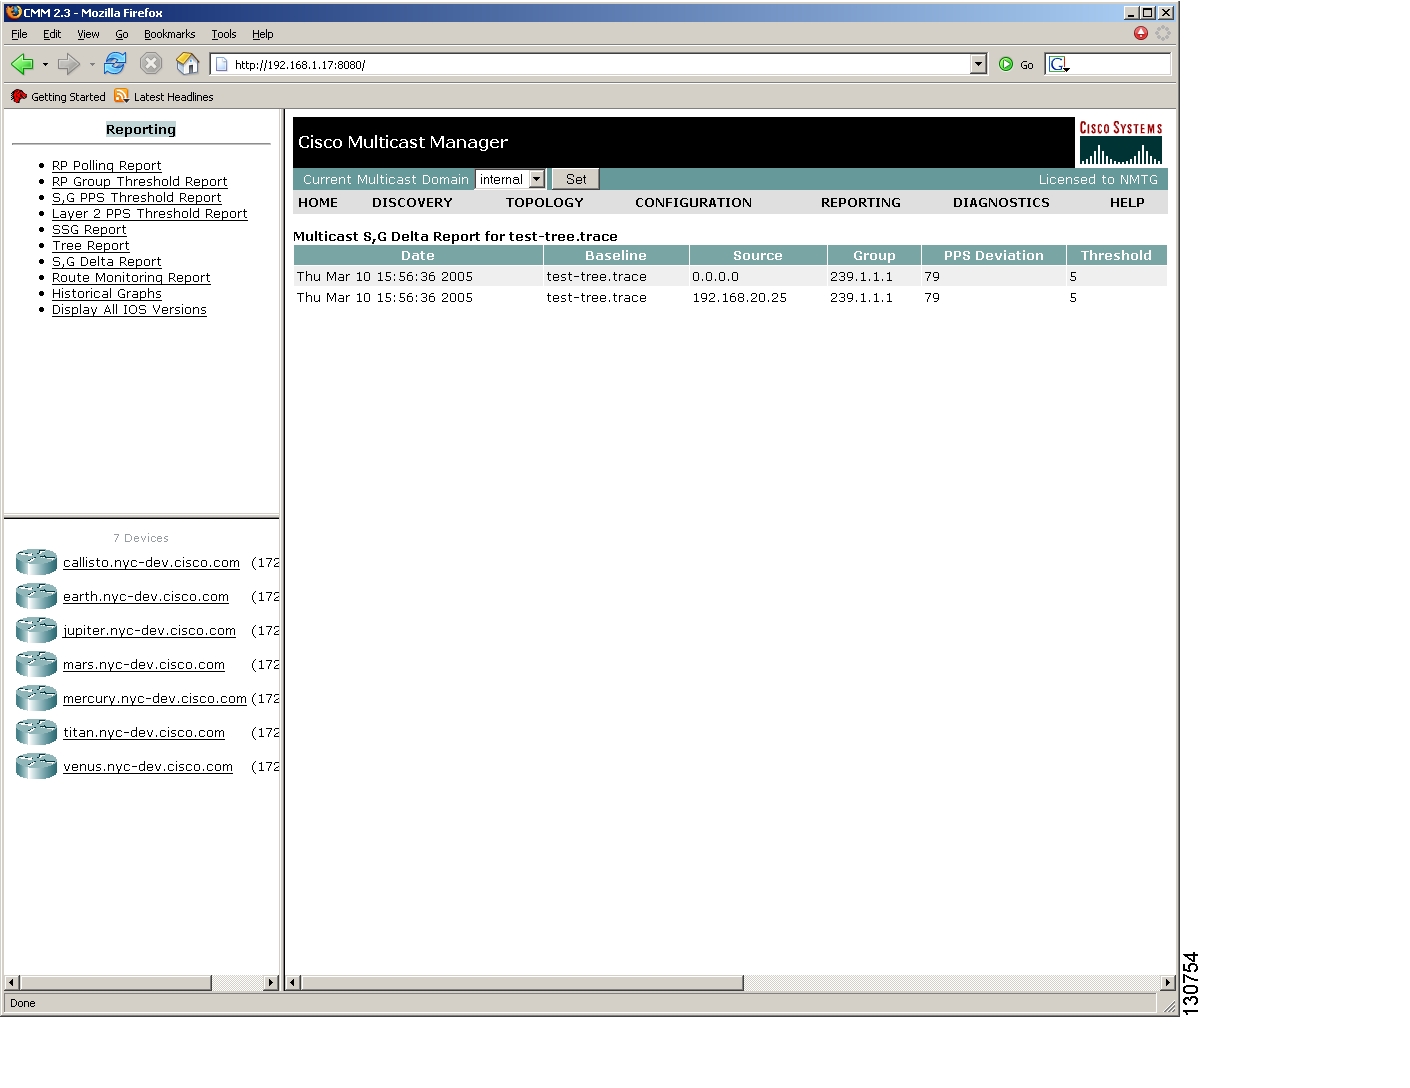
SG Delta Report
To display information about PPS rate deviation on multicast trees, click "S,G Delta Report", and select a baseline from the drop down list. A report similar to the one below will be displayed if any events have been logged for the selected baseline within the last 24 hours.
Figure 1-38
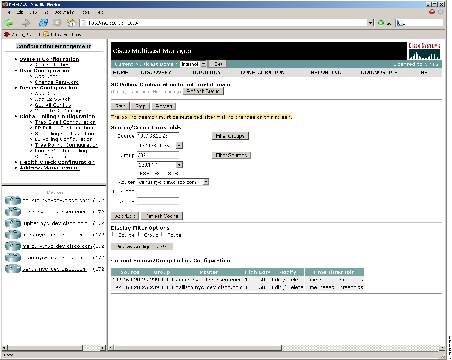
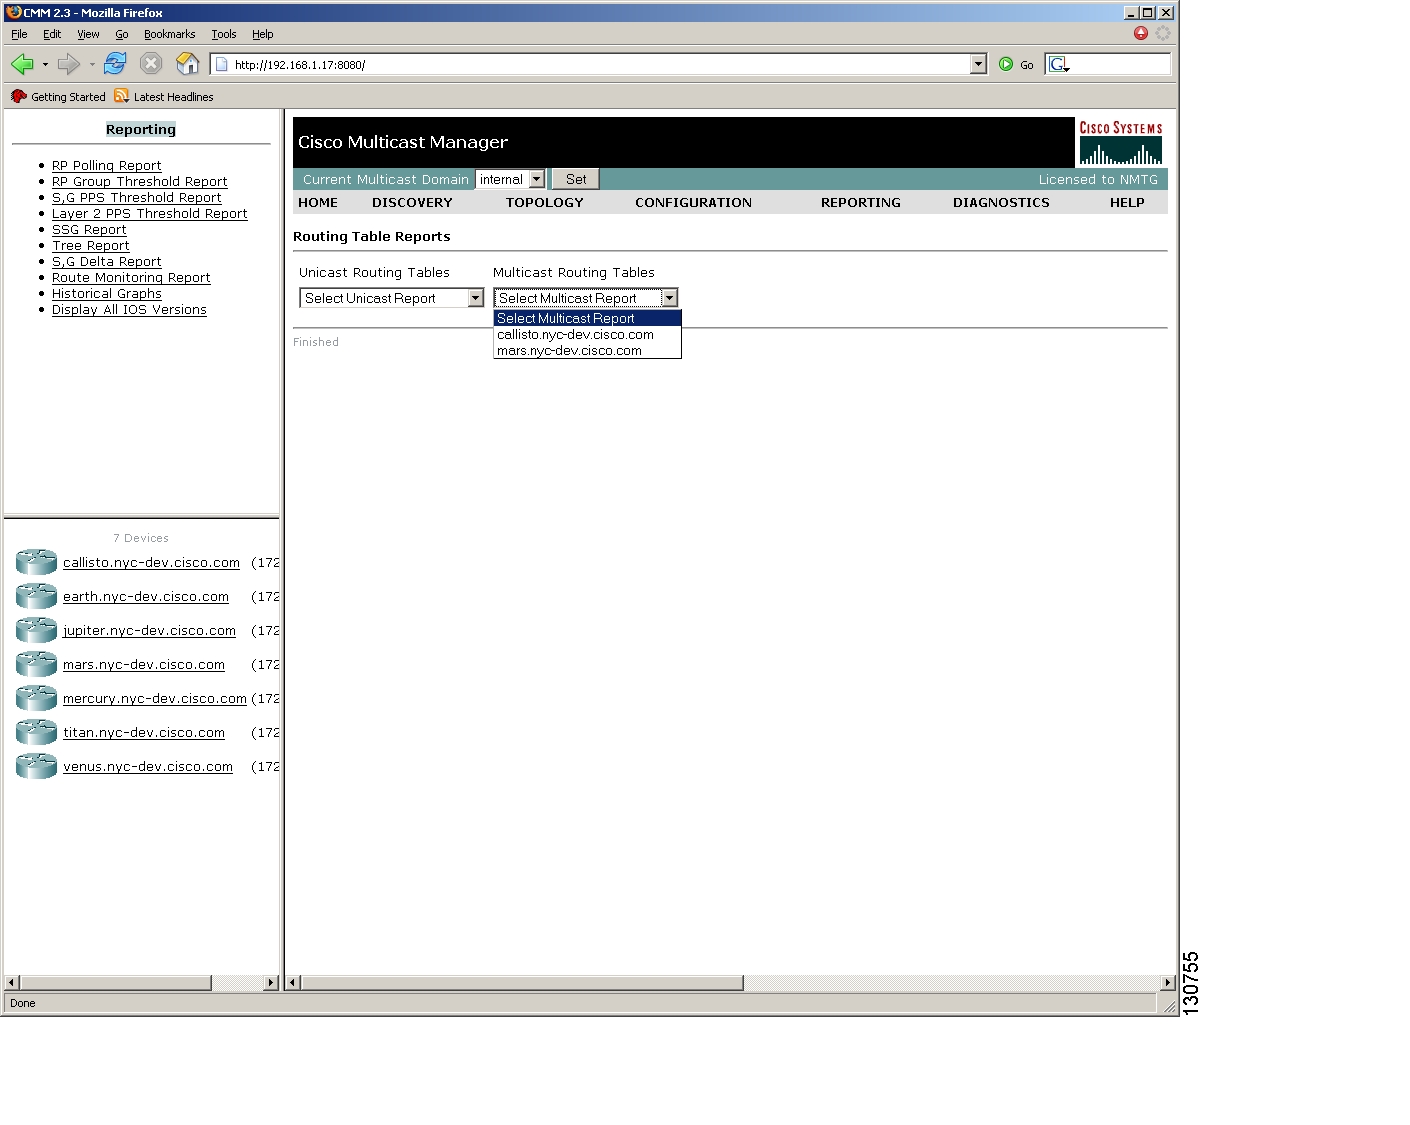
Route Monitor Report
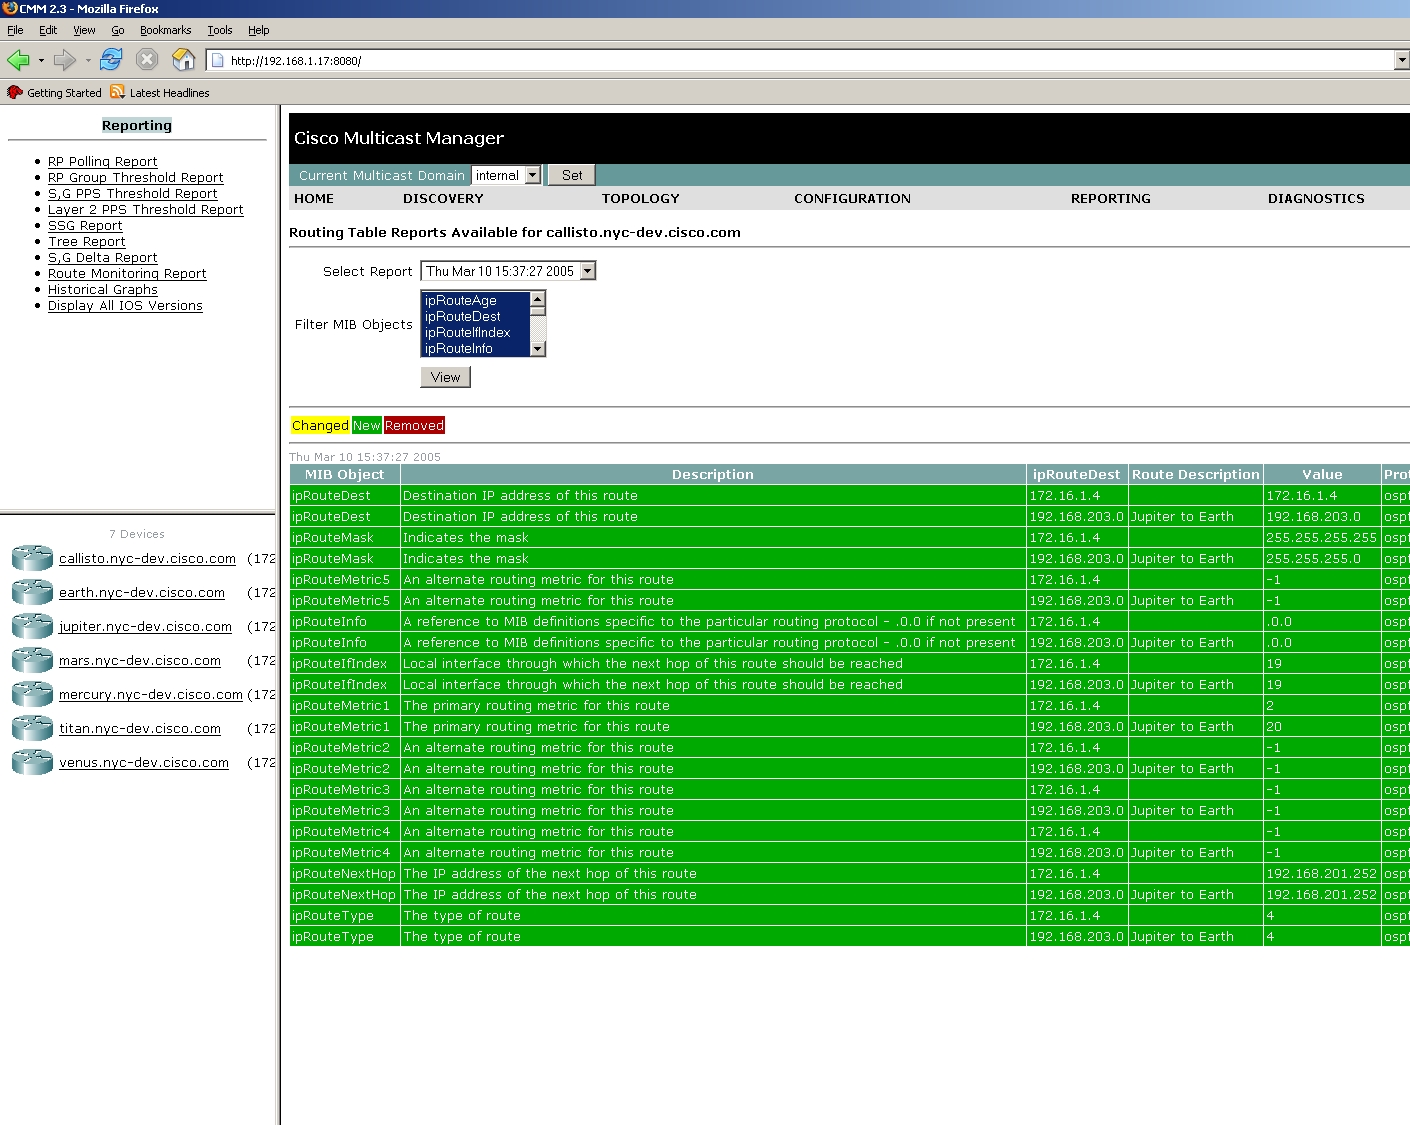
Routing table change reports can be viewed as shown below by selecting a router from the Unicast or Multicast drop down lists. The date and time of the report can then be selected and optionally filtered, by selecting the MIB objects to be displayed. By default all the MIB objects are selected as shown in Fig. 41.
Figure 1-39
The report contains three types of events: changes, additions, removals. For example, if a route destination changes the event will be shown in yellow. If a route destination is completely removed the event will be shown in red. If a route destination is added the event will be shown in green. Changes and additions will show the time the change actually occurred based upon ipRouteAge. For removal events there is no ipRouteAge to reference.
Figure 1-40
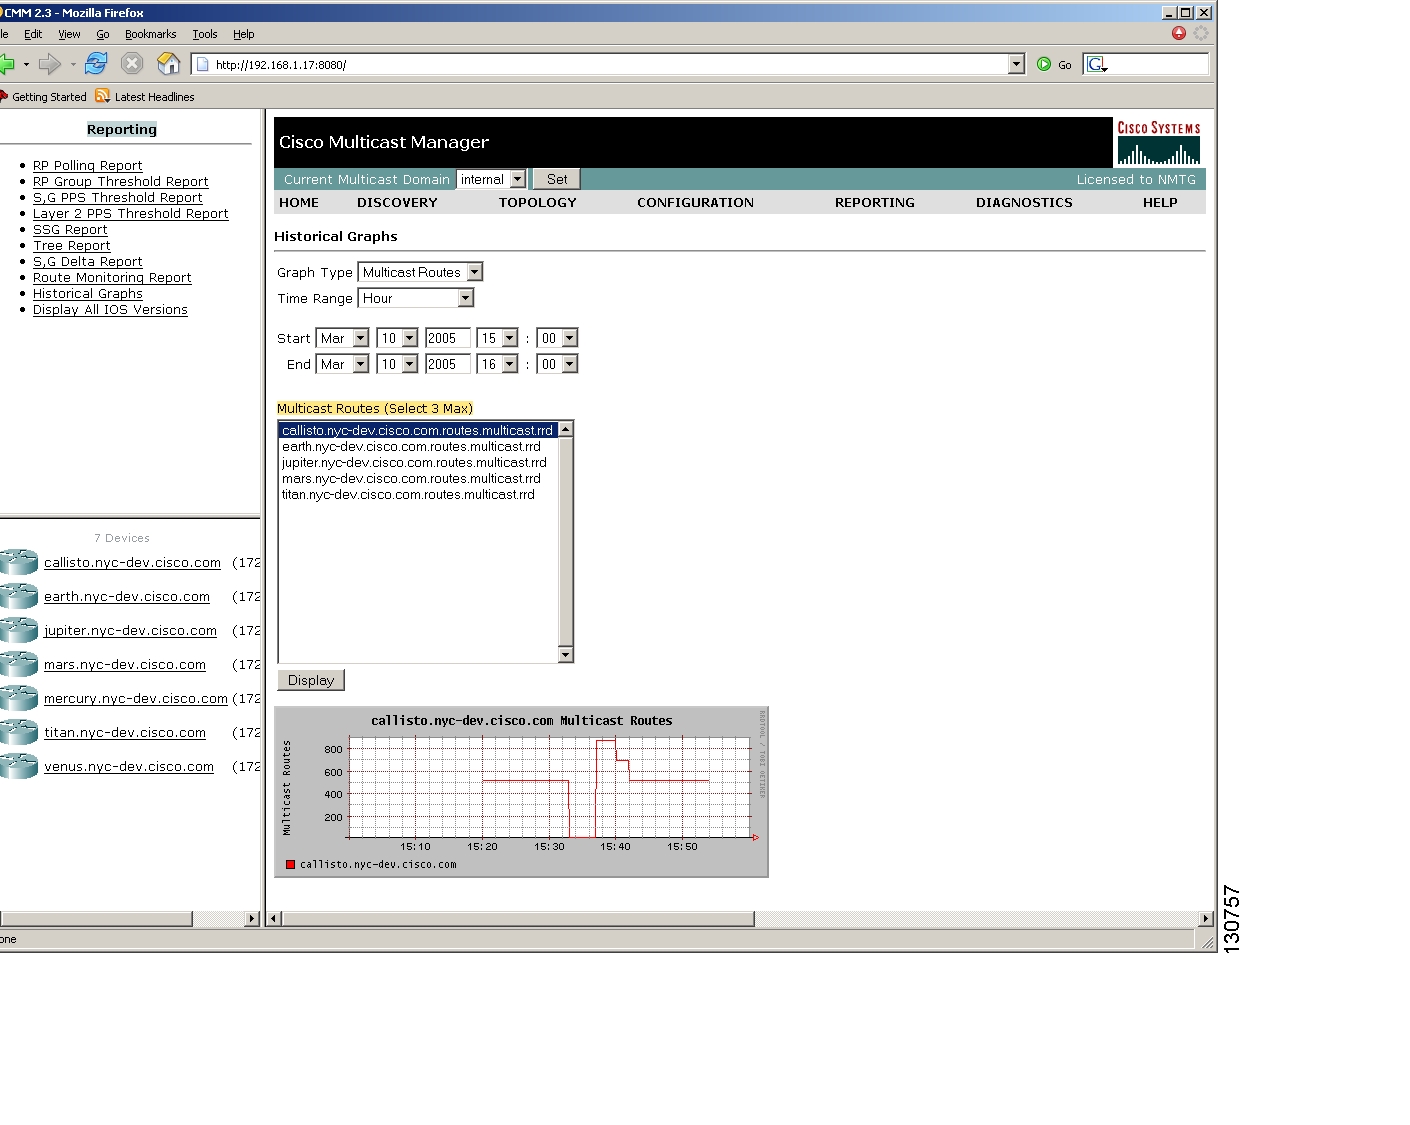
Graphs (Trends)
To display historical graphs for data collected from Route Monitoring, S,G threshold, Layer 2 switch ports, or S,G delta polling, click on "Graphs (Trends)".
Figure 1-41
Begin by selecting the type of graph and time range. The preconfigured time ranges are "Hour, Day, Week, Month". A custom range can be specified by manually setting the Start and End times. Up to 3 devices can be selected for display on the graph. Data stored for trending purposes will be kept for up to 18 months.
Diagnostics
There are two parts to the Diagnostics tool; a global view and a router specific view. The global view is discussed first.
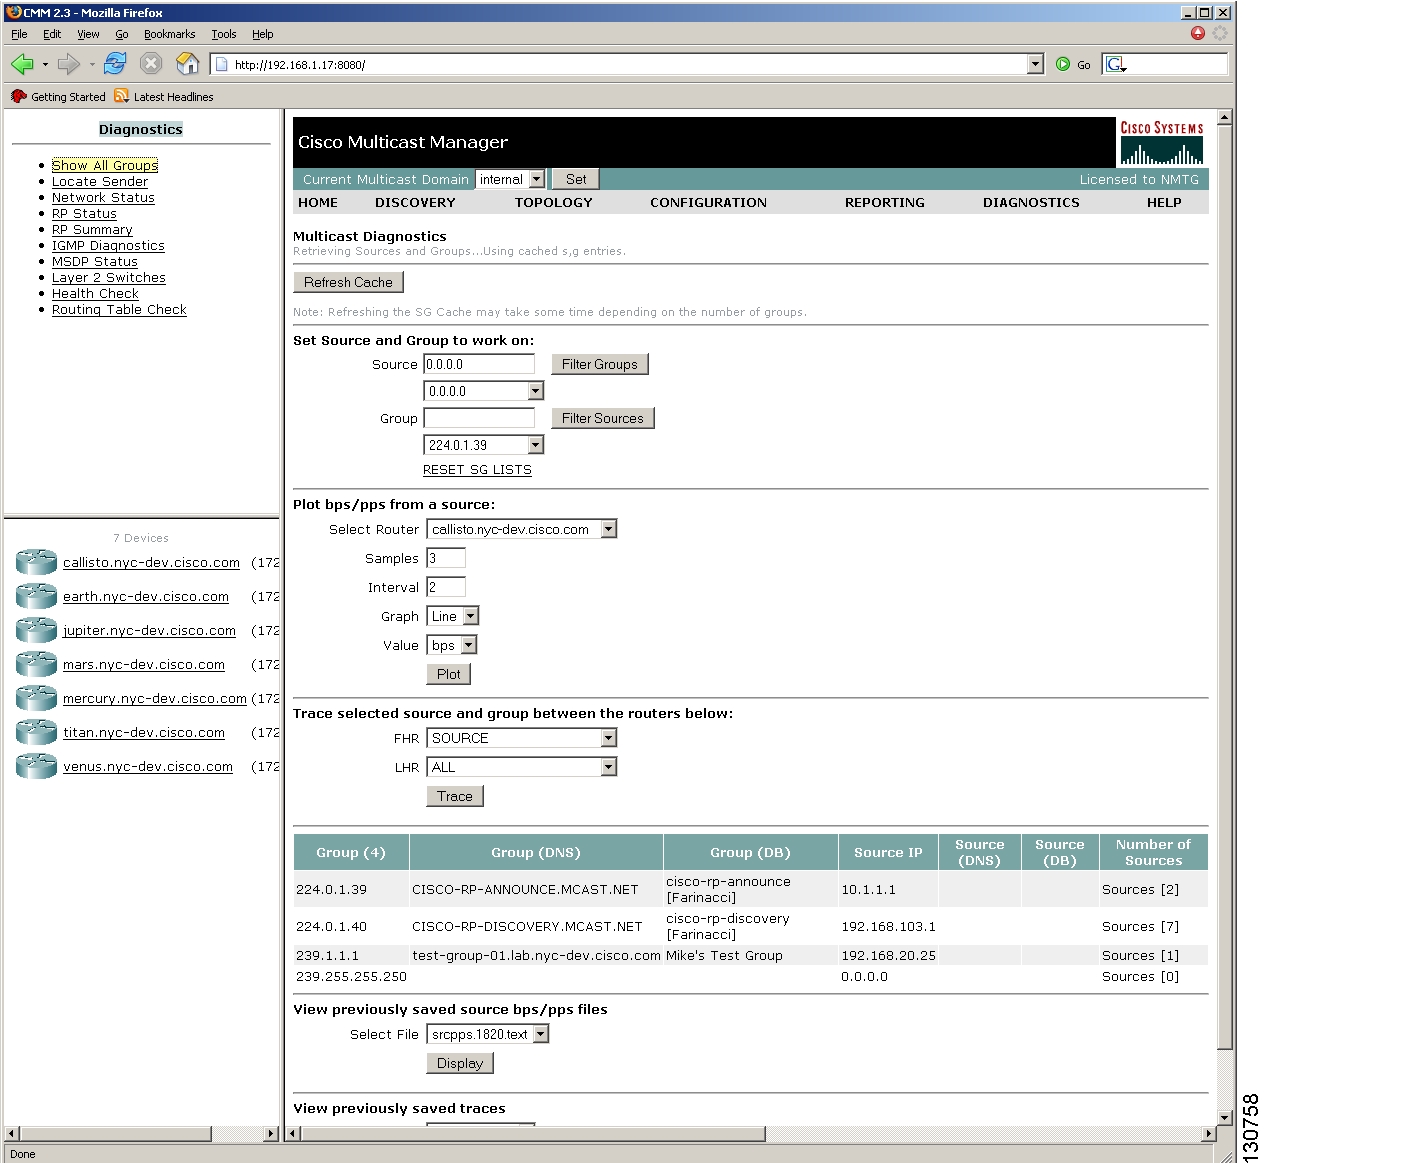
Show All Groups
Clicking on "Show All Groups" will produce a screen similar to one shown below. All active groups in the current domain are shown at the bottom of the screen sorted by group address.
Figure 1-42
During discovery, CMM will cache all the S,Gs that exist on the RPs.
Note
In domains that don't contain RPs, e.g., PIM Dense-Mode, the S,G cache is created by querying all the routers that have been discovered in the domain. In this case the cache is only updated when the "Refresh Cache" button is clicked.
The primary functions of the "Show All Groups" screen are to provide plotting of PPS for an S,G on a particular router, and to trace multicast forwarding trees. Sources and groups are listed in separate drop down lists, allowing for the selection of any combination of source and group. However, to ensure that an S,G is being selected that actually exists in the network, the "Filter Groups" and "Filter Sources" options should be used. For example, begin by selecting a group from the "Select Group" drop down list, then click on "Filter Sources". The "Select Source" drop down list will now only contain sources that are valid for the group that has been selected. If a source were selected first, then clicking on "Filter Groups" would cause the "Select Group" drop down list to contain only groups that are valid for the selected source. To reset the lists, simply click on "Reset S,G Lists".
Plotting bps/pps
Bps or PPS for an S,G can be plotted for any router in the multicast domain. In the "Plot bps/pps from a source" section, select a router, and set the number of samples (1-50), and the sampling interval (1-90s), then click "Plot". This will produce a graph for the currently selected S,G, as described above, on the selected router. This graph can also be saved on the server.
Note
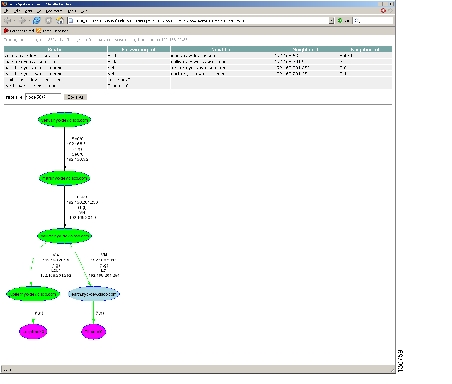
Displaying a Multicast Tree
The other option available from "Show All Groups" is tracing a multicast forwarding tree, and providing a graphical representation of it. Trees can be traced from the source to all receivers, from a specific first hop router (FHR) to all receivers, from a specific FHR to a specific last hop router (LHR), or from the source to a specific LHR. For the tree shown in Fig. 44 the FHR was SOURCE, and the LHR was ALL. With these settings the application will locate the router(s) where the source exists, and start tracing the forwarding tree from there. The tree is then displayed in tabular and graphical format. Any router that is known as an RP to the source router, will be displayed in green. Clicking on a router will open another window that will contain IP multicast routing information for the S,G that has been traced.
Note
As noted earlier, the bottom of the "Show All Groups" screen displays all the multicast groups found in the network in tabular format. Clicking directly on a group in this table will perform a trace of the forwarding tree for the S,G shown in the table, with the FHR set to SOURCE and the LHR set to ALL, except when the source is 0.0.0.0. In this case, the trace can still be performed, but the S,G must be selected from the down down lists with 0.0.0.0 as the SOURCE, and a FHR must be selected. The trace can then be performed by clicking the "Trace" button. This will be the typical situation in a Bi-Directional PIM network.
The last column of this table indicates the number of sources sending to a particular group. Clicking here will display all the sources sending to a particular group. From this screen, traces can also be performed by clicking on the desired source.
The Group (DB) and Source (DB) names shown in the table are taken from the IP address database mentioned earlier. The Source (DNS) field will only be populated if DNS is configured and if "Resolve Sources" is selected on the "System Configuration" screen. It should be noted that resolving thousands of addresses via DNS can be extremely slow.
Figure 1-43
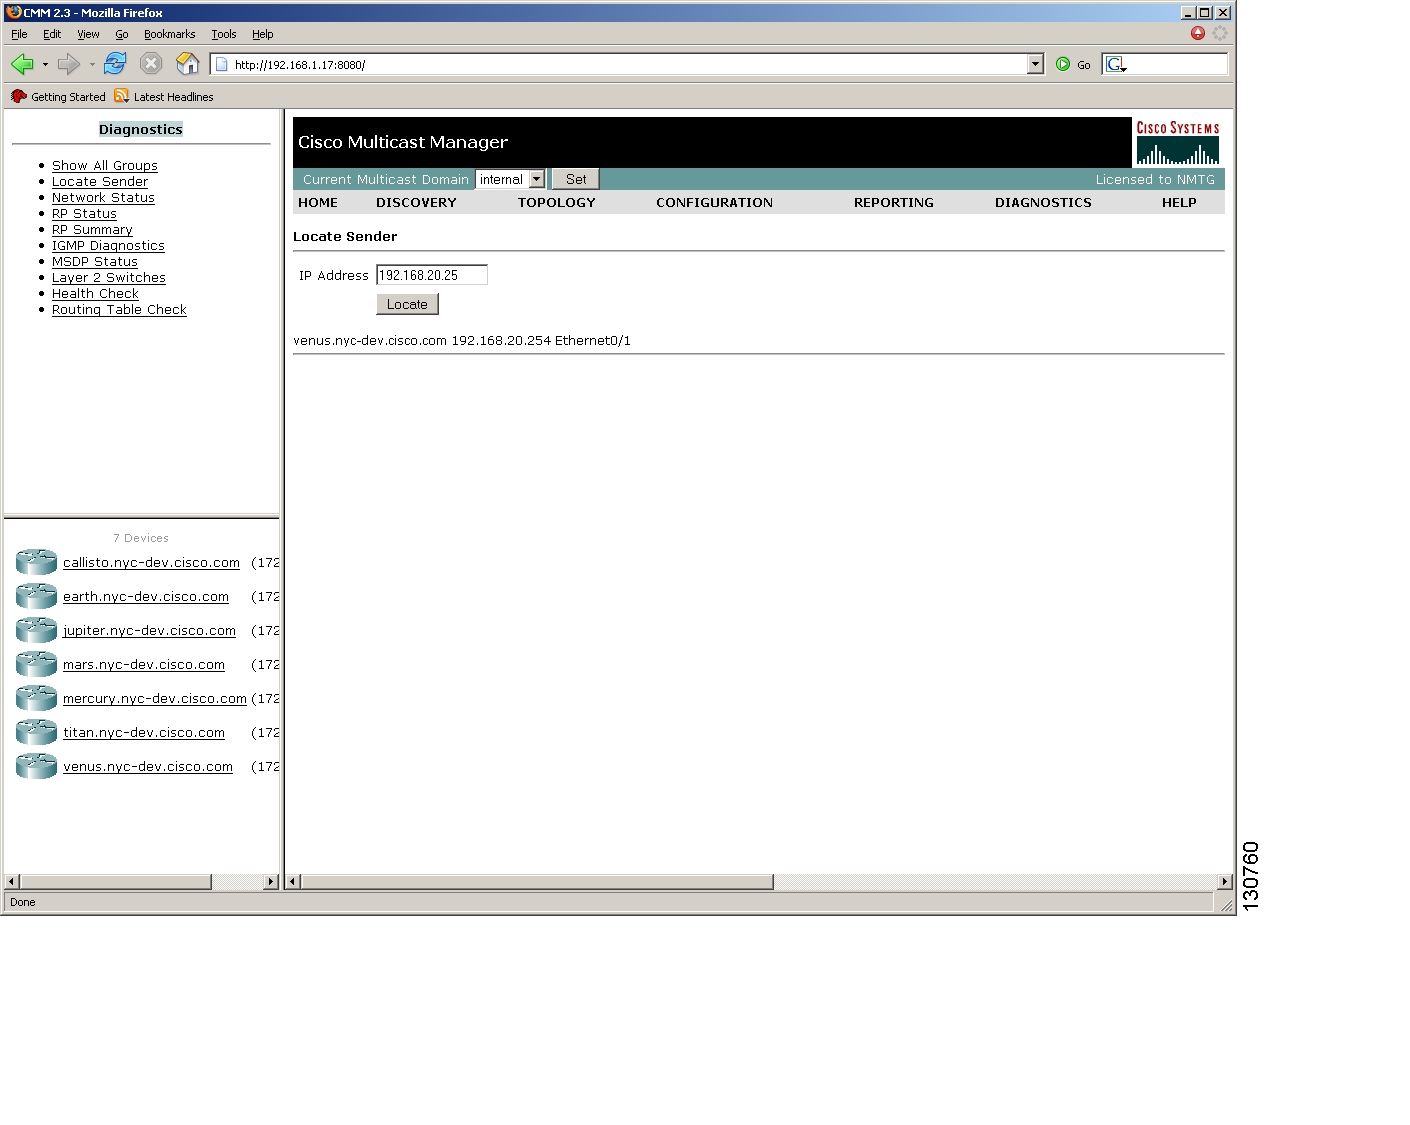
Locate Sender
This option provides a way to find where in the network a specific IP address/host is located. Simply enter the IP address/hostname (if DNS is configured) of the device you wish to find, and click "Locate".
Figure 1-44
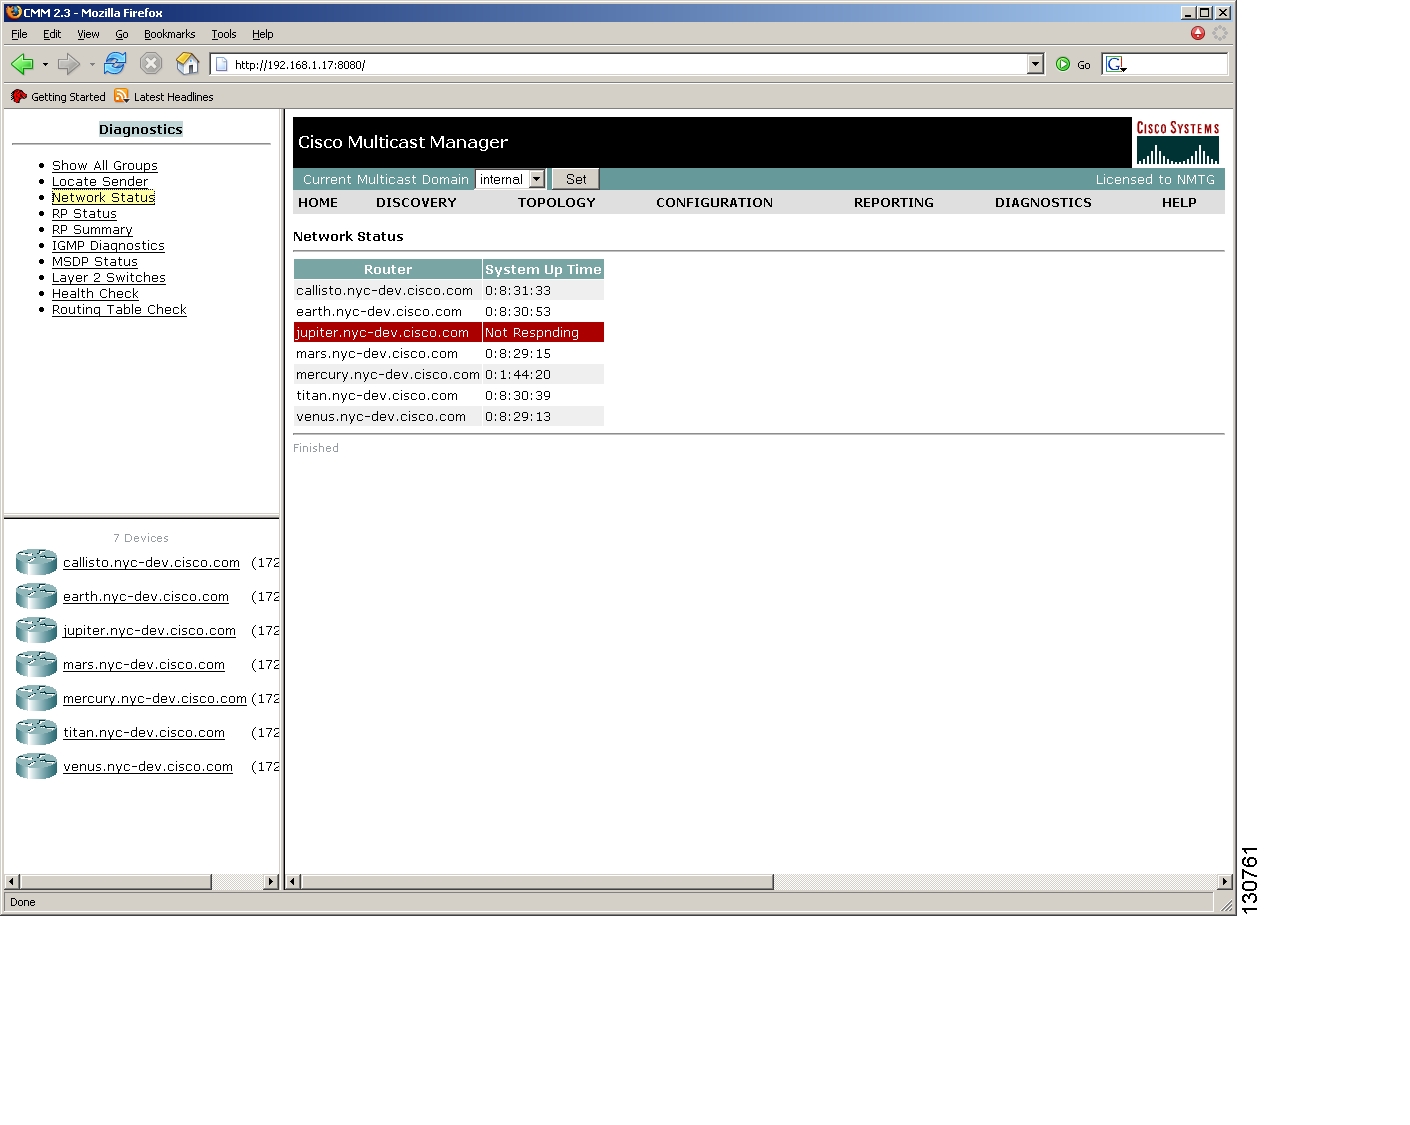
Network Status
This option provides the network status of the all the devices in the current multicast domain. The sysUpTime is displayed for all devices that are up. Devices not responding are highlighted in red.
Figure 1-45
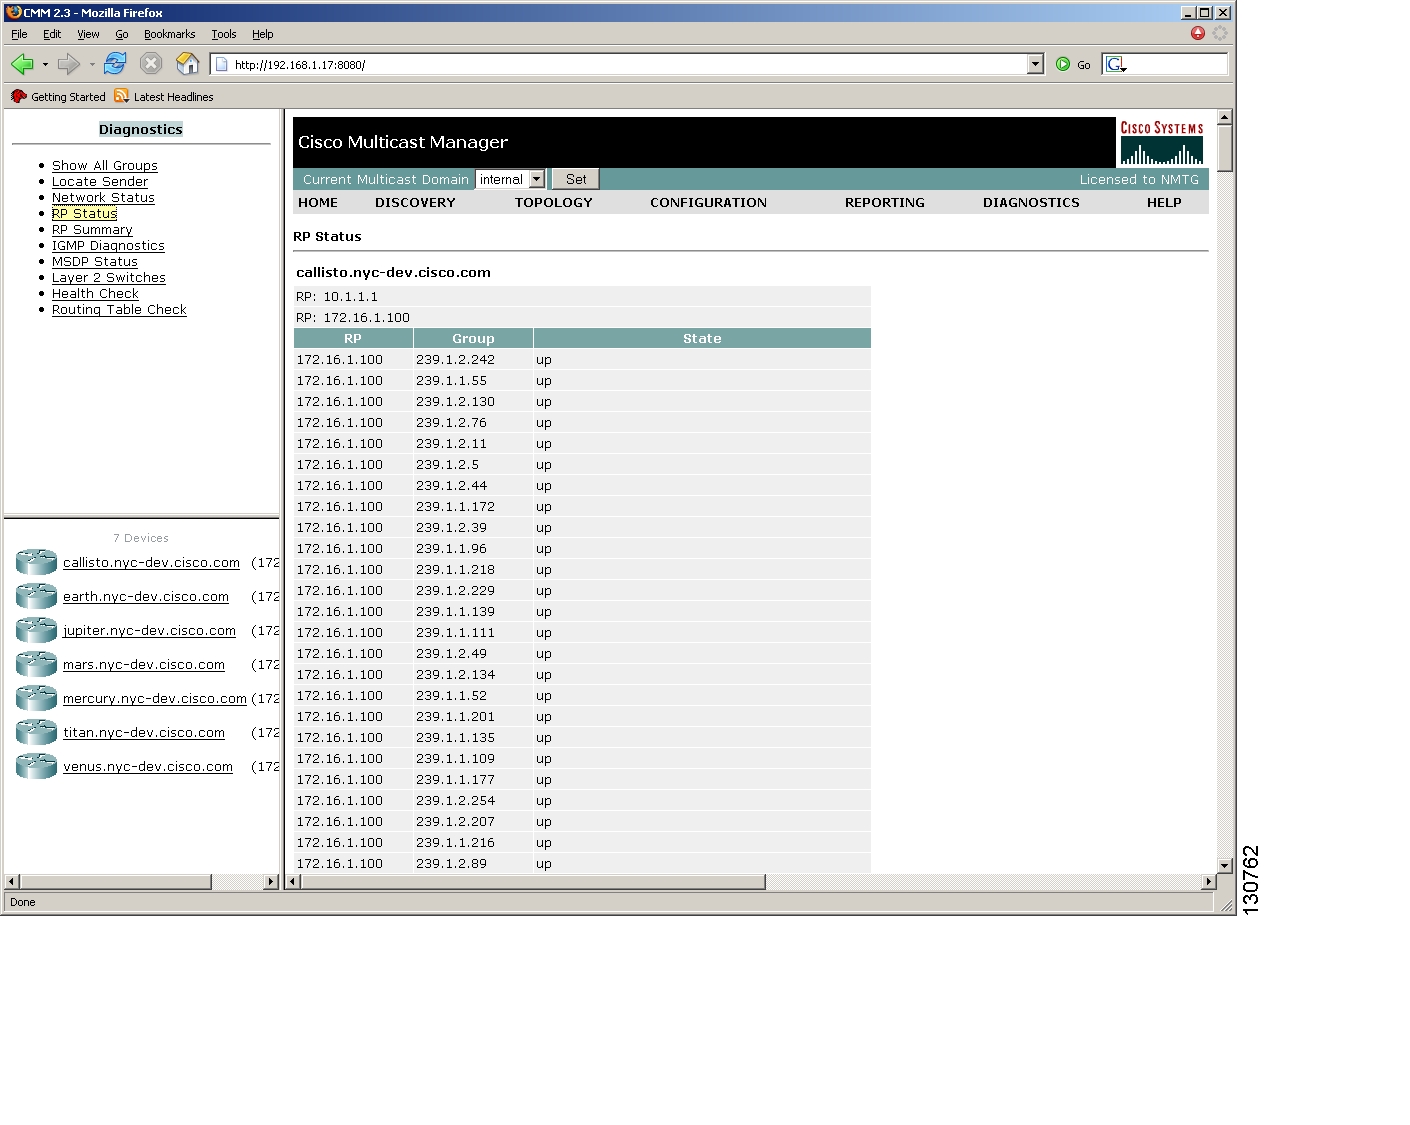
RP Status
This option provides RP information specific to each device in the current multicast domain. In a large network with, many S,Gs, it may take some time for this screen to be displayed, since each router in the multicast domain is queried.
Figure 1-46
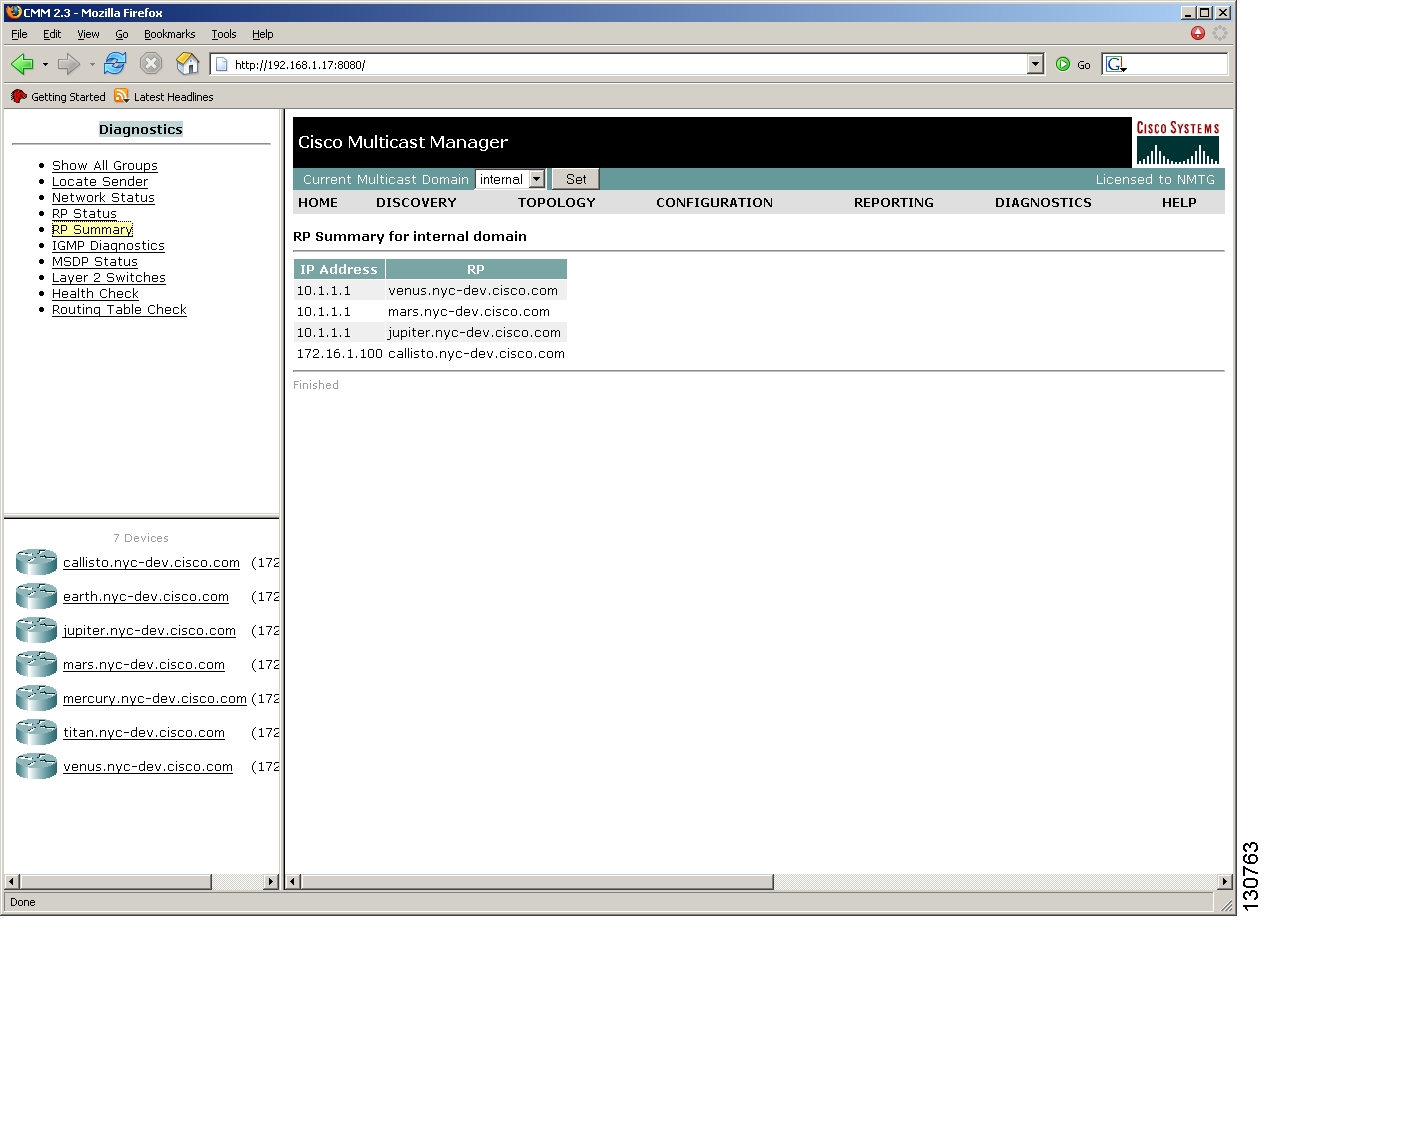
RP Summary
This option provides a quick summary of the RPs in the network based upon the discovery.
Figure 1-47
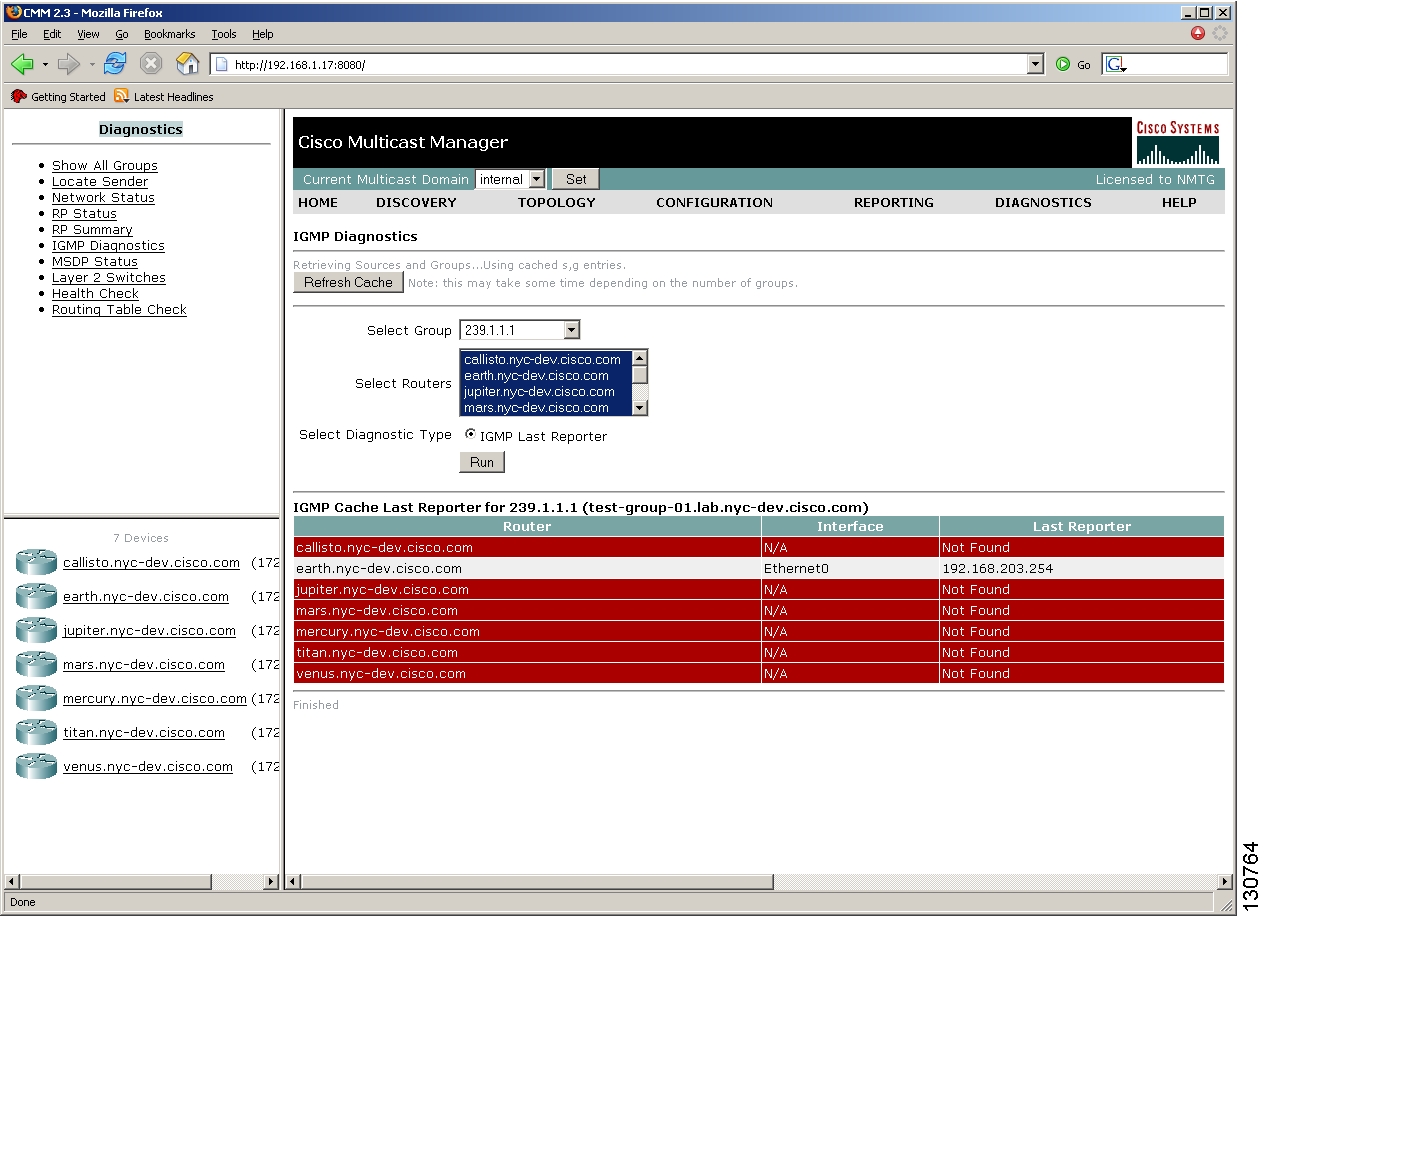
IGMP Diagnostics
IGMP diagnostics provides a way to check for an IGMP Last Reporter for a particular S,G among any number of routers. Simply select the desired S,G, then select the routers to be queried, and click "Run". The results are shown in Fig. 49.
Figure 1-48
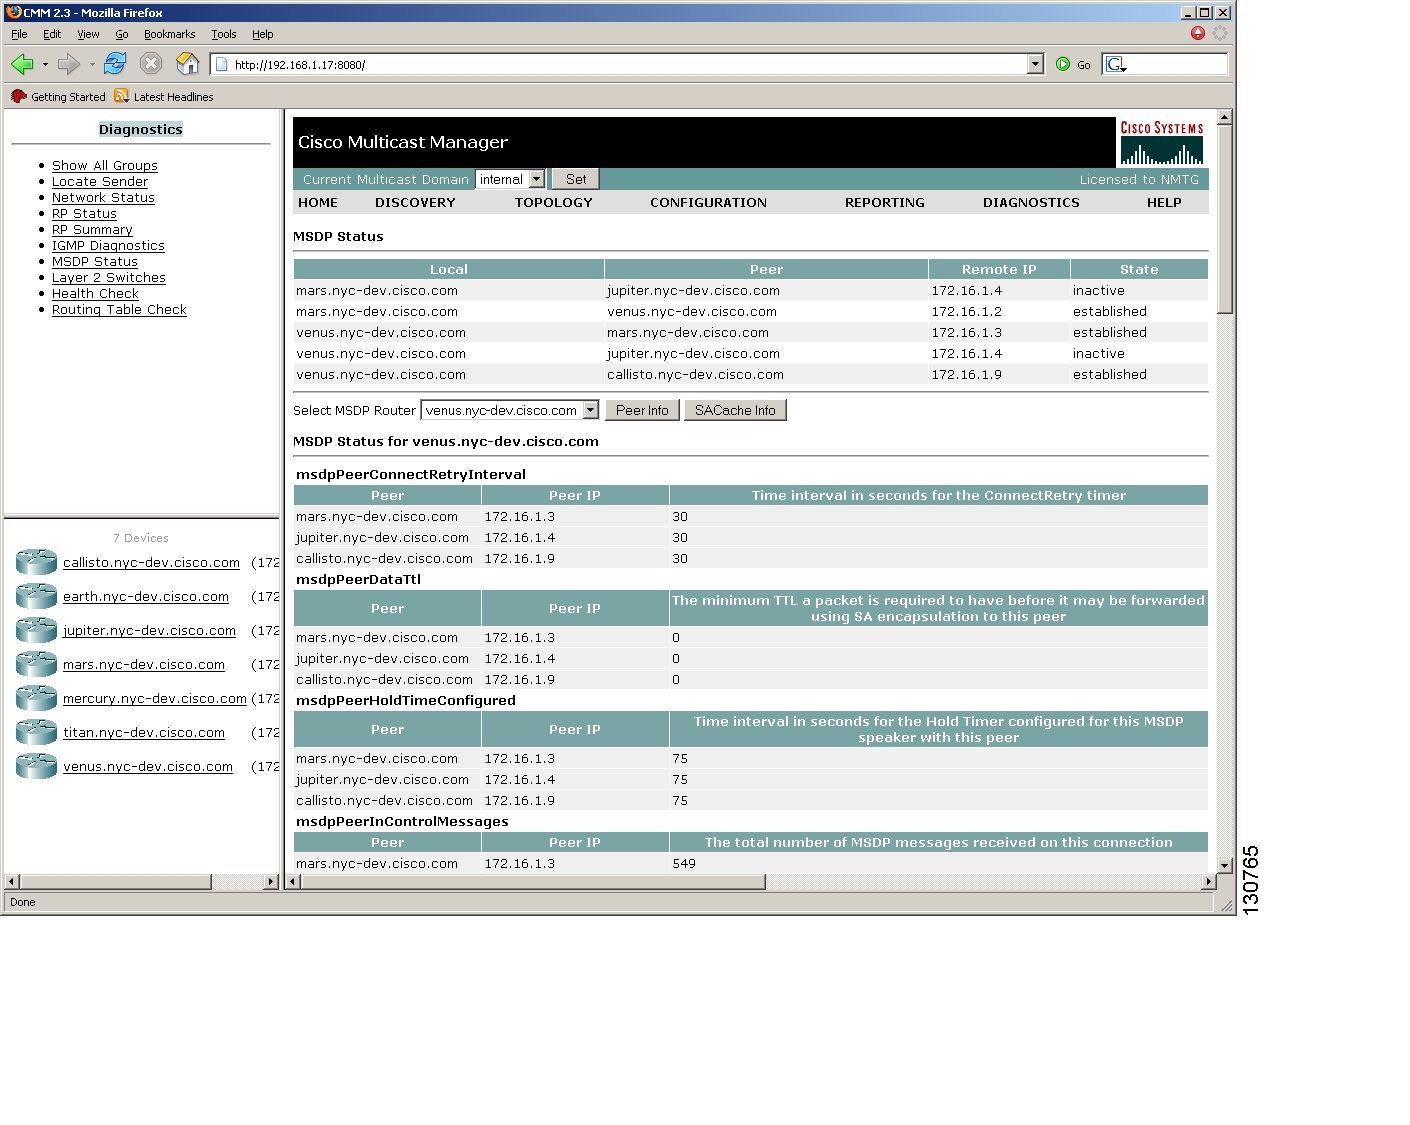
MSDP Status
The MSPD Status option, displays a table of MSDP peers. Peer Info, and SACache Info are also available for each RP shown in the "Select MSDP Router" drop down list.
Note
Figure 1-49
Layer 2 Switches
Layer 2 switches that have been added to the database can be queried from the screen shown below.
Note
The possible IP addresses which can be mapped to the MAC address are also shown.
Figure 1-50
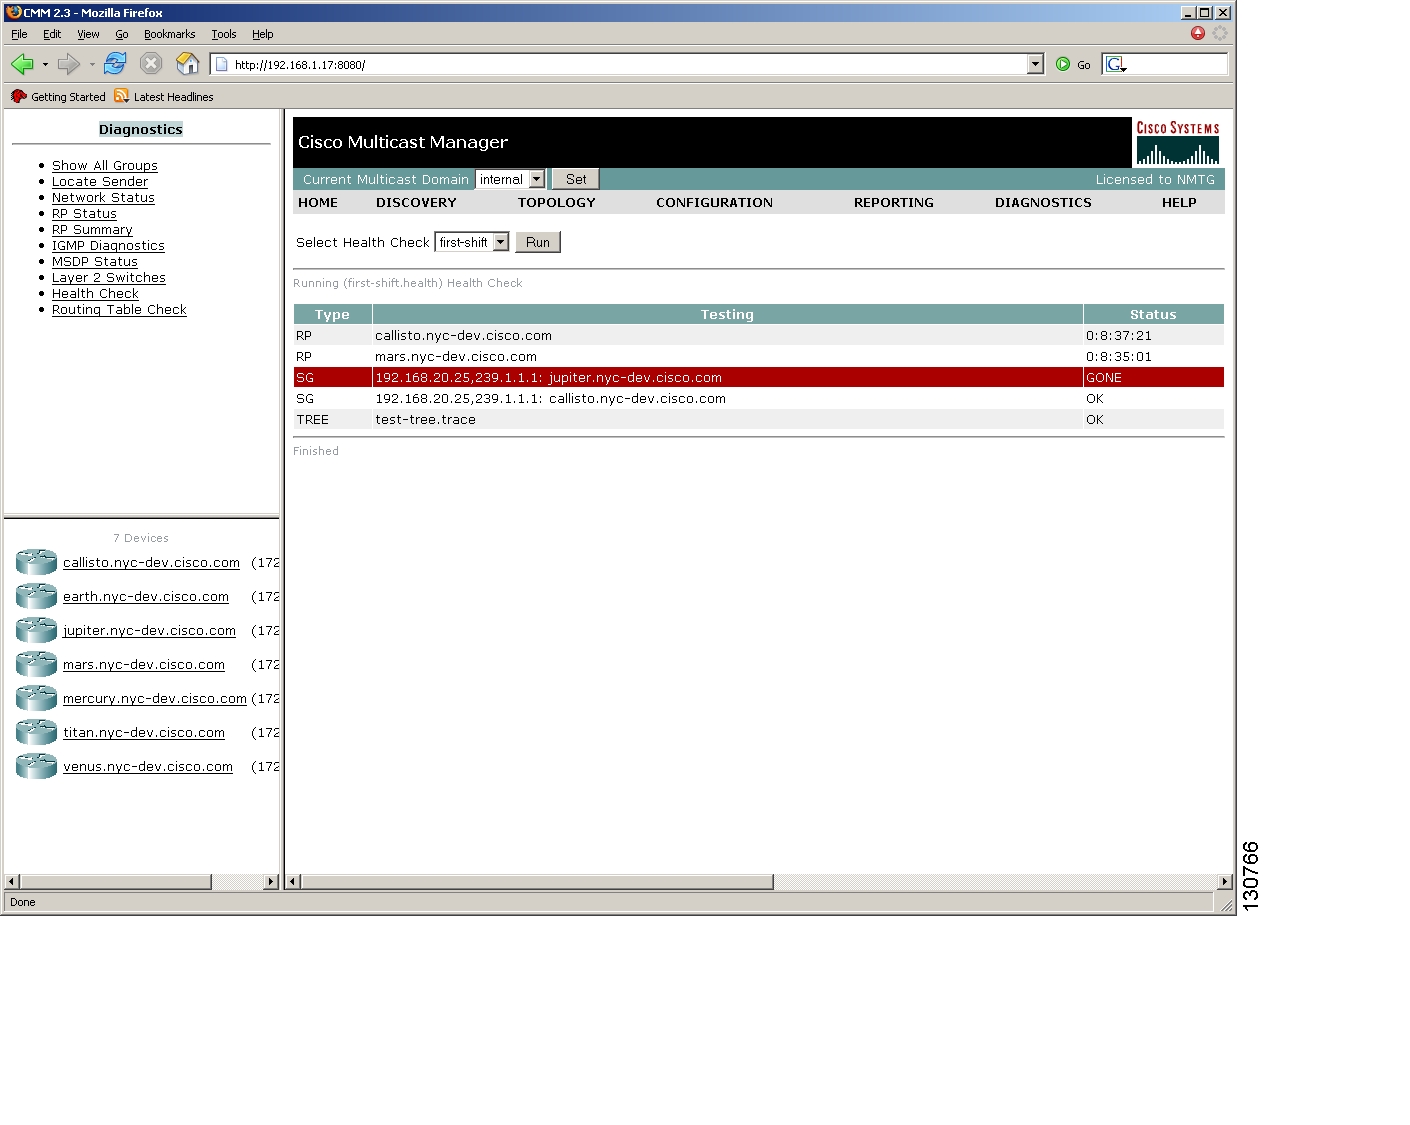
Health Check
Health checks are run on demand from the diagnostics section. To run a health check, simply select it from the drop down list and click "Run".
Figure 1-51
The health check that was run above shows that the RPs (venus and callisto) are up. MSDP peers can also be checked to see if they are established. This health check is also checking to see if the S,G (192.168.20.25,239.1.1.1) exists on several devices. As shown above, it does not exist on mars and venus. A forwarding tree was also checked. These trees are the same baselines that are available to be polled by the polling daemon. If the current tree is different from the baseline, the line is shown in red with a status of "Changed".
Routing Table Check
The routing table check screen allows a user to check one or several routing tables on demand.
Figure 1-52
Clicking "Run" after selecting a router, setting a CPU threshold, and selecting a routing table type will produce an output similar to the one above.
If a router's CPU utilization is above the set threshold, then a screen similar to the one shown below will be displayed.
Figure 1-53
If a change is detected, a link will be provided to view the report.
Router Diagnostics
The router diagnostics display is shown below.
Figure 1-54
This screen is similar to the "Show All Groups" screen, however, like all the other router specific screens, you can also enter show commands. Six links are also provided for quick diagnostics.
Multicast Information - shows multicast topology information for this router
IGMP Cache Entries - shows IGMP cache info for this router
Multicast Routing Table - shows the multicast routing table for this router
Process Utilization - via Telnet, shows the output from "sh proc cpu"
sh ip mroute - via Telnet, shows the output from "sh ip mroute"
shi ip mroute active - via Telnet, shows the output from "sh ip mroute active"
The selection of source and group is done the same as on the "Show All Groups" screen. It should be noted however, that the source and group drop down lists displayed here only show the sources and groups from the current router. Therefore, the lists shown here will probably be a subset of those from the "Show All Groups" screen, unless the current router is an RP.
Tracing of multicast forwarding trees is also done the same way as described above for "Show All Groups", except that the FHR defaults to the current router.
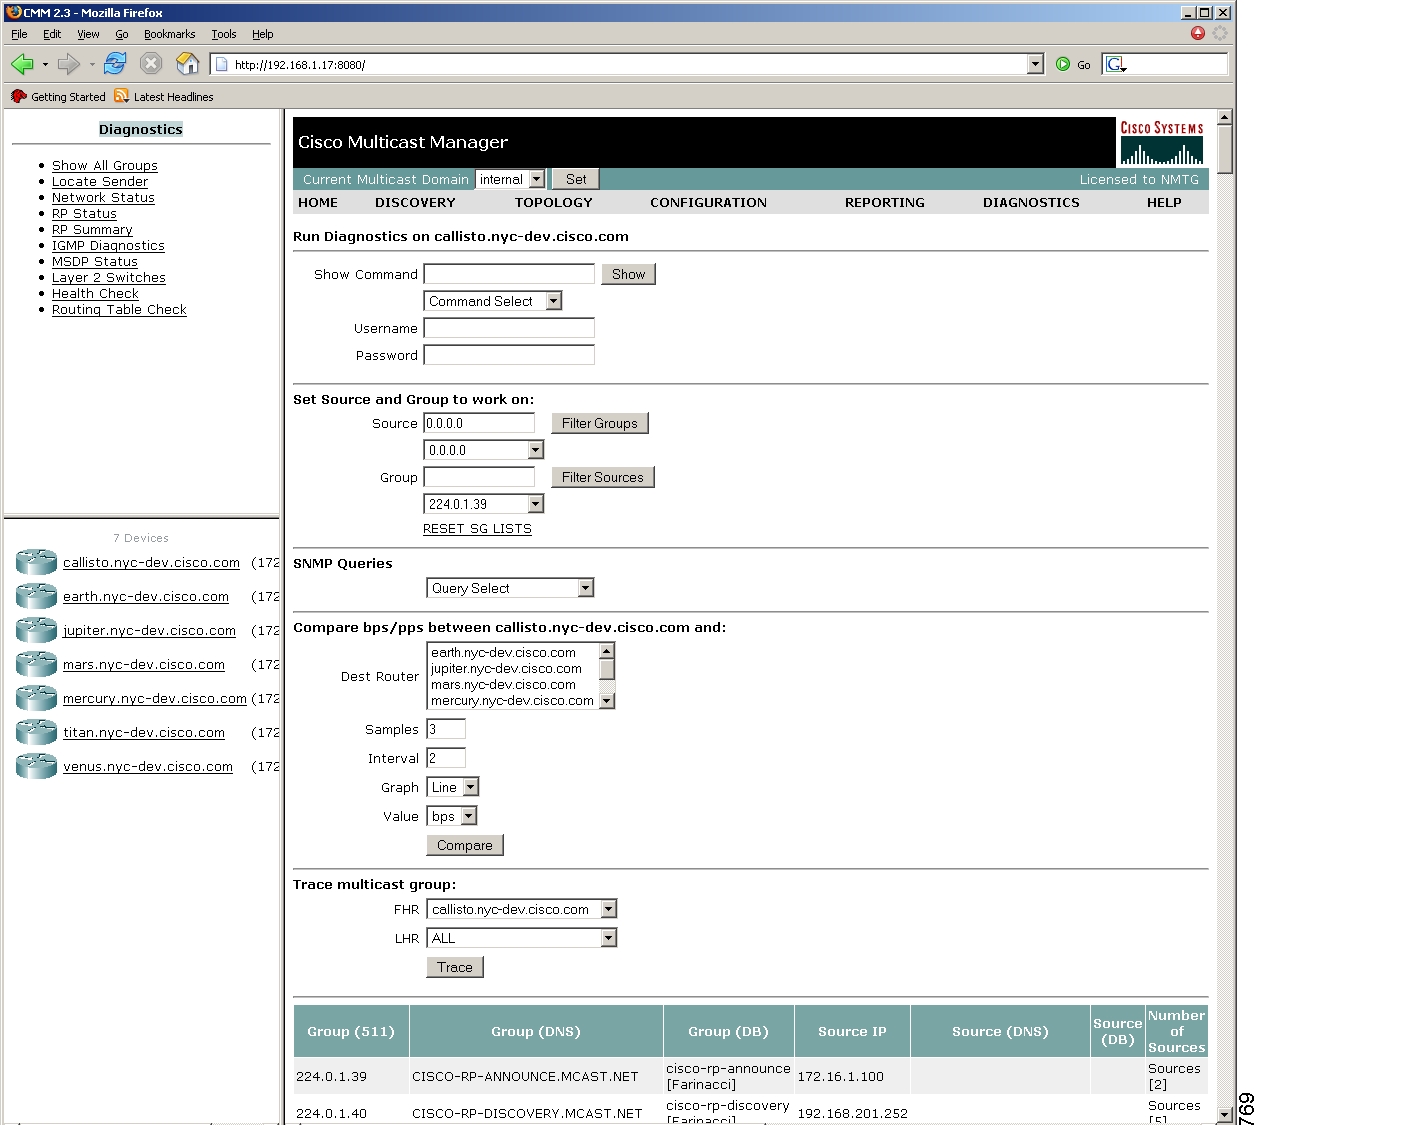
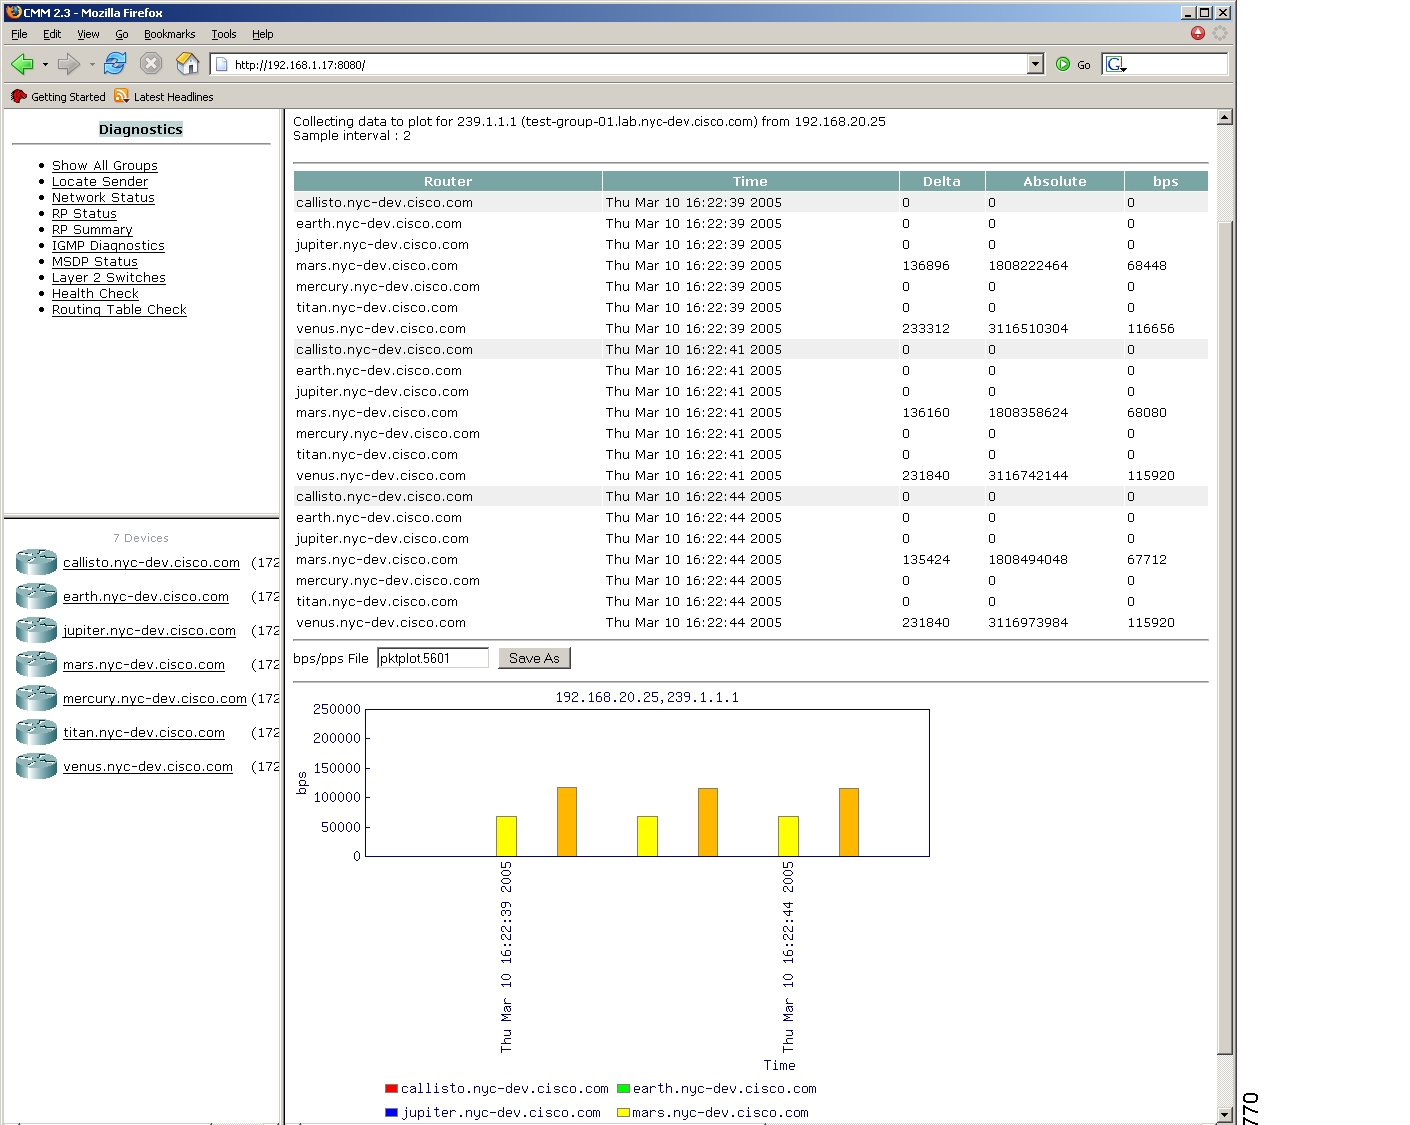
Compare bps/pps
The router diagnostics screen provides an option for comparing bps/pps between the current router, and any other routers in the multicast domain. Begin by selecting a source and group. Then select the routers to which you would like to compare bps/pps for the selected S,G. Set the number of samples (1-50) and sampling interval (1-90s), and click "Compare". The display will be similar to that shown for plotting bps/pps, except the table will have entries for multiple routers - the current one, and the routers selected from the "Dest Router" selection list. The graph will display multiple lines for comparison purposes.
Figure 1-55
Application Maintenance and Troubleshooting
This section contains information concerning the underlying operation of CMM and will be of most interest to the System Administrator that supports the application.
Configuration Files
Assuming the application is installed on Solaris, the directory location will be /opt/RMSMMT (on Linux it would be /usr/local/netman). Multicast domain configuration files are kept in /opt/RMSMMT/mmtsys/sys and named <domain>.mm.conf, where <domain> is the name of the multicast domain. The file is in the format of option=value. This file should not be edited manually. The polling daemon configuration files are also kept in this directory. The global polling configuration file is rmspoll.conf, and the domain specific files are rmspoll.<domain>.conf. Like the domain configuration files, these files should only be modified through the browser interface. The only time these files should be modified manually is with the assistance of RMS tech support.
Log Files
The /opt/RMSMMT/mmtsys/sys directory also contains two log files: events.log and rmspolld.log.events.log
The events.log file contains syslog type messages, shown below, that correspond to the SNMP traps sent by the polling daemon.
monlo:1082550198:172.16.1.9:1.3.6.1.2.1.31.1.1.1.2.10:0:10:631643:0:50
gone:1082550198:192.168.201.254:239.1.1.1:192.168.1.25:0:0:0:0
hi:1082550198:172.16.1.9:239.1.1.1:192.168.1.25:4116:92785:137:100
This file provides the information for the text-based reports provided by CMM. Depending on the polling interval, and number of objects being polled, this file may grow very quickly. It should be rotated along with all other syslog files on the server.
rmspolld.log
The rmspolld.log file contains log messages pertaining to the polling daemon.
04/23/2004 09:40:54 RMS Polling Agent v2.1(1) started successfully
04/23/2004 09:55:49 Exiting on SIGTERM
Apache Log Files
The Apache log files are located in /opt/RMSMMT/httpd_perl/logs. When troubleshooting the application, tailing the error_log file (tail -f error_log) will provide useful information. Additional application information can be logged to the error_log file by adding the line debug=1 to the <domain>.mm.conf file mentioned above.
Note
Databases
The database files used by CMM are located in /opt/RMSMMT/mmtsys/db. The topology database created by running discovery is <domain>.topo.db. The S,G cache, also created during discovery is <domain>.sg.db. The cache file is recreated when the polling daemon is running and polling the RPs. The lock files associated with each db file should never be manually removed. Removing these files could corrupt the databases.
Each domain also has a /opt/RMSMMT/mmtsys/db/<domain> directory associated with it. This directory contains the IOS versions (iosver.db) for the domain. Multicast forwarding tree baselines are also saved in this directory.
The IP address database (ipaddr.db) is also located in opt/RMSMMT/mmtsys/db.
Device Configurations
If TFTP is enabled on the server, and the SNMP read-write community string is supplied, then the application can download router configurations. The configurations are initially stored in the /tftpboot directory. If a configuration is saved from the "Display Router Config" screen, then a directory will be created (/opt/RMSMMT/configs/<device>) to hold the saved configurations.
Historical Data
PPS data collected by the polling daemon for S,G threshold polling and Layer 2 switch port polling, are stored in RRD files in /opt/RMSMMT/mmtsys/data.
Standard Multicast MIBs
Certain versions of IOS now support the standard based IPMROUTE and IGMP MIBs. The STDMIBS file in the /opt/RMSMMT/mmtsys/db controls which IOS versions the standard MIBs will be used for. The file currently contains the following entries:
# This file contains versions of IOS that use the standard multicast MIBs.12.3.*.*12.2.*.T*12.2.*.BC*Backups
To backup application specific data, the following directories should be included in any system backups:
/opt/RMSMMT/mmtsys/data/opt/RMSMMT/mmtsys/db/opt/RMSMMT/mmtsys/sys/opt/RMSMMT/configsPrior to performing backups, the /opt/RMSMMT/K98mmt script should be run to ensure that files are being changed while the backup is being performed.
Note
![]()
![]()
![]()
![]()
![]()
![]()
![]()
![]()
Posted: Wed Apr 20 03:11:52 PDT 2005
All contents are Copyright © 1992--2005 Cisco Systems, Inc. All rights reserved.
Important Notices and Privacy Statement.