The Configuration window allows you to commission or decommission any module. You can also provide text descriptions of the specific module, if desired.
The Module Configuration section covers the following topics:
Viewing the Module Configuration Window
Commissioning or Decommissioning a Module
Module Configuration Window—Detailed Description
Viewing the Module Configuration Window
To view the Module Configuration window:
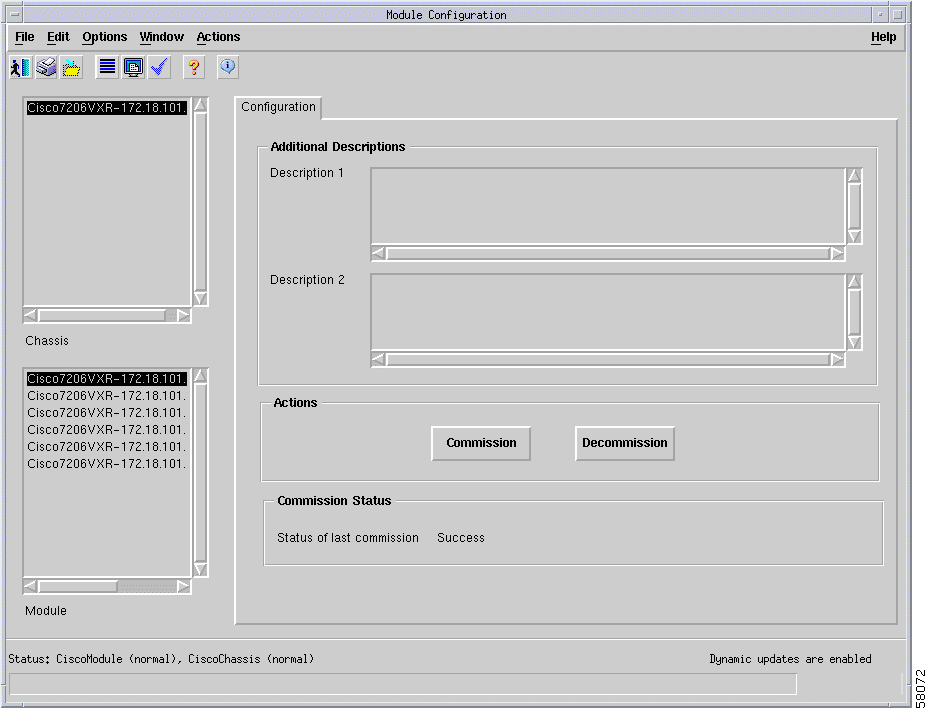
Step 1 Right-click a selected module, then choose CERM Management > Physical > Module > Configuration. The Configuration window appears (see Figure 4-1).
Figure 4-1 Module Configuration Window
Step 2 Make sure that the correct chassis and module are selected in the lists on the left side of the window.
Step 3 You can enter any descriptive text in the Description 1 and Description 2 areas, if required.
Commissioning or Decommissioning a Module
To commission or decommission a module:
Step 1 Choose the chassis and corresponding module you want to commission or decommission from the lists on the left side of the window.
Step 2 Click the corresponding Commission or Decommission button.
Commissioning
Commissioning a port adapter also commissions all objects under the port adapter, which includes all interfaces and ATM connections. Commissioning a supporting module commissions only that module.
Commissioning any module results in the following:
Heartbeat polling begins on the object
The state is changed to normal
Status data becomes available
Commissioning a port adapter results in the following:
All interfaces and ATM connections on the port adapter are also commissioned
Heartbeat polling begins on the port adapter, interfaces, and any ATM connections
The port adapter, active interfaces, and active ATM connections are placed in the normal state
Any interfaces or ATM connections that are predeployed, but not active, change to the errored state
Status data becomes available on the port adapter and interfaces
Decommissioning
Decommissioning any supporting module results in the following:
Heartbeat polling stops on the object
The state is changed to decommissioned
Status data is no longer available
Performance polling stops on the module (if enabled)
Decommissioning a port adapter results in the following:
All interfaces and ATM connections on the port adapter are also decommissioned
Heartbeat polling stops on the port adapter, interfaces, and ATM connections
The port adapter, interfaces, and ATM connections are placed in the decommissioned state
Status data is no longer available on the port adapter and interfaces
Performance polling stops on the port adapter and interfaces (if enabled)
Module Configuration Window—Detailed Description
The Module Configuration window has one tab: Configuration. The Configuration tab has three areas:
Additional Descriptions
Actions
Commission Status
Additional Descriptions
The Additional Descriptions area contains two description fields, where you can enter any descriptive text about the module, as desired.
Actions
The Actions area contains two buttons:
Commission—Commissions the selected module.
Decommission—Decommissions the selected module.
Commission Status
The Commission Status area provides the status of the last commission performed on the selected module. Possible values are Succeeded and Failed.
Module Fault Management
The Module Fault Management section covers the following topics:
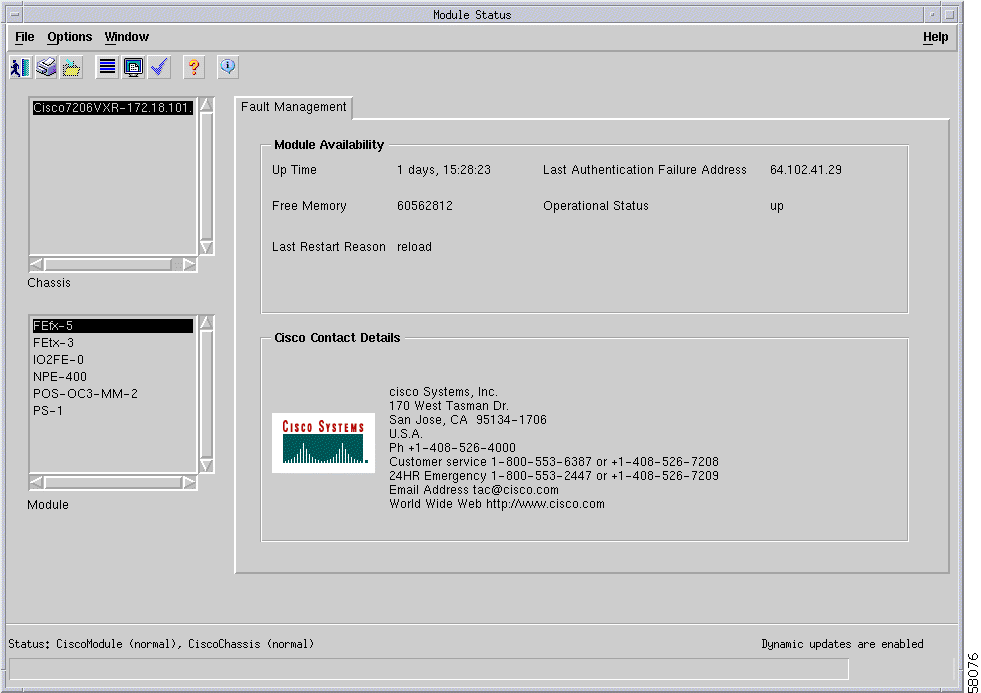
Step 1 Right-click a port adapter or supporting module, then choose CERM Management > Physical > Module > Fault Management. The Module Fault Management window appears (see Figure 4-2).
Figure 4-2 Module Fault Management Window
Step 2 Choose the relevant chassis and module from the list boxes on the left side of the window. The fault management information for the selected module appears.
The Module Fault Management window has one tab: Fault Management. The Fault Management tab has two areas: Module Availability and Cisco Contact Details.
Module Availability
The Module Availability area contains the following fields:
Up Time—Displays the time since the network portion of the system was last reinitialized for the selected module.
Free Memory—Displays the memory space (in bytes) currently unused by the selected module.
Last Restart Reason—Displays the reason for the system being reinitiated for the selected module.
Last Authentication Failure Address—Displays the last authentication failure IP address for the selected module.
Operational Status—Displays the current operational status of the selected module. Possible values are:
Up—Module is recognized by the device and is operational.
Down—Module is not recognized by the device or not enabled for operation.
Standby—Module is enabled and is acting as standby.
Cisco Contact Details
This area provides Cisco Systems, Inc. address information, with telephone and email contact details.
Module Performance
The Module Performance window allows you to view the current performance information for the selected module and to enable and disable performance logging.
The Module Performance section covers the following topics:
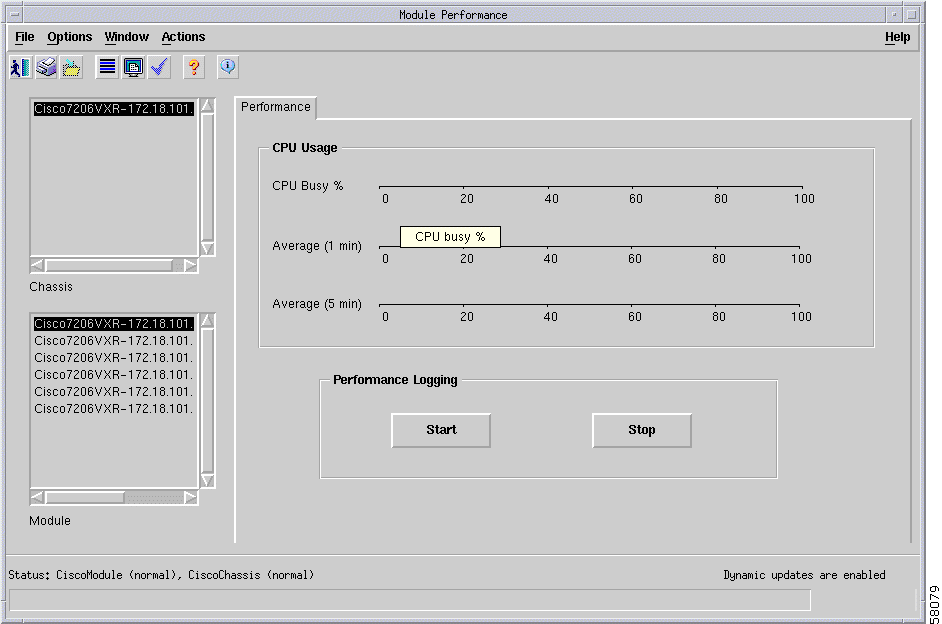
Step 1 Right-click a selected chassis or module, then choose CERM Management > Physical > Module > Performance.
The Module Performance window appears (Figure 4-3).
Figure 4-3 Module Performance Window
Step 2 Choose the relevant chassis and module from the list boxes on the left side of the window. The performance information for the selected module is displayed.
Note You might notice that port adapters and supporting modules are listed in the
module list box. Although port adapters and supporting modules are listed, no
performance data is available for them.
Enabling or Disabling Performance Logging
You can enable or disable performance logging on a selected module by clicking Start or Stop, respectively. For more details, see the "Performance Logging" section.
Module Performance Window—Detailed Description
The Module Performance window has one tab: Performance. The Performance tab has two areas: CPU Usage and Performance Logging.
CPU Usage
The CPU Usage area displays the following fields:
CPU Busy %—The percentage of CPU space put to use for the selected module.
Average (1 min)—The percentage of CPU memory being utilized, averaged over a one minute period, for the selected module.
Average (5 min)—The percentage of CPU memory being utilized, averaged over a five-minute period, for the selected module.
Performance Logging
The Performance Logging area allows you to start or stop performance logging:
Start—Click to enable performance logging for the selected module. Enabling performance logging allows performance data to be gathered for the selected module. Performance polling occurs every 15 minutes. Performance data is then gathered and stored for historical review. You can view current performance data in the performance windows, or you can view historical performance data in Performance Manager.
Note The Start button is not available if performance logging is already
enabled.
Stop—Click to stop all performance logging on the selected module. Disabling performance logging stops performance data from being gathered for the selected module.
Note The Stop function fails if performance logging is already
disabled.
Module Inventory
The Module Inventory section covers the following topics:
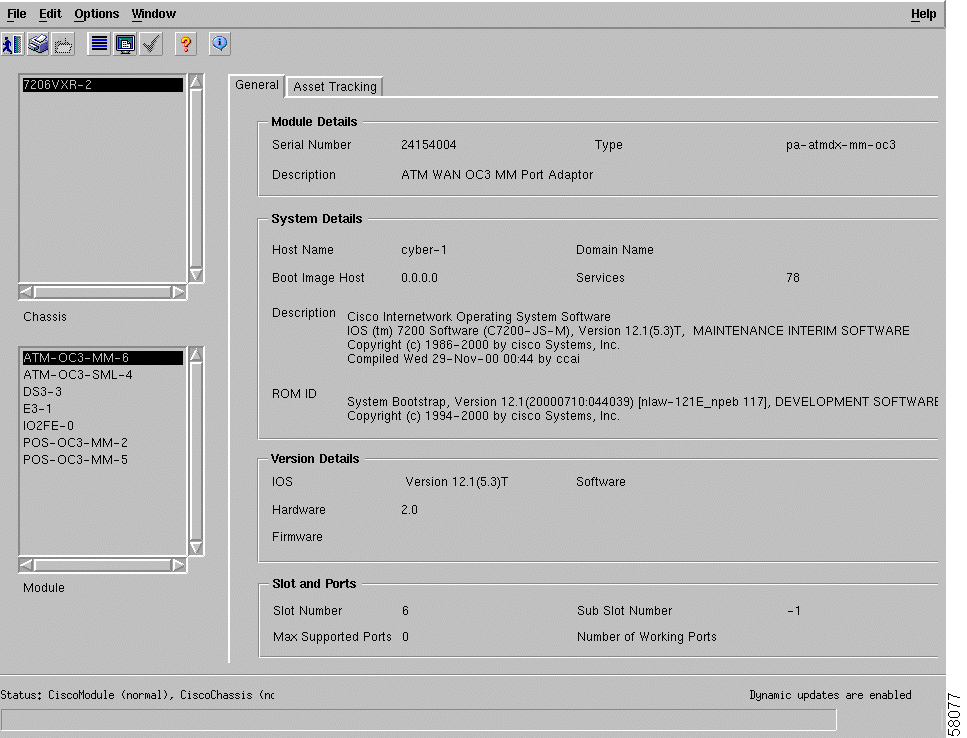
Step 2 Choose the relevant chassis and module from the list boxes on the left side of the window. The inventory information for the selected module is displayed.
Note The Module Inventory window is read-only.
Module Inventory Window—Detailed Description
The Module Inventory window has two tabs: General and Asset Tracking. Only the General tab is applicable to Cisco 7200/7400 Series Manager.
General
The General tab contains four areas:
Module Details
System Details
Version Details
Slot and Ports
Module Details
The Module Details area displays the following fields:
Serial Number—The serial number of the selected module. This number is zero if data is unavailable.
Description—A description of the selected module.
Type—The type of the selected module.
System Details
The System Details area displays the following fields:
Host Name—The host name of the system that contains the selected module.
Boot Image Host—The IP address of the host that supplies the software currently running.
Description—The hardware type, software operating system, and networking software of the system that contains the selected module.
ROM ID—The system boot trap description and version identifier.
Domain Name—The domain portion of the domain name for the system that contains the selected module.
Services—All the services available on the system.
Version Details
The Version Details area displays the following fields:
IOS—The IOS operating software version being used by the selected module.
Hardware—The version of the selected module.
Firmware—Not applicable to Cisco 7200/7400 Series Manager.
Software—The software version installed on the module. No information appears if data is not available.
Slot and Ports
The Slot and Ports area displays the following fields:
Slot Number—Slot position the module occupies in the chassis.
Max Supported Ports—Maximum number of ports supported on the module.
Sub Slot Number—Not applicable to Cisco 7200/7400 Series Manager.
Number of Working Ports—Not applicable to Cisco 7200/7400 Series Manager.