|
|

The CiscoWorks Blue Message Logger consists of a message log server and a message log client. The CiscoWorks Blue Process Manager automatically starts the message log server, which collects error messages from all the Maps and SNA View processes and stores them in the message log. The message log client lets you view the messages as they are logged. To start the message log client, use the cwb start MsgLogClient command:
/opt/CSCOcb/cwb start MsgLogClient
This command starts the message log client, which displays the Message Log Display window.
The following topics describe how to use the Message Logger:
You can view messages from the message log that meet the criteria defined for each view. A default view, called All, displays all the messages that are being logged. To define your own customized views, see the topic "Defining a Message View."
Step 1 From the command line, issue the cwb start MsgLogClient command. The Message Log Control window is displayed.
Step 2 Click the Log Display tab.
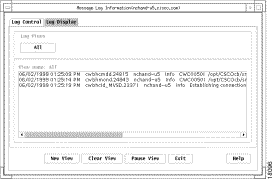
Step 3 In the Message Log Display window (Figure 6-1) click the button for the view you want to see. Click a view button to see the messages logged for that view. Click All to see all the logged messages.
The Message Log viewer comes with a default view named ALL that shows all messages being logged. You can use the New View window to create customized views that show limited amounts of data. For example, you might want to create a view that shows messages from only a small set of applications or that displays only selected key message fields.
You can define a set of customized message views. Each message view describes a set of criteria for selecting the messages you want to view and for determining how much information about each message you want to see.
For details about each field, see "Using the Message Log New View Window."
Step 1 From the command line, issue the cwb start MsgLogClient command. The Message Log Display window (Figure 6-1) is displayed.
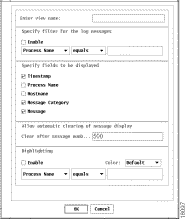
Step 2 In the Message Log Display window, click New View. The New View Display window (Figure 6-3) is displayed.
Step 3 In the Enter view name field, enter a name for this view. It should be short enough to fit on a view button.
Step 4 In the Specify filter for the log messages field, click Enable to enable filtering. Use the three following fields to create the message filter.
Step 5 Use the left field to specify the message characteristic that you want to filter.
Step 6 Use the center field to specify the message condition that you want to satisfy.
Step 7 Use the right field to specify the text that is the criteria of the filter.
Step 8 In the Specify fields to be displayed field, select the message elements that you want displayed for each message.
Step 9 In the Allow automatic clearing of message display field, specify the maximum number of messages that can accumulate in the message log for this view before the log is purged and new messages are logged.
Step 10 In the Highlighting field, click Enable to enable highlighting of messages that meet specified criteria. All messages that meet the criteria will be displayed in the selected color. Use the following three fields to create the highlighting criteria.
Step 11 Use the left field to specify the message characteristic that you want to filter.
Step 12 Use the center field to specify the message condition that you want to satisfy.
Step 13 Use the right field to specify the text that is the criteria of the filter.
Step 14 In the Color field, select the color to be used for highlighting.
Step 15 Click OK to save the view by name.
After you define a message view, that view appears as a button on the Message Log Display window.
After you define a series of message views, the Message Log Display window may become cluttered with view buttons. To remove some of the buttons, use the following procedure:
Step 1 In the Message Log Display window, click the button for the view that you want to delete. A large X appears at the upper right of the message display.
Step 2 Click the large X. The button for that view is deleted.
The Message Log Display tab (Figure 6-1) displays the accumulated messages from one message view.

The Message Log Display tab contains the following fields:
| Field | Description |
|---|---|
Main window | The main window area displays all the messages logged for the selected view. |
The buttons on the Message Log Display tab provide the following functions:
| Button | Description |
|---|---|
All | Displays all messages generated by the message categories enabled in the Log Control tab of the Message Log window. |
View N (up to 6) | Displays buttons for the new message views that you define in the New View window. |
New View | Displays the New View window, which allows you to specify criteria for the message to be displayed in the Log Display tab of the Message Log window. |
Clear View | Removes all of the currently displayed messages from the view. |
Pause View | Stops scrolling of the messages as they are received. New messages are still received but the list does not scroll in the view. |
Exit | Stops the Message Log client and closes the window. |
Help | Displays help information about the window. |
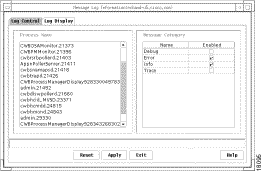
The Message Log Control tab (Figure 6-2) displays the names of all currently running Maps and SNA View applications, for which messages can be collected in the message log, and the message categories available for each application.

You can change which message levels are logged by default for each process by editing the runprocess command script or by changing them dynamically here.
Editing the runprocess script is described in "Commands and Processes."
The Message Log Control tab contains the following fields:
| Field | Description |
|---|---|
Application Name | Lists, by name, all the currently running Maps and SNA View applications. You can change which message levels are logged by each process by editing the runprocess command script or by changing them dynamically here. Editing the runprocess script is described in "Commands and Processes." |
Message Category | For the selected application, lists all valid message categories and whether they are enabled for display. The message categories available include the following: Debug---Useful when debugging a problem in conjunction with Cisco's Technical Assistance Center. Error---Generates messages when any operational error condition occurs. Warning---Generates messages when an error condition occurs that is not fatal. Info---Generates messages to notify you of status information. Trace---Generates detailed operational log messages. SNMP Trace---Generates detailed SNMP trace log messages. UITrace---Generates trace log messages from user interface. IPCTrace---Generates detailed log messages for socket operations and inter-process communication. Dump---Generates very detailed information. InternalTrace---Generates internal operational log messages. The Error, Warning, and Info message categories are enabled by default. To enable a message category, click Enable. Click Apply when finished. |
The buttons on the Message Log Control tab provide the following functions:
| Button | Description |
|---|---|
Reset | Resets each message category to its previous (Enabled or Disabled) state after you change its state. |
Apply | Executes changes that you have made to the messages categories (Enabled or Disabled). |
Exit | Stops the Message Log client and closes the window. |
Help | Displays information about the window. |
The Message Log New View window (Figure 6-3) lets you add a new view for the message log. The Message Log viewer comes with a default view named ALL, which shows all messages being logged. You can use the New View window to create customized views that show limited amounts of data. For example, you might want to create a view that shows messages from only a small set of applications or that displays only selected key message fields.

The Message Log New View window contains the following fields:
| Field | Description |
|---|---|
Enter view name | Enter a name to call this new view. This view name will appear on a button on the Message Log Display window. |
Specify filter for the log messages | Select Enable to enable filtering of messages in the message display. Use the left field to specify the characteristic you want to filter:
Use the center field to specify the message condition you want to satisfy:
Use the right field to specify the text that is the criteria of the filter. For example, to display messages with message categories that contain the word "error" (as in Error messages) you would select this item: Message Category contains error
|
Specify fields to be displayed | Specifies the fields in the message that you want displayed. Click the fields you want to include so they contain check marks. Deselect the fields you do not want displayed so they do not have check marks. |
Allow automatic clearing of message display | Lets you specify automatic clearing of the message log after a specified number of messages have accumulated. |
Highlighting | Select Enable to enable highlighting of messages in the message display. Use the left field to specify the characteristic you want to filter:
Use the center field to specify the message condition you want to satisfy:
Use the right field to specify the text that is the criteria of the filter: For example, to highlight messages with message categories that contain the word "error" (as in Error messages) you would select these items: Message Category contains error
|
The buttons on the New View window provide the following functions:
| Button | Description |
|---|---|
OK | Saves the view definition as a button on the Message Log Display tab. |
Cancel | Cancels the view definition and returns to the Message Log Display tab. |
Help | Displays information about the window. |
The CiscoWorks Blue messages are logged in message log files stored in the /opt/CSCOcb/logs directory. Each message log file name is in the format cwblogger.log.X, where X is either 0 or 1. Look at the time stamp to find the most recent log file. You can view these message log files with any editor or file browser (such as the more command) . This file wraps at 10000 messages.
When the Message log server is stopped and restarted, it begins logging messages in the log file that contains the oldest messages.
![]()
![]()
![]()
![]()
![]()
![]()
![]()
![]()
Posted: Thu Sep 9 08:57:10 PDT 1999
Copyright 1989-1999©Cisco Systems Inc.