|
|

Table Of Contents
Alarm Monitoring and Management
Alarms, Conditions, and History
Virtual Wires for External Alarms in Mixed Networks
Alarm Monitoring and Management
This chapter explains how to manage alarms with Cisco Transport Controller (CTC), which includes:
•
Overview
•
•
To troubleshoot specific alarms, see the Cisco ONS 15600 SDH Troubleshooting Guide.
11.1 Overview
CTC detects and reports SDH alarms generated by the CiscoONS15600SDH and the larger SDH network. You can use CTC to monitor and manage alarms in the card, node, or network level. Default alarm severities conform to the ITU-T G.783 standard, but you can reset alarm severities in customized alarm profiles or suppress CTC alarm reporting. For a detailed description of the standard Telcordia categories employed by ONS nodes, see the Cisco ONS 15600 SDH Troubleshooting Guide.
Note
11.2 Alarms, Conditions, and History
In the card, node, or network-level CTC view, click the Alarms tab to display the alarms for that card, node or network. The Alarms window shows alarms in conformance to ITU-T G.783. This means that if a network problem causes two alarms, such as loss of frame (LOF) and loss of signal (LOS), CTC only shows the LOS alarm in this window because it supersedes the LOF.
Table11-1 describes in the information in the Alarms window.
Table 11-1 Alarms Column Descriptions
Num
A count of incrementing alarm messages (hidden by default)
Ref
Reference number assigned to a cleared alarm (hidden by default)
New
Indicates a new alarm if checked1
Date
Date and time of the alarm
Object
TL1 access identifier (AID) for the alarmed object
Eqpt Type
Card type in this slot
Slot
Slot where the alarm occurred (appears in the network view and node view)
Port
Port where the alarm occurred
Sev
Severity level: Critical (CR), Major (MJ), Minor (MN), Not Alarmed (NA), Not Reported (NR)
ST
Status: Raised (R), Clear (C), Transient (T)
SA
When checked, indicates a service-affecting alarm
Cond
Error message/alarm name; alphabetically defined in the CiscoONS15600SDHTroubleshootingGuide
Description
Description of the alarm
Node
Node where the alarm occurred (only displayed in network view)
1 The user can click the Synchronize button to acknowledge the new alarm. Clicking the Delete Cleared Alarms button only deletes cleared alarm on the window.
Figure11-1 shows the CTC node view Alarms window.
Figure 11-1 Viewing Alarms in CTC Node View
Alarms and conditions appear in one of five background colors, listed in Table11-2, to communicate severity.
Software Release 1.4 has more numbered synchronous transfer module (STM) and Virtual Container (VC) alarm object identifiers based upon the object IDs. The numbering of the monitored (MON) object that tripped the alarm is in the format VC4-<Slot>-<Port>-<VC_within_port>. For example, with a VC4, Slot 6, Port 1, and VC4 6, the VC AID would be VC4-6-1-6.
11.2.1 Alarm Window
Table11-3 shows the actions you can perform in the Alarms window.
11.2.2 Alarm-Affected Circuits
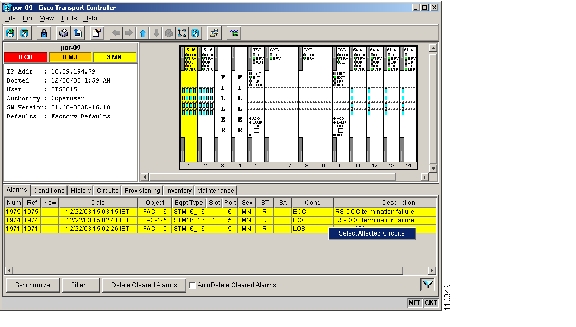
You can determine which ONS15600SDH circuits are affected by a specific alarm by positioning the cursor over the alarm in the Alarm window and right-clicking. A shortcut menu appears ( Figure11-2).
Figure 11-2 Select the Affected Circuits Option for an Alarm
When the user selects the Select Affected Circuits option, the Circuits window appears to show the circuits that are affected by the alarm ( Figure11-3).
Figure 11-3 Alarm-Affected Circuit Appears
11.2.3 Conditions Window
The Conditions window displays retrieved fault conditions. A condition is a fault or status detected by ONS15600SDH hardware or software. When a condition occurs and continues for a minimum period of time, CTC raises a condition, which is a flag showing that this particular condition currently exists on the ONS15600SDH.
The Conditions window shows all conditions that occur, including those that are superseded by alarms. For instance, if a network problem causes two alarms, such as LOF and LOS, CTC shows both the LOF and LOS conditions in this window. Having all conditions visible can be helpful when troubleshooting the ONS15600SDH. If you want to retrieve conditions that obey a root-cause hierarchy (that is, LOS supersedes and replaces LOF), you can exclude the same root causes.
Fault conditions include reported alarms and not-reported or not-alarmed conditions. See the trouble notifications information in the Cisco ONS 15600 SDH Troubleshooting Guide for more information about alarm and condition classifications.
11.2.4 Conditions Window Actions
Table11-4 shows the actions you can perform in the Conditions window.
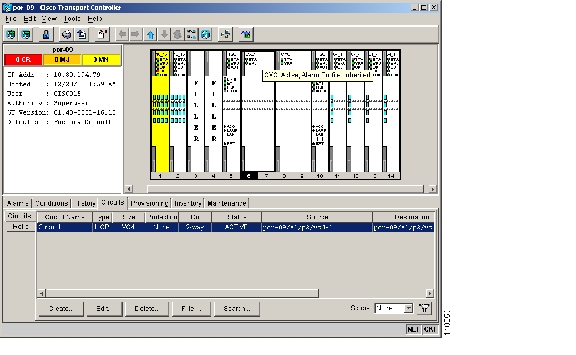
The current set of all existing conditions maintained by the alarm manager appears when you click the Retrieve button. The set of conditions retrieved is relative to the view. For example, if you click the button in the node view, node-specific conditions appear ( Figure11-4). If you click the Retrieve button in the network view, all conditions for the network (including ONS15600SDH nodes and other connected nodes such as ONS15454) appear, and the card view shows only card-specific conditions.
Figure 11-4 Viewing Conditions in the Conditions Window
Table11-5 lists the Conditions window column headings and the information recorded in each column.
11.2.5 History Window
The History window displays historical alarm data. It also displays conditions, which are not-alarmed activities such as timing changes and threshold crossings. For example, protection-switching events or performance-monitoring threshold crossings appear here. The ONS15600SDH can store up to 3,000total alarms and conditions: 750 critical alarms, 750 major alarms, 750 minor alarms, and 750conditions. When the limit is reached, the ONS15600SDH begins replacing the oldest items. The History window presents several alarm history views:
•
•
•
Note
Tip
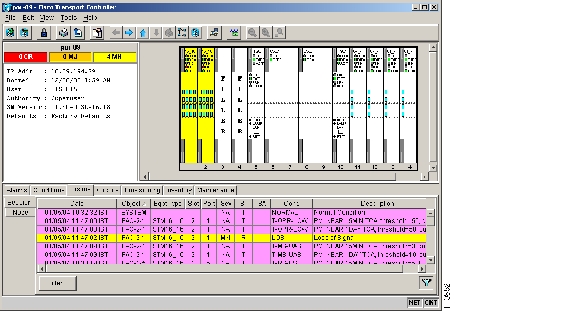
Figure 11-5 Viewing All Alarms Reported for Current Session
Table11-6 describes the information in the History window.
11.2.6 Alarm History Actions
You can retrieve and view the history of alarms and conditions, as well as transients (passing notifications of processes as they occur) in the CTC history window. The information in this window is specific to the view where it is shown (that is, network history in the network view, node history in the node view, and card history in the card view).
The node and card history views are each divided into two tabs. In node view, when you click the Retrieve button, you can see the history of alarms, conditions, and transients that have occurred on the node in the History>Node window, and the history of alarms, conditions, and transients that have occurred on the node during your login session in the History>Session window. When you retrieve the card history, you can see the history of alarms, conditions, and transients on the card in the History>Card window, or a history of alarms, conditions, and transients that have occurred during your login session in the History>Session window.
You can also filter the severities and occurrence period in these history windows, but you cannot filter out not-reported conditions or transients.
11.3 Alarm Profiles
The alarm profiles feature allows you to change default alarm severities by creating unique alarm profiles for individual ONS15600SDH ports, cards, or nodes. A created alarm profile can be applied to any node on the network. Alarm profiles can be saved to a file and imported elsewhere in the network, but the profile must be stored locally on a node before it can be applied to the node, cards, or ports.
CTC can store up to ten active alarm profiles at any time to apply to the node. Custom profiles can take eight of these active profile positions, and two are reserved by CTC. The reserved Default profile contains ITU-T G.783 severities. The reserved Inherited profile allows port alarm severities to be governed by the card-level severities or card alarm severities to be determined by the node-level severities.
If one or more alarm profiles have been stored as files from elsewhere in the network onto the local PC or server hard drive where CTC resides, you can utilize as many profiles as you can physically store by deleting and replacing them locally in CTC so that only eight are active at any given time.
11.3.1 Alarm Profile Window
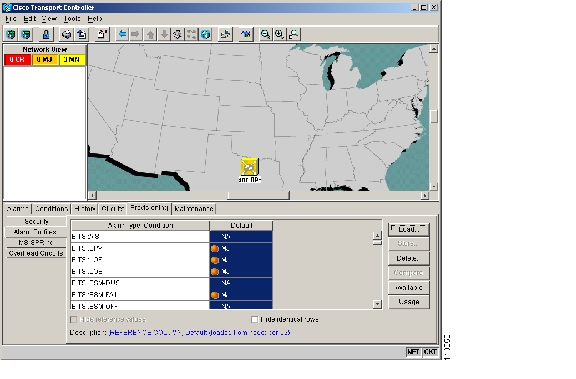
Alarm profiles are created in the network view using the Provisioning > Alarm Profiles tabs ( Figure11-6). A default alarm profile (in the Default column) is preprovisioned for every alarm. After loading the default profile on the node, you can use the Clone feature to create new profiles based on the default alarm profile. After the new profile is created, the Alarm Profiles window shows the default profile and the new profile.
Figure 11-6 Alarm Profiles Window Showing the Default Profiles of Listed Alarms
11.3.2 Alarm Profile Buttons
The Alarm Profiles window has six buttons on the right side. Table11-7 describes each of the alarm profile buttons.
11.3.3 Alarm Profile Editing
Table11-8 describes the five profile-editing options available when you right-click an alarm item in the profile column (such as Default).
11.3.4 Alarm Severity Option
To change or assign alarm severity, left-click the alarm severity you want to change in the alarm profile column. Seven severity levels appear for the alarm:
•
•
•
•
•
•
•
Transient and Unset only appear in alarm profiles. They do not appear when you view alarms, history, or conditions.
11.3.5 Row Display Options
In the network view, the Alarm Profiles window has two check boxes at the bottom of the window:
•
•
11.3.6 Alarm Profile Applications
In CTC node view, the Alarm Behavior window displays alarm profiles for the node, and in card view the Alarm Behavior window displays the alarm profiles for the selected card. Alarm profiles form a hierarchy. A node-level alarm profile applies to all cards in the node except cards that have their own profiles. A card-level alarm profile applies to all ports on the card except ports that have their own profiles.
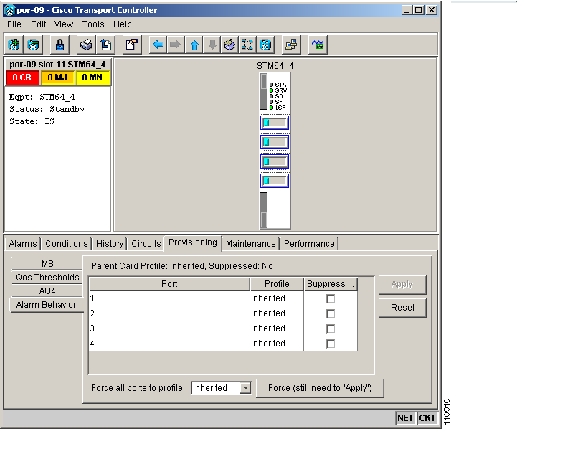
At the node level, you can apply profile changes on a card-by-card basis or set a profile for the entire node. At the card-level view, you can apply profile changes on a port-by-port basis for all ports on that card. Figure11-7 shows the STM64L41550 card view of an alarm profile.
Figure 11-7 Alarm Profile on the STM64 L4 1550 Card
11.4 Alarm Filter
Alarm display can be filtered to keep particular alarm severities, or alarms that occur between certain dates, from appearing in the Alarms window ( Figure11-2). You can set the parameters of the filter by clicking the Filter button at the bottom-left of the Alarms window. You can turn the filter on or off by clicking the Filter icon button at the bottom-right of the window. CTC retains your filter activation setting. For example, if you turn the filter on and then log out, CTC makes the filter active the next time your user ID is activated.
11.5 Alarm Suppression
The ONS15600SDH has suppression options that prevent node, slot, chassis, or port alarms from appearing in the Alarms window. Suppression changes the entity alarm to Not-Reported, so suppressed alarms are shown in the Conditions window. The suppressed alarms are shown with their other visual characteristics (service-affecting status and color-coding) in the window. These alarms do not appear in the History window or in any other clients.
In node view, you can suppress all alarms for a node, one or more card slots, fan slots, noncard objects such as the chassis, or the customer access panel (CAP). In the card view, you can suppress alarms on a port-by-port basis. All alarms for the entity are suppressed. For example, if you click the SuppressAlarms check box in node view, all node alarms appear in the Conditions window rather than the Alarms window. If you suppress alarms for one or more slots or ports, alarms for those entities appear in the Conditions window.
Note
11.6 External Alarms and Controls
External alarm inputs are used for external sensors such as open doors and flood sensors, temperature sensors, and other environmental conditions. External control outputs allow you to drive external visual or audible devices such as bells and lights. They can control other devices such as generators, heaters, and fans.
You provision external alarms and controls in the node view Provisioning or Maintenance > AlarmExtenders window. Up to 16 external alarm inputs and 16 external controls are available. The external input/output contacts are located on the CAP attached to the ONS15600SDH backplane.
11.6.1 External Alarm Input
You can provision each alarm input separately. Provisionable characteristics of external alarm inputs include:
•
•
•
•
•
11.6.2 External Control Output
You can provision each alarm output separately. Provisionable characteristics of alarm outputs include:
•
•
•
•
•
•
•
11.6.3 Virtual Wires for External Alarms in Mixed Networks
Virtual wires route external alarms to one or more alarm collection centers in a network. External alarms can be assigned to virtual wires in the ONS15600SDH-only network or in mixed networks containing ONS15600s, ONS15454s, and ONS15327s. You can view virtual wires in the CTC node view Maintenance > Alarm Extenders > Virtual Wires window.
When using virtual wires, you can:
•
•
The ONS15600SDH supports 16 virtual wires.
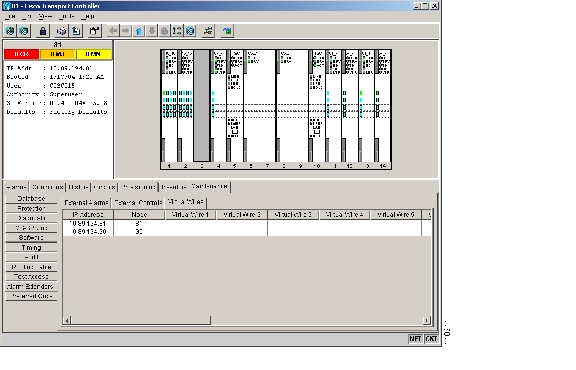
Figure11-8 shows an ONS15600SDH Virtual Wires window with a DCC connection to an ONS15454 node. The ONS15600SDH Virtual Wires window shows 10 virtual wire columns, but 16 are available. The first 12 are available for other ONS15600SDHs. Only the last four are available for the ONS15454, because it can only support four virtual wires.
Figure 11-8 Virtual Wires Seen from an ONS 15600 SDH
11.7 Audit Trail
The ONS15600SDH keeps a human-readable audit trail of all system actions, such as circuit creation or deletion, and security events such as login and logouts. You can archive this log in text form on a PC or network. Access the log by clicking the Maintenance > Audit tabs. The log capacity is 640 entries; when this limit is reached, the oldest entries are overwritten with new events. When the log is 80 percent full, an AUD-LOG-LOW condition is raised. When the log is full and entries are being overwritten, an AUD-LOG-LOSS condition occurs.
![]()
![]()
![]()
![]()
![]()
![]()
![]()
![]()
Posted: Fri Feb 27 18:29:13 PST 2004
All contents are Copyright © 1992--2004 Cisco Systems, Inc. All rights reserved.
Important Notices and Privacy Statement.