|
|

Table Of Contents
DLP-G131 Refresh PM Counts at 15-Minute Intervals
DLP-G132 Refresh PM Counts at One-Day Intervals
DLP-G133 View Near-End PM Counts
DLP-G134 View Far-End PM Counts
DLP-G135 Reset Current PM Counts
DLP-G136 Clear Selected PM Counts
DLP-G410 Clear All PM Thresholds
DLP-G137 Set the Auto-Refresh Interval for Displayed PM Counts
DLP-G138 Refresh PM Counts for a Different Port
NTP-G74 Monitor DWDM Card Performance
DLP-G139 View PM Parameters for OSCM and OSC-CSM cards
DLP-G140 View Power Statistics for Optical Amplifier Cards
DLP-G276 View Optical Power Statistics for 4MD-xx.x Cards
DLP-G142 View Power Statistics for AD-1C-xx.x, AD-2C-xx.x, and AD-4C-xx.x Cards
DLP-G143 View Power Statistics for AD-1B-xx.x and AD-4B-xx.x Cards
NTP-G75 Monitor Transponder and Muxponder Performance
DLP-G390 View Ethernet Statistic PM Parameters for GE_XP and 10GE_XP Cards
DLP-G391 View Ethernet Utilization PM Parameters for GE_XP and 10GE_XP Cards
DLP-G392 View Ethernet History PM Parameters for GE_XP and 10GE_XP Cards
DLP-G393 Refresh Ethernet PM Counts at a Different Time Interval for GE_XP and 10GE_XP Cards
DLP-G146 View Optics PM Parameters
DLP-G147 View Payload PM Parameters
DLP-G148 View OTN PM Parameters
DLP-G149 View Payload Statistics PM Parameters
DLP-G150 View Payload Utilization PM Parameters
DLP-G151 View Payload History PM Parameters
DLP-G152 View Payload SONET/SDH PM Parameters
Monitor Performance
This chapter explains how to enable and view performance monitoring (PM) statistics for the Cisco ONS 15454. PM parameters are used by service providers to gather, store, set thresholds, and report performance data for early detection of problems. For more PM information, details, and definitions, refer to the Cisco ONS 15454 DWDM Reference Manual.
Note
Unless otherwise specified, "ONS 15454" refers to both ANSI and ETSI shelf assemblies.
Before You Begin
Before performing any of the following procedures, investigate all alarms and clear any trouble conditions. Refer to the Cisco ONS 15454 DWDM Troubleshooting Guide as necessary.
This section lists the chapter procedures (NTPs). Turn to a procedure for applicable tasks (DLPs).
1.
2.
3.
Note
NTP-G73 Change the PM Display
Purpose
This procedure enables you to change the appearance of PM counts by selecting drop-down list or radio button options in the Performance window.
Tools/Equipment
None
Prerequisite Procedures
Before you monitor performance, be sure you have created the appropriate circuits and provisioned the card according to your specifications. For more information, see "Create Optical Channel Circuits and Provisionable Patchcords," "Provision Transponder and Muxponder Cards," and Chapter 11, "Change DWDM Card Settings."
Required/As Needed
As needed
Onsite/Remote
Onsite or remote
Security Level
Retrieve or higher
Step 1
Step 2
•
•
•
•
•
•
•
•
Stop. You have completed this procedure.
DLP-G131 Refresh PM Counts at 15-Minute Intervals
Step 1
Step 2
Step 3
Note
Step 4
Step 5
Step 6
Step 7
Step 8
Each monitored performance parameter has corresponding threshold values for the current time period. If the value of the counter exceeds the threshold value for a particular 15-minute interval, a threshold crossing alert (TCA) is raised. The number represents the counter value for each specific PM parameter.
Step 9
Note
Step 10
DLP-G132 Refresh PM Counts at One-Day Intervals
Step 1
Step 2
Step 3
Note
Step 4
Step 5
Step 6
Step 7
Each monitored performance parameter has corresponding threshold values for the current time period. If the value of the counter exceeds the threshold value for a particular 1-day interval, a TCA is raised. The number represents the counter value for each specific PM parameter.
Step 8
Note
Step 9
DLP-G133 View Near-End PM Counts
Step 1
Step 2
Step 3
Note
Step 4
Step 5
Step 6
Step 7
Step 8
Step 9
DLP-G134 View Far-End PM Counts
Note
Step 1
Step 2
Step 3
Note
Step 4
Step 5
Step 6
Step 7
Step 8
Step 9
DLP-G135 Reset Current PM Counts
Step 1
Step 2
Step 3
Note
Step 4
Note
Step 5
Note
Step 6
Step 7
DLP-G136 Clear Selected PM Counts
Caution
Step 1
Step 2
Step 3
Note
Step 4
Note
Step 5
Step 6
•
•
•
Step 7
Step 8
Step 9
DLP-G410 Clear All PM Thresholds
Caution
Step 1
Step 2
Step 3
Step 4
Step 5
Step 6
Step 7
DLP-G137 Set the Auto-Refresh Interval for Displayed PM Counts
Step 1
Step 2
Step 3
Note
Step 4
Step 5
•
•
•
•
•
•
Step 6
Depending on the selected auto-refresh interval, the displayed PM counts automatically update when each refresh interval completes. If the auto-refresh interval is set to None, the PM counts that appear are not updated unless you click Refresh.
Step 7
DLP-G138 Refresh PM Counts for a Different Port
Step 1
Step 2
Step 3
Step 4
Step 5
NTP-G74 Monitor DWDM Card Performance
Purpose
This procedure enables you to view, transmit, and receive performance information for OSCM, OSC-CSM, 32MUX-O, 32DMX, 32DMX-O, 32DMX-L, 40-MUX-C, 40-DMX-C, 40-WSS-C, 40-WXC-C, 4MD-xx.x, AD-xC-xx.x, AD-xB-xx.x, 32WSS, 32WSS-L, OPT-BST, OPT-PRE, OPT-BST-L, OPT-AMP-L, and OPT-AMP-17-C cards and ports during selected time intervals to detect possible performance problems.
Tools/Equipment
None
Prerequisite Procedures
Before you monitor performance, be sure you have created the appropriate circuits and provisioned the card according to your specifications. For more information, see "Create Optical Channel Circuits and Provisionable Patchcords" and Chapter 11, "Change DWDM Card Settings."
Required/As Needed
As needed
Onsite/Remote
Onsite or remote
Security Level
Retrieve or higher
Step 1
Step 2
•
•
•
•
•
Note
Stop. You have completed this procedure.
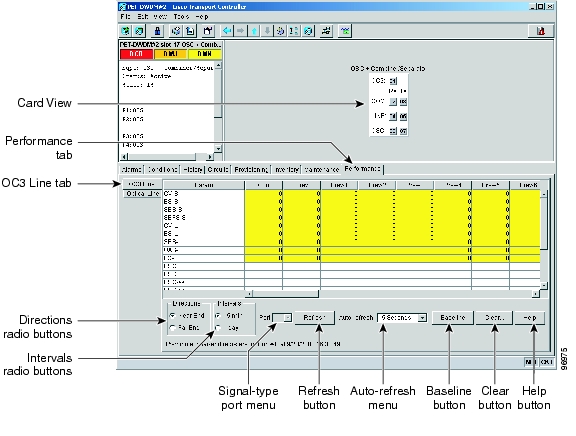
DLP-G139 View PM Parameters for OSCM and OSC-CSM cards
Step 1
Step 2
Figure 8-1 OC3 Line Tab in the Optical Service Channel Card View Performance Window
Step 3
Step 4
Step 5
•
•
•
•
•
•
Step 6
Step 7
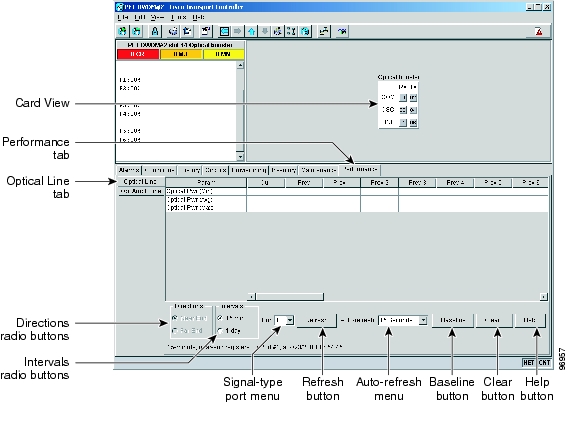
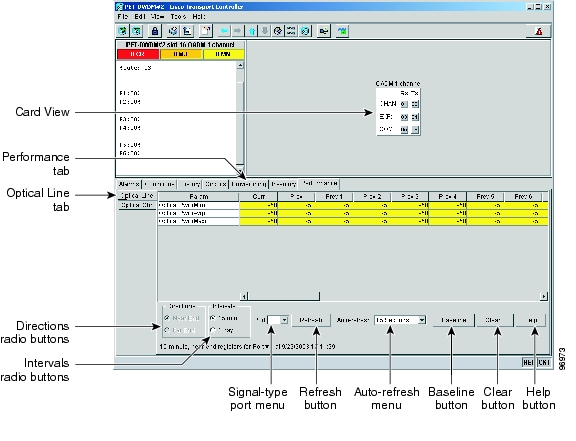
DLP-G140 View Power Statistics for Optical Amplifier Cards
Step 1
Step 2
Figure 8-2 Optical Line Tab in the Optical Amplifier Card View Performance Window
Step 3
•
–
–
–
•
–
–
–
•
–
–
–
•
–
–
–
–
–
•
–
–
–
Step 4
Step 5
Step 6
•
•
•
Step 7
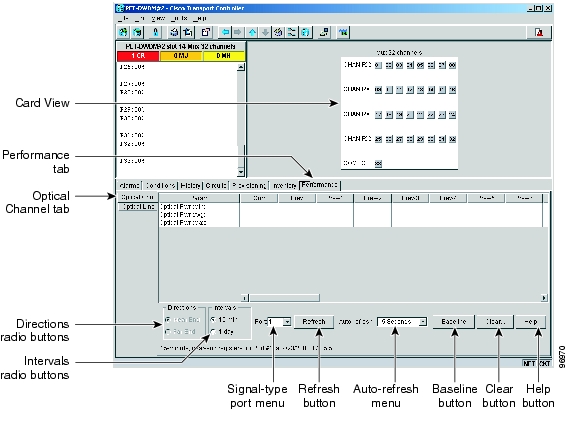
DLP-G141 View Optical Power Statistics for 32MUX-O, 32WSS, 32WSS-L, 32DMX-O, 32DMX, 32DMX-L, 40-WSS-C, 40-WXC-C, 40-MUX-C, and 40-DMX-C Cards
Step 1
Step 2
Figure 8-3 Optical Channel Tab in the Multiplexer/Demultiplexer Card View Performance Window
Step 3
•
•
•
•
•
•
•
Step 4
Step 5
Step 6
Step 7
Step 8
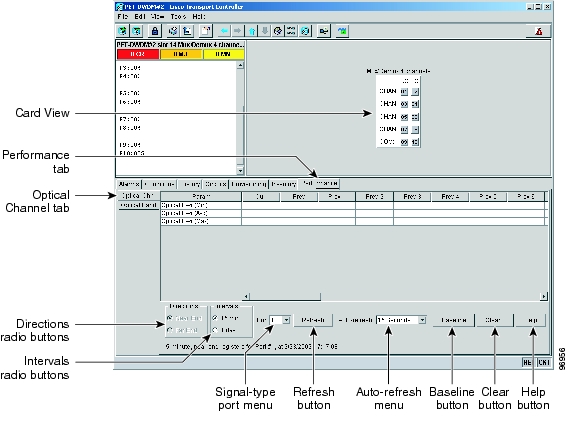
DLP-G276 View Optical Power Statistics for 4MD-xx.x Cards
Step 1
Step 2
Figure 8-4 Optical Channel Tab in the 4MD-xx.x Card View Performance Window
Step 3
Step 4
Step 5
Step 6
Step 7
Step 8
Step 9
Step 10
DLP-G142 View Power Statistics for AD-1C-xx.x, AD-2C-xx.x, and AD-4C-xx.x Cards
Step 1
Step 2
Figure 8-5 Optical Line Tab in the Channel Filter OADM Card View Performance Window
Step 3
Table 8-1 Channel OADM Optical Line Ports
Port Numbers
Port Numbers
Port NumbersEXP RX
3
5
9
EXP TX
4
6
10
COM RX
5
7
11
COM TX
6
8
12
Step 4
Step 5
Step 6
Step 7
Step 8
DLP-G143 View Power Statistics for AD-1B-xx.x and AD-4B-xx.x Cards
Step 1
Step 2
Step 3
Table 8-3 OADM Optical Line Ports
EXP RX
3
9
EXP TX
4
10
COM RX
5
11
COM TX
6
12
Step 4
Step 5
Step 6
Table 8-4 OADM Optical Band Ports
BAND RX
1
1
BAND TX
2
2
BAND RX
—
3
BAND TX
—
4
BAND RX
—
5
BAND TX
—
6
BAND RX
—
7
BAND TX
—
8
Step 7
Step 8
NTP-G75 Monitor Transponder and Muxponder Performance
Purpose
This procedure enables you to view node near-end or far-end performance during selected time intervals on a TXP, MXP, Xponder (GE_XP and 10GE_XP) or ADM-10G card to detect possible performance problems. Transponder cards include the TXP_MR_10G, TXP_MR_10E, TXP_MR_2.5G, TXPP_MR_2.5G, TXP_MR_10E_C, and TXP_MR_10E_L. Muxponder cards include the MXP_MR_2.5G, MXPP_MR_2.5G, MXP_MR_10DME_C., MXP_MR_10DME_L, MXP_2.5G_10G, MXP_2.5G_10E, MXP_2.5G_10E_C, and MXP_2.5G_10E_L.
Tools/Equipment
None
Prerequisite Procedures
Before you monitor performance, be sure you have created the appropriate circuits and provisioned the card according to your specifications. For more information, see "Create Optical Channel Circuits and Provisionable Patchcords," "Provision Transponder and Muxponder Cards,"or Chapter 11, "Change DWDM Card Settings."
Required/As Needed
As needed
Onsite/Remote
Onsite or remote
Security Level
Retrieve or higher
Step 1
Note
Step 2
•
•
•
•
•
•
•
•
•
•
Note
Stop. You have completed this procedure.
DLP-G390 View Ethernet Statistic PM Parameters for GE_XP and 10GE_XP Cards
Step 1
Step 2
Step 3
Step 4
Note
Step 5
DLP-G391 View Ethernet Utilization PM Parameters for GE_XP and 10GE_XP Cards
Step 1
Step 2
Step 3
Step 4
The transmit (Tx) and receive (Rx) bandwidth utilization values for the previous time intervals appear in the Prev-n columns. For PM parameter definitions, refer to the "Performance Monitoring" chapter in the Cisco ONS 15454 DWDM Reference Manual.
Note
Step 5
DLP-G392 View Ethernet History PM Parameters for GE_XP and 10GE_XP Cards
Step 1
Step 2
Step 3
Step 4
Note
Step 5
DLP-G393 Refresh Ethernet PM Counts at a Different Time Interval for GE_XP and 10GE_XP Cards
Step 1
Step 2
Step 3
Step 4
•
•
•
•
Step 5
Step 6
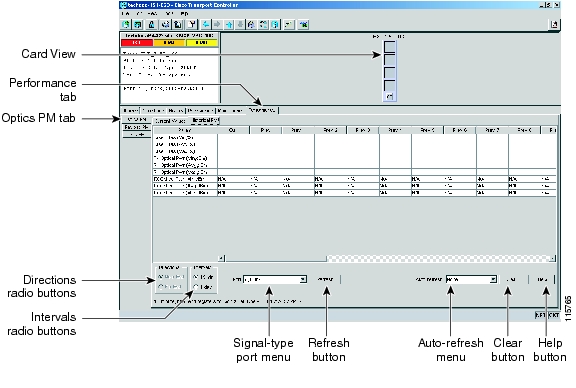
DLP-G146 View Optics PM Parameters
Step 1
Step 2
Figure 8-6 Viewing Optics Performance Monitoring Information
Step 3
Step 4
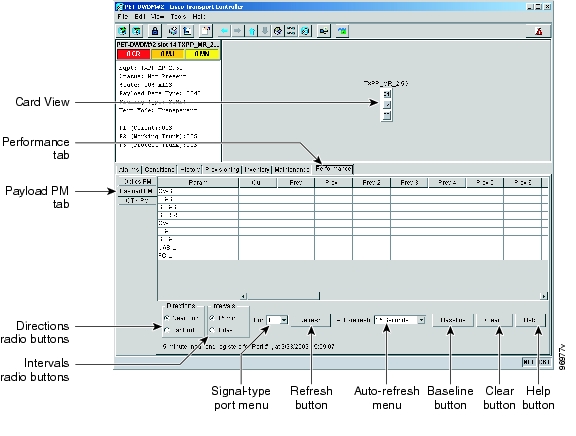
DLP-G147 View Payload PM Parameters
Step 1
Step 2
Figure 8-7 Viewing Payload Performance Monitoring Information
Step 3
Step 4
Note
Note
Step 5
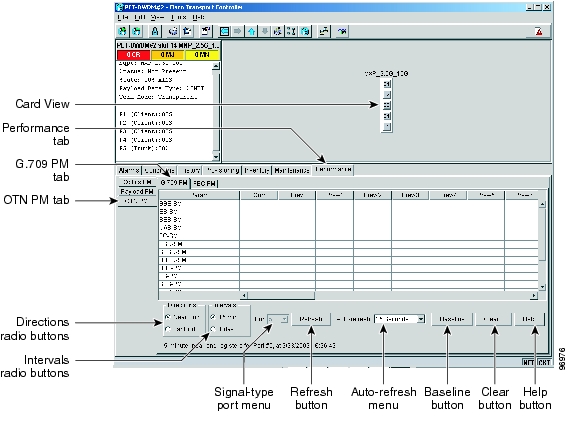
DLP-G148 View OTN PM Parameters
Purpose
This task enables you to view node near-end or far-end OTN PM parameters during selected time intervals on a TXP, MXP, or Xponder card to detect possible performance problems. Cards include: TXP_MR_10G, TXP_MR_2.5G, TXPP_MR_2.5G, TXP_MR_10E, TXP_MR_10E_C, TXP_MR_10E_L), MXP_MR_10DME_C, MXP_MR_10DME_L, MXP_2.5G_10E, MXP_MR_2.5G, MXPP_MR_2.5G, MXP_2.5G_10G, MXP_2.5G_10E_C, MXP_2.5G_10E_L, GE_XP, 10GE_XP, and ADM-10G.
Tools/Equipment
None
Prerequisite Procedures
ITU-T G.709 and FEC must be enabled using one of the following tasks:
•
•
•
•
•
•
Required/As Needed
As needed
Onsite/Remote
Onsite or remote
Security Level
Retrieve or higher
Step 1
Step 2
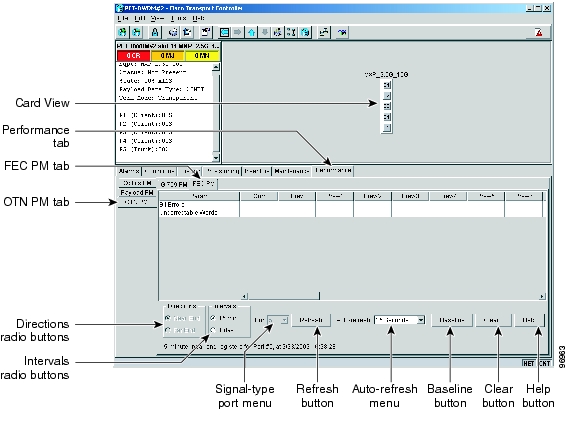
Figure 8-8 Viewing OTN ITU-T G.709 Performance Monitoring Information
Step 3
Step 4
Figure 8-9 Viewing OTN FEC Performance Monitoring Information
Step 5
Step 6
DLP-G149 View Payload Statistics PM Parameters
Step 1
Step 2
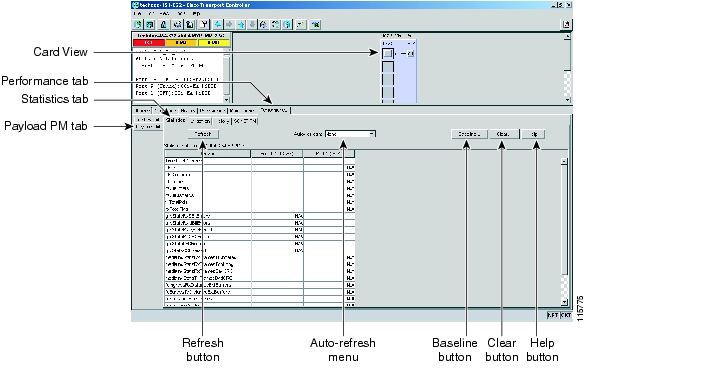
Figure 8-10 Statistics Tab on the Card View Performance Window
Step 3
Step 4
Note
Step 5
DLP-G150 View Payload Utilization PM Parameters
Step 1
Step 2
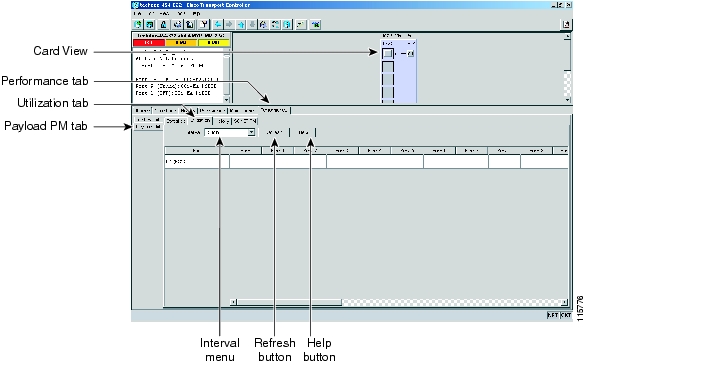
Figure 8-11 Utilization Tab on the Card View Performance Window
Step 3
Step 4
Step 5
Note
Step 6
DLP-G151 View Payload History PM Parameters
Step 1
Step 2
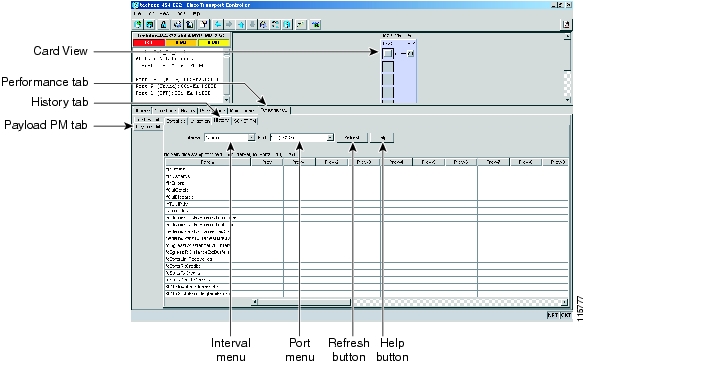
Figure 8-12 History Tab on the Card View Performance Window
Step 3
Step 4
Step 5
Note
Step 6
DLP-G152 View Payload SONET/SDH PM Parameters
Step 1
Step 2
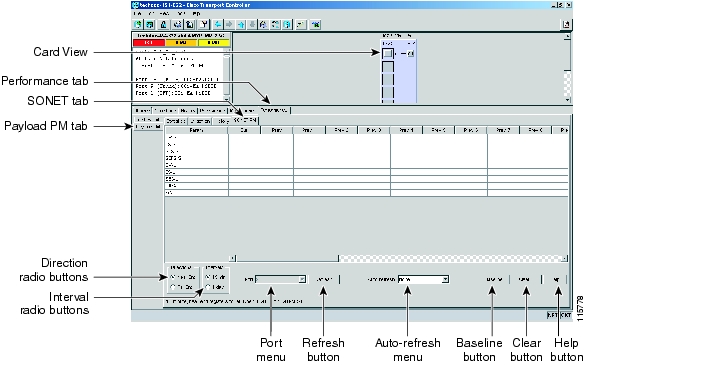
Figure 8-13 SONET PM Tab on the Card View Performance Window
Step 3
Step 4
Note
Note
Step 5
![]()
![]()
![]()
![]()
![]()
![]()
![]()
![]()
Posted: Mon Oct 29 01:32:00 PDT 2007
All contents are Copyright © 1992--2007 Cisco Systems, Inc. All rights reserved.
Important Notices and Privacy Statement.