|
|

Table Of Contents
5.1 Threshold Performance Monitoring
5.2 Intermediate Path Performance Monitoring
5.3 Pointer Justification Count Performance Monitoring
5.4 Performance Monitoring Parameter Definitions
5.5 Performance Monitoring for Electrical Cards
5.5.1 EC1-12 Card Performance Monitoring Parameters
5.5.2 DS1/E1-56 Card Performance Monitoring Parameters
5.5.3 DS1-14 and DS1N-14 Card Performance Monitoring Parameters
5.5.4 DS3-12 and DS3N-12 Card Performance Monitoring Parameters
5.5.5 DS3-12E and DS3N-12E Card Performance Monitoring Parameters
5.5.6 DS3i-N-12 Card Performance Monitoring Parameters
5.5.7 DS3XM-6 Card Performance Monitoring Parameters
5.5.8 DS3XM-12 Card Performance Monitoring Parameters
5.5.9 DS3/EC1-48 Card Performance Monitoring Parameters
5.6 Performance Monitoring for Ethernet Cards
5.6.1 E-Series Ethernet Card Performance Monitoring Parameters
5.6.2 G-Series Ethernet Card Performance Monitoring Parameters
5.6.3 ML-Series Ethernet Card Performance Monitoring Parameters
5.6.4 CE-Series Ethernet Card Performance Monitoring Parameters
5.7 Performance Monitoring for Optical Cards
5.8 Performance Monitoring for Multirate Cards
5.9 Performance Monitoring for Transponder and Muxponder Cards
5.9.1 MXP_MR_2.5G/MXPP_MR_2.5G Payload Statistics Window
5.9.2 MXP_MR_2.5G/MXPP_MR_2.5G Payload Utilization Window
5.9.3 MXP_MR_2.5G/MXPP_MR_2.5G Payload History Window
5.10 Performance Monitoring for Storage Access Networking Cards
5.10.1 FC_MR-4 Statistics Window
5.10.2 FC_MR-4 Utilization Window
5.11 Performance Monitoring for DWDM Cards
5.11.1 Optical Amplifier Card Performance Monitoring Parameters
5.11.2 Multiplexer and Demultiplexer Card Performance Monitoring Parameters
5.11.3 4MD-xx.x Card Performance Monitoring Parameters
5.11.4 OADM Channel Filter Card Performance Monitoring Parameters
5.11.5 OADM Band Filter Card Performance Monitoring Parameters
5.11.6 Optical Service Channel Card Performance Monitoring Parameters
Performance Monitoring
Performance monitoring (PM) parameters are used by service providers to gather, store, set thresholds for, and report performance data for early detection of problems. In this chapter, PM parameters and concepts are defined for electrical cards, Ethernet cards, optical cards, multirate cards, storage access networking (SAN) cards, and dense wavelength division multiplexing (DWDM) cards in the Cisco ONS 15454.
For information about enabling and viewing PM values, refer to the Cisco ONS 15454 Procedure Guide.
Chapter topics include:
•
Threshold Performance Monitoring
•
•
•
•
•
•
•
•
•
•
Note
5.1 Threshold Performance Monitoring
Thresholds are used to set error levels for each PM parameter. You can set individual PM threshold values from the Cisco Transport Controller (CTC) card view Provisioning tab. For procedures on provisioning card thresholds, such as line, path, and SONET thresholds, refer to the Cisco ONS 15454 Procedure Guide.
During the accumulation cycle, if the current value of a PM parameter reaches or exceeds its corresponding threshold value, a threshold crossing alert (TCA) is generated by the node and displayed by CTC. TCAs provide early detection of performance degradation. When a threshold is crossed, the node continues to count the errors during a given accumulation period. If zero is entered as the threshold value, generation of TCAs is disabled, but performance monitoring continues.
Note
ctc.15xxx.node.tr.hiwater=yyy (where xxx is platform and yyy is the number of the hiwater mark. The default hiwater mark is 50.)
If the number of the incoming TCA is greater than the hiwater mark, it will keep the latest lowater mark and discard older ones.Change the threshold if the default value does not satisfy your error monitoring needs. For example, customers with a critical DS-1 installed for 911 calls must guarantee the best quality of service on the line; therefore, they lower all thresholds so that the slightest error raises a TCA.
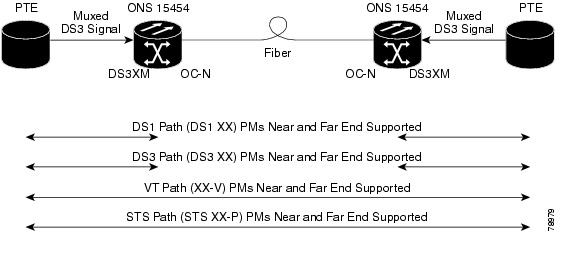
5.2 Intermediate Path Performance Monitoring
Intermediate path performance monitoring (IPPM) allows transparent monitoring of a constituent channel of an incoming transmission signal by a node that does not terminate that channel. Many large networks only use line terminating equipment (LTE), not path terminating equipment (PTE). Table 5-1 shows ONS 15454 cards that are considered LTE.
Table 5-1 ONS 15454 Line Terminating Equipment
EC1-12 card
OC3 IR 4/STM1 SH 1310
OC3 IR/STM1 SH 1310-8
OC12 IR/STM4 SH1310
OC12 LR/STM4 LH1310
OC12 LR/STM4 LH 1550
OC12 IR/STM4 SH 1310-4
OC48 IR 13101
OC48 LR 1550
OC48 IR/STM16 SH AS 1310 1
OC48 LR/STM16 LH AS 1550
OC48 ELR/STM16 EH 100 GHz
OC48 ELR 200 GHz
OC192 SR/STM64 IO 1310
OC192 IR/STM64 SH 1550
OC192 LR/STM64 LH 1550
OC192 LR/STM64 LH ITU 15xx.xx
TXP_MR_10G
MXP_2.5G_10G
MXP_MR_2.5G
MXPP_MR_2.5G
1 An OC-48 IR card used in a bidirectional line switched ring (BLSR) does not support IPPM during a protection switch.
ONS 15454 Software R3.0 and higher allows LTE cards to monitor near-end PM data on individual synchronous transport signal (STS) payloads by enabling IPPM. After enabling IPPM provisioning on the line card, service providers can monitor large amounts of STS traffic through intermediate nodes, thus making troubleshooting and maintenance activities more efficient.
IPPM occurs only on STS paths that have IPPM enabled, and TCAs are raised only for PM parameters on the IPPM enabled paths. The monitored IPPM parameters are STS CV-P, STS ES-P, STS SES-P, STS UAS-P, and STS FC-P.
Note
The ONS 15454 performs IPPM by examining the overhead in the monitored path and by reading all of the near-end path PM values in the incoming direction of transmission. The IPPM process allows the path signal to pass bidirectionally through the node completely unaltered.
See Table 5-2 for detailed information and definitions of specific IPPM parameters.
5.3 Pointer Justification Count Performance Monitoring
Pointers are used to compensate for frequency and phase variations. Pointer justification counts indicate timing errors on SONET networks. When a network is out of synchronization, jitter and wander occur on the transported signal. Excessive wander can cause terminating equipment to slip.
Slips cause different effects in service. Voice service has intermittent audible clicks. Compressed voice technology has short transmission errors or dropped calls. Fax machines lose scanned lines or experience dropped calls. Digital video transmission has distorted pictures or frozen frames. Encryption service loses the encryption key, causing data to be transmitted again.
Pointers provide a way to align the phase variations in STS and VT payloads. The STS payload pointer is located in the H1 and H2 bytes of the line overhead. Clocking differences are measured by the offset in bytes from the pointer to the first byte of the STS synchronous payload envelope (SPE) called the J1 byte. Clocking differences that exceed the normal range of 0 to 782 can cause data loss.
There are positive (PPJC) and negative (NPJC) pointer justification count parameters. PPJC is a count of path-detected (PPJC-PDET-P) or path-generated (PPJC-PGEN-P) positive pointer justifications. NPJC is a count of path-detected (NPJC-PDET-P) or path-generated (NPJC-PGEN-P) negative pointer justifications depending on the specific PM name. PJCDIFF is the absolute value of the difference between the total number of detected pointer justification counts and the total number of generated pointer justification counts. PJCS-PDET-P is a count of the one-second intervals containing one or more PPJC-PDET or NPJC-PDET. PJCS-PGEN-P is a count of the one-second intervals containing one or more PPJC-PGEN or NPJC-PGEN.
A consistent pointer justification count indicates clock synchronization problems between nodes. A difference between the counts means that the node transmitting the original pointer justification has timing variations with the node detecting and transmitting this count. Positive pointer adjustments occur when the frame rate of the SPE is too slow in relation to the rate of the STS-1.
You must enable PPJC and NPJC performance monitoring parameters for LTE cards. See Table 5-1 for a list of Cisco ONS 15454 LTE cards. In CTC, the count fields for PPJC and NPJC PMs appear white and blank unless they are enabled on the card view Provisioning tab.
See Table 5-2 for detailed information and definitions of specific pointer justification count PM parameters.
5.4 Performance Monitoring Parameter Definitions
Table 5-2 gives definitions for each type of PM parameter found in this chapter.
5.5 Performance Monitoring for Electrical Cards
The following sections define PM parameters for the EC1-12, DS1/E1-56, DS1-14, DS1N-14, DS3-12, DS3-12E, DS3N-12, DS3N-12E, DS3i-N-12, DS3XM-6, DS3XM-12, and DS3/EC1-48 cards.
5.5.1 EC1-12 Card Performance Monitoring Parameters
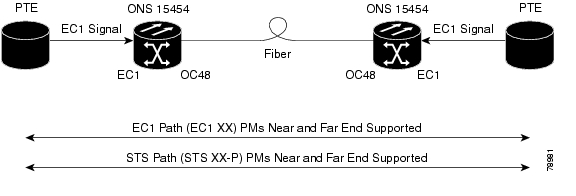
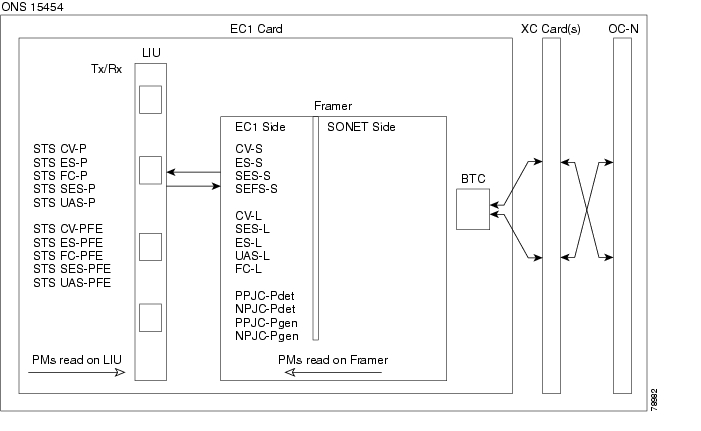
Figure 5-1 shows signal types that support near-end and far-end PMs. Figure 5-2 shows where overhead bytes detected on the application specific integrated circuits (ASICs) produce PM parameters for the EC1-12 card.
Figure 5-1 Monitored Signal Types for the EC1-12 Card
Note
Figure 5-2 PM Read Points on the EC1-12 Card
Table 5-3 lists the PM parameters for the EC1-12 cards.
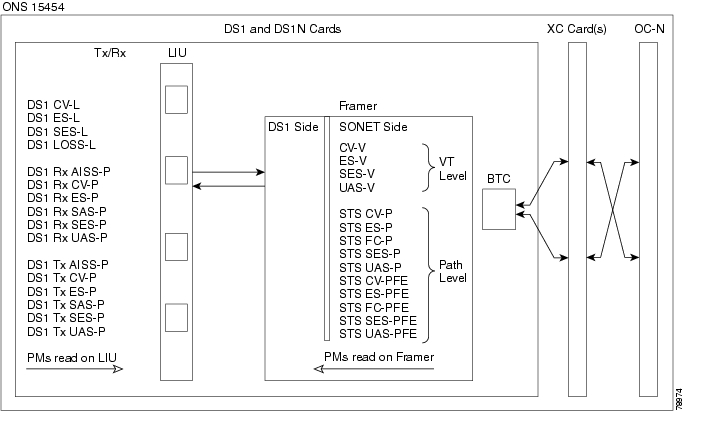
5.5.2 DS1/E1-56 Card Performance Monitoring Parameters
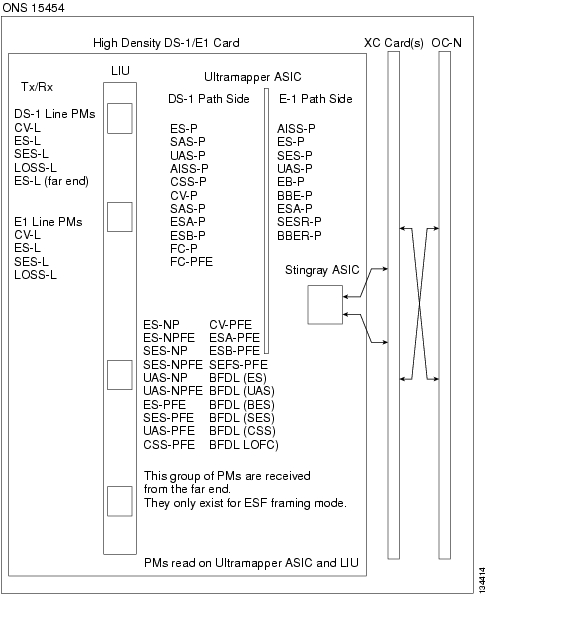
Figure 5-3 shows signal types that support near-end and far-end PMs. Figure 5-4 shows where overhead bytes detected on the ASICs produce PM parameters for the DS1/E1-56 card.
Figure 5-3 Monitored Signal Types for the DS1/E1-56 Card
Figure 5-4 PM Read Points on the DS1/E1-56 Card
Table 5-4 lists the PM parameters for the DS1/E1-56 card.
5.5.3 DS1-14 and DS1N-14 Card Performance Monitoring Parameters
Figure 5-5 shows the signal types that support near-end and far-end PMs.
Figure 5-5 Monitored Signal Types for the DS1-14 and DS1N-14 Cards
Note
Figure 5-6 shows where overhead bytes detected on the ASICs produce PM parameters for the DS1-14 and DS1N-14 cards.
Figure 5-6 PM Read Points on the DS1-14 and DS1N-14 Cards
Table 5-5 describes the PM parameters for the DS1-14 and DS1N-14 cards.
Note
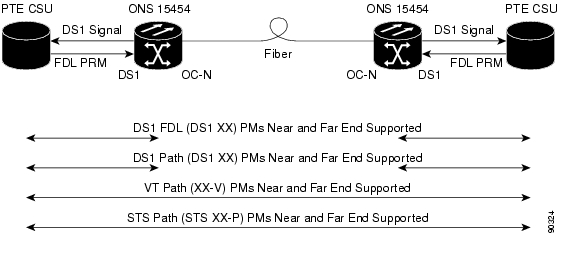
5.5.3.1 DS-1 Facility Data Link Performance Monitoring
Facility Data Link (FDL) performance monitoring enables an ONS 15454 DS1N-14 card to calculate and report DS-1 error rate performance measured at both the near-end and far-end of the FDL. The far-end information is reported as received on the FDL in a performance report message (PRM) from an intelligent channel service unit (CSU).
To monitor DS-1 FDL PM values, the DS-1 must be set to use ESF format and the FDL must be connected to an intelligent CSU. For procedures for provisioning ESF on the DS1N-14 card, refer to the Cisco ONS 15454 Procedure Guide.
The monitored DS-1 FDL PM parameters are CV-PFE, ES-PFE, ESA-PFE, ESB-PFE, SES-PFE, SEFS-PFE, CSS-PFE, UAS-PFE, FC-PFE, and ES-LFE. See Table 5-2 for detailed information and definitions of specific FDL DS1 PM parameters.
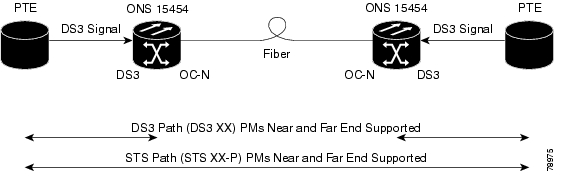
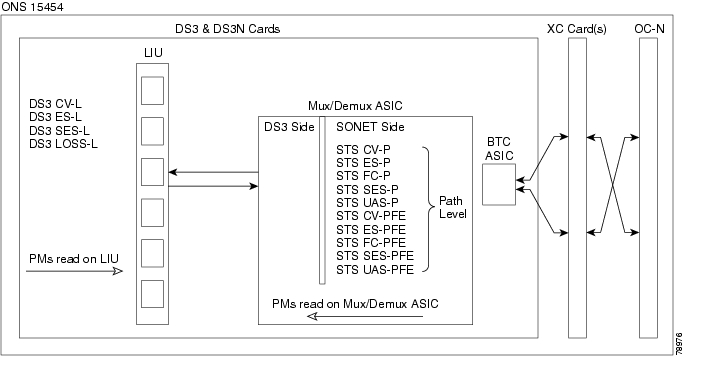
5.5.4 DS3-12 and DS3N-12 Card Performance Monitoring Parameters
Figure 5-7 shows the signal types that support near-end and far-end PMs. Figure 5-8 shows where overhead bytes detected on the ASICs produce PM parameters for the DS3-12 and DS3N-12 cards.
Figure 5-7 Monitored Signal Types for the DS3-12 and DS3N-12 Cards
Note
Figure 5-8 PM Read Points on the DS3-12 and DS3N-12 Cards
The PM parameters for the DS3-12 and DS3N-12 cards are described in Table 5-6.
Table 5-6 DS3-12 and DS3N-12 Card PMs
CV-L
ES-L
SES-L
LOSS-LCV-P
ES-P
SES-P
UAS-P
FC-PCV-PFE
ES-PFE
SES-PFE
UAS-PFE
FC-PFE
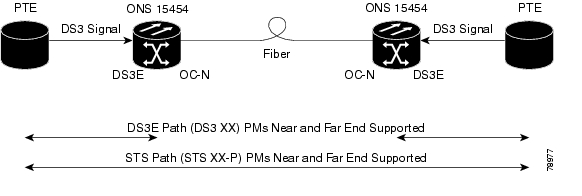
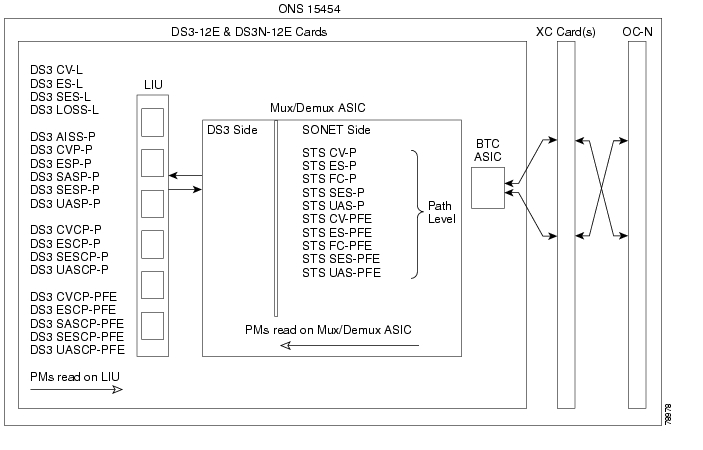
5.5.5 DS3-12E and DS3N-12E Card Performance Monitoring Parameters
Figure 5-9 shows the signal types that support near-end and far-end PMs.
Figure 5-9 Monitored Signal Types for the DS3-12E and DS3N-12E Cards
Note
Figure 5-10 shows where overhead bytes detected on the ASICs produce PM parameters for the DS3-12E and DS3N-12E cards.
Figure 5-10 PM Read Points on the DS3-12E and DS3N-12E Cards
Table 5-7 describes the PM parameters for the DS3-12E and DS3N-12E cards.
Table 5-7 DS3-12E and DS3N-12E Card PMs
CV-L
ES-L
SES-L
LOSS-LAISS-P
CV-P
ES-P
SAS-P2
SES-P
UAS-P
CVCP-P
ESCP-P
SASCP-P
SESCP-P
UASCP-PCV-P
ES-P
SES-P
UAS-P
FC-PCVCP-PFE
ESCP-PFE
SASCP-P
SESCP-PFE
UASCP-PFECV-PFE
ES-PFE
SES-PFE
UAS-PFE
FC-PFE
1 The C-bit PMs (PMs that contain the text "CP-P") are applicable only if the line format is C-bit.
2 DS3(N)-12E cards support SAS-P only on the receive (Rx) path.
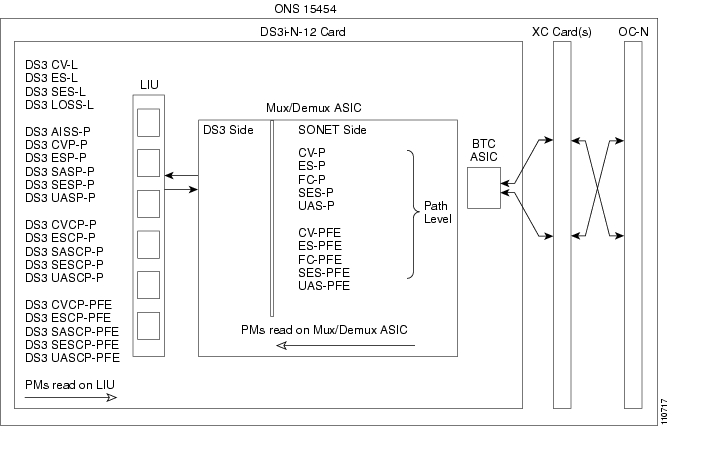
5.5.6 DS3i-N-12 Card Performance Monitoring Parameters
Figure 5-11 shows the signal types that support near-end and far-end PMs.
Figure 5-11 Monitored Signal Types for the DS3i-N-12 Cards
Note
Figure 5-12 shows where overhead bytes detected on the ASICs produce PM parameters for the DS3i-N-12 cards.
Figure 5-12 PM Read Points on the DS3i-N-12 Cards
Table 5-8 describes the PM parameters for the DS3i-N-12 card.
Table 5-8 DS3i-N-12 Card PMs
CV-L
ES-L
SES-L
LOSS-LAISSP-P
CVP-P
ESP-P
SASP-P2
SESP-P
UASP-P
CVCP-P
ESCP-P
SASCP-P
SESCP-P
UASCP-PCV-P
ES-P
SES-P
UAS-P
FC-PCVCP-PFE
ESCP-PFE
SASCP-PFE
SESCP-PFE
UASCP-PFECV-PFE
ES-PFE
SES-PFE
UAS-PFE
FC-PFE
1 The C-Bit PMs (PMs that contain the text "CP-P") are applicable only if the line format is C-Bit.
2 DS3i-N-12 cards support SAS-P only on the Rx path.
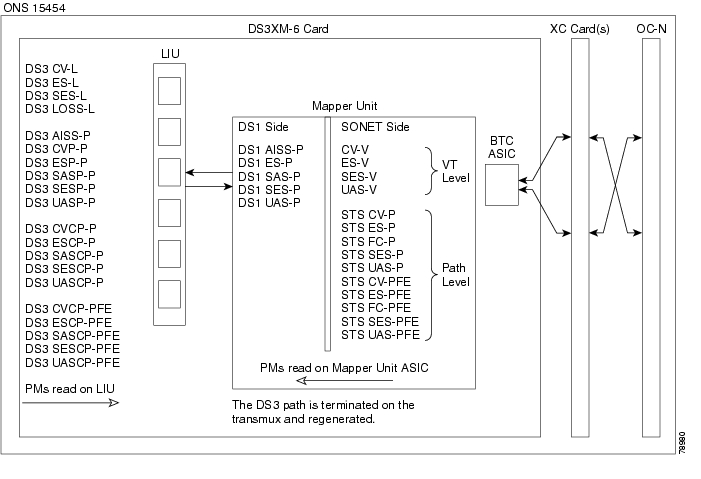
5.5.7 DS3XM-6 Card Performance Monitoring Parameters
Figure 5-13 shows the signal types that support near-end and far-end PMs.
Figure 5-13 Monitored Signal Types for the DS3XM-6 Card
Note
Figure 5-14 shows where the overhead bytes detected on the ASICs produce PM parameters for the DS3XM-6 card.
Figure 5-14 PM Read Points on the DS3XM-6 Card
Table 5-9 lists the PM parameters for the DS3XM-6 cards.
Table 5-9 DS3XM-6 Card PMs
CV-L
ES-L
SES-L
LOSS-LAISS-P
CVP-P
ESP-P
SASP-P2
SESP-P
UASP-P
ESCP-P
SASCP-P
SESCP-P
UASCP-P
CVCP-PAISS-P
ES-P
SAS-P 2
SES-P
UAS-PCV-V
ES-V
SES-V
UAS-VCV-P
ES-P
SES-P
UAS-P
FC-PCVCP-PFE
ESCP-PFE
SASCP-PFE
SESCP-PFE
UASCP-PFECV-VFE
ES-VFE
SES-VFE
UAS-VFECV-PFE
ES-PFE
SES-PFE
UAS-PFE
FC-PFE
1 The C-Bit PMs (PMs that contain the text "CP-P") are applicable only if the line format is C-Bit.
2 DS3XM-6 cards support SAS-P only on the Rx path.
5.5.8 DS3XM-12 Card Performance Monitoring Parameters
Figure 5-15 shows the signal types that support near-end and far-end PMs.
Figure 5-15 Monitored Signal Types for the DS3XM-12 Card
Note
Figure 5-16 shows where the overhead bytes detected on the ASICs produce PM parameters for the DS3XM-12 card.
Figure 5-16 PM Read Points on the DS3XM-12 Card
Table 5-10 lists the PM parameters for the DS3XM-12 cards.
Table 5-10 DS3XM-12 Card PMs
CV-L
ES-L
SES-L
LOSS-LAISS-P
CV-P
ES-P
SAS-P2
SES-P
UAS-P
ESCP-P
SESCP-P
UASCP-P
CVCP-PAISS-P
CV-P
ES-P
FC-P
SAS-P 2
SES-P
UAS-P
CSS-P
ESA-P
ESB-P
SEFS-PCV-V
ES-V
SES-V
UAS-VCV-P
ES-P
SES-P
UAS-P
FC-PCVCP-PFE
ESCP-PFE
SASCP-PFE
SESCP-PFE
UASCP-PFECV-VFE
ES-VFE
SES-VFE
UAS-VFECV-PFE
ES-PFE
SES-PFE
UAS-PFE
FC-PFECSS
ES
SES
BES
UAS
LOFC
1 The C-Bit PMs (PMs that contain the text "CP-P") are applicable only if the line format is C-Bit.
2 DS3XM-12 cards support SAS-P only on the Rx path.
5.5.9 DS3/EC1-48 Card Performance Monitoring Parameters
Figure 5-17 shows the signal types that support near-end and far-end PMs.
Figure 5-17 Monitored Signal Types for the DS3/ EC1-48 Card
Note
Figure 5-18 shows where the overhead bytes detected on the ASICs produce PM parameters for the DS3-EC1-48 card.
Figure 5-18 PM Read Points on the DS3/EC1-48 Card
Table 5-11 lists the PM parameters for the DS3/EC1-48 cards.
Table 5-11 DS3/EC1-48 Card PMs
CV-L
ES-L
SES-L
LOSS-LAISS-P
CVP-P
ESP-P
SASP-P2
SESP-P
UASP-P
ESCP-P
SASCP-P
SESCP-P
UASCP-P
CVCP-PCV-P
ES-P
SES-P
UAS-P
FC-PCVCP-PFE
ESCP-PFE
SASCP-PFE
SESCP-PFE
UASCP-PFECV-PFE
ES-PFE
SES-PFE
UAS-PFE
FC-PFE
1 The C-Bit PMs (PMs that contain the text "CP-P") are applicable only if the line format is C-Bit.
2 DS3/EC1-48 cards support SAS-P only on the Rx path.
5.6 Performance Monitoring for Ethernet Cards
The following sections define PM parameters and definitions for the ONS 15454 E-Series, G-Series, ML-Series, and CE100T-8 Ethernet cards.
5.6.1 E-Series Ethernet Card Performance Monitoring Parameters
CTC provides Ethernet performance information, including line-level parameters, port bandwidth consumption, and historical Ethernet statistics. The E-Series Ethernet performance information is divided into the Statistics, Utilization, and History tabbed windows within the card view Performance tab window.
5.6.1.1 E-Series Ethernet Statistics Window
The Ethernet Statistics window lists Ethernet parameters at the line level. The Statistics window provides buttons to change the statistical values shown. The Baseline button resets the displayed statistics values to zero. The Refresh button manually refreshes statistics. Auto-Refresh sets a time interval at which automatic refresh occurs.
Table 5-12 defines the E-Series Ethernet card statistics parameters.
5.6.1.2 E-Series Ethernet Utilization Window
The Utilization window shows the percentage of transmit (Tx) and receive (Rx) line bandwidth used by the Ethernet ports during consecutive time segments. The Mode field displays the real-time mode status, such as 100 Full, which is the mode setting configured on the E-Series port. However, if the E-Series port is set to autonegotiate the mode (Auto), this field shows the result of the link negotiation between the E-Series and the peer Ethernet device attached directly to the E-Series port.
The Utilization window provides an Interval drop-down list that enables you to set time intervals of 1 minute, 15 minutes, 1 hour, and 1 day. Line utilization is calculated with the following formulas:
Rx = (inOctets + inPkts * 20) * 8 / 100% interval * maxBaseRate
Tx = (outOctets + outPkts * 20) * 8 / 100% interval * maxBaseRate
The interval is defined in seconds. The maxBaseRate is defined by raw bits per second in one direction for the Ethernet port (that is, 1 Gbps). The maxBaseRate for E-Series Ethernet cards is shown in Table 5-13.
Table 5-13 maxBaseRate for STS Circuits
STS-1
51840000
STS-3c
155000000
STS-6c
311000000
STS-12c
622000000
Note
Note
5.6.1.3 E-Series Ethernet History Window
The Ethernet History window lists past Ethernet statistics for the previous time intervals. Depending on the selected time interval, the History window displays the statistics for each port for the number of previous time intervals as shown in Table 5-14. The parameters are defined in Table 5-12.
Table 5-14 Ethernet History Statistics per Time Interval
1 minute
60
15 minutes
32
1 hour
24
1 day (24 hours)
7
5.6.2 G-Series Ethernet Card Performance Monitoring Parameters
CTC provides Ethernet performance information, including line-level parameters, port bandwidth consumption, and historical Ethernet statistics. The G-Series Ethernet performance information is divided into the Statistics, Utilization, and History tabbed windows within the card view Performance tab window.
5.6.2.1 G-Series Ethernet Statistics Window
The Ethernet Statistics window lists Ethernet parameters at the line level. The Statistics window provides buttons to change the statistical values shown. The Baseline button resets the displayed statistics values to zero. The Refresh button manually refreshes statistics. Auto-Refresh sets a time interval at which automatic refresh occurs. The G-Series Statistics window also has a Clear button. The Clear button sets the values on the card to zero, but does not reset the G-Series card.
Table 5-15 defines the G-Series Ethernet card statistics parameters.
Table 5-15 G-Series Ethernet Statistics Parameters
Time Last Cleared
A time stamp indicating the last time statistics were reset.
Link Status
Indicates whether the Ethernet link is receiving a valid Ethernet signal (carrier) from the attached Ethernet device; up means present, and down means not present.
Rx Packets
Number of packets received since the last counter reset.
Rx Bytes
Number of bytes received since the last counter reset.
Tx Packets
Number of packets transmitted since the last counter reset.
Tx Bytes
Number of bytes transmitted since the last counter reset.
Rx Total Errors
Total number of receive errors.
Rx FCS
Number of packets with a FCS error. FCS errors indicate frame corruption during transmission.
Rx Alignment
Number of packets with received incomplete frames.
Rx Runts
Measures undersized packets with bad CRC errors.
Rx Shorts
Measures undersized packets with good CRC errors.
Rx Jabbers
The total number of frames received that exceed the 1548-byte maximum and contain CRC errors.
Rx Giants
Number of packets received that are greater than 1530 bytes in length.
Rx Pause Frames
Number of received Ethernet IEEE 802.3z pause frames.
Tx Pause Frames
Number of transmitted IEEE 802.3z pause frames.
Rx Pkts Dropped Internal Congestion
Number of received packets dropped due to overflow in G-Series frame buffer.
Tx Pkts Dropped Internal Congestion
Number of transmit queue drops due to drops in the G-Series frame buffer.
HDLC Errors
High-level data link control (HDLC) errors received from SONET/SDH (see Note).
Rx Unicast Packets
Number of unicast packets received since the last counter reset.
Tx Unicast Packets
Number of unicast packets transmitted.
Rx Multicast Packets
Number of multicast packets received since the last counter reset.
Tx Multicast Packets
Number of multicast packets transmitted.
Rx Broadcast Packets
Number of broadcast packets received since the last counter reset.
Tx Broadcast Packets
Number or broadcast packets transmitted.
Note
5.6.2.2 G-Series Ethernet Utilization Window
The Utilization window shows the percentage of Tx and Rx line bandwidth used by the Ethernet ports during consecutive time segments. The Mode field displays the real-time mode status, such as 100 Full, which is the mode setting configured on the G-Series port. However, if the G-Series port is set to autonegotiate the mode (Auto), this field shows the result of the link negotiation between the G-Series and the peer Ethernet device attached directly to the G-Series port.
The Utilization window provides an Interval drop-down list that enables you to set time intervals of 1 minute, 15 minutes, 1 hour, and 1 day. Line utilization is calculated with the following formulas:
Rx = (inOctets + inPkts * 20) * 8 / 100% interval * maxBaseRate
Tx = (outOctets + outPkts * 20) * 8 / 100% interval * maxBaseRate
The interval is defined in seconds. The maxBaseRate is defined by raw bits per second in one direction for the Ethernet port (that is, 1 Gbps). The maxBaseRate for G-Series Ethernet cards is shown in Table 5-13.
Note
Note
5.6.2.3 G-Series Ethernet History Window
The Ethernet History window lists past Ethernet statistics for the previous time intervals. Depending on the selected time interval, the History window displays the statistics for each port for the number of previous time intervals as shown in Table 5-14. The listed parameters are defined in Table 5-15.
5.6.3 ML-Series Ethernet Card Performance Monitoring Parameters
CTC provides Ethernet performance information for line-level parameters and historical Ethernet statistics. The ML-Series Ethernet performance information is divided into the Ether Ports and Packet-over-SONET (POS) Ports tabbed windows within the card view Performance tab window.
5.6.3.1 ML-Series Ether Ports Window
Table 5-16 defines the ML-Series Ethernet card Ether Ports PM parameters.
5.6.3.2 ML-Series POS Ports Window
In the ML-Series POS Ports window, the parameters displayed depend on the framing mode employed by the ML-Series card. The two framing modes for the POS port on the ML-Series card are HDLC and frame-mapped generic framing procedure (GFP-F). For more information on provisioning a framing mode, refer to Cisco ONS 15454 Procedure Guide.
Table 5-17 defines the ML-Series Ethernet card POS Ports HDLC parameters. Table 5-18 defines the ML-Series Ethernet card POS Ports GFP-F parameters.
5.6.4 CE-Series Ethernet Card Performance Monitoring Parameters
CTC provides Ethernet performance information, including line-level parameters, port bandwidth consumption, and historical Ethernet statistics. The CE-Series card Ethernet performance information is divided into Ether Ports and POS Ports tabbed windows within the card view Performance tab window.
5.6.4.1 CE-Series Card Ether Port Statistics Window
The Ethernet Ether Ports Statistics window lists Ethernet parameters at the line level. The Statistics window provides buttons to change the statistical values shown. The Baseline button resets the displayed statistics values to zero. The Refresh button manually refreshes statistics. Auto-Refresh sets a time interval at which automatic refresh occurs. The CE-Series Statistics window also has a Clear button. The Clear button sets the values on the card to zero, but does not reset the CE-Series card.
During each automatic cycle, whether auto-refreshed or manually refreshed (using the Refresh button), statistics are added cumulatively and are not immediately adjusted to equal total received packets until testing ends. To see the final PM count totals, allow a few moments for the PM window statistics to finish testing and update fully. PM counts are also listed in the CE-Series card Performance > History window.
Table 5-19 defines the CE-Series card Ethernet port parameters.
5.6.4.2 CE-Series Card Ether Ports Utilization Window
The Ether Ports Utilization window shows the percentage of Tx and Rx line bandwidth used by the Ethernet ports during consecutive time segments. The Utilization window provides an Interval drop-down list that enables you to set time intervals of 1 minute, 15 minutes, 1 hour, and 1 day. Line utilization is calculated with the following formulas:
Rx = (inOctets + inPkts * 20) * 8 / 100% interval * maxBaseRate
Tx = (outOctets + outPkts * 20) * 8 / 100% interval * maxBaseRate
The interval is defined in seconds. The maxBaseRate is defined by raw bits per second in one direction for the Ethernet port (that is, 1 Gbps). The maxBaseRate for CE-Series Ethernet cards is shown in Table 5-13.
Note
5.6.4.3 CE-Series Card Ether Ports History Window
The Ethernet Ether Ports History window lists past Ethernet statistics for the previous time intervals. Depending on the selected time interval, the History window displays the statistics for each port for the number of previous time intervals as shown in Table 5-14. The listed parameters are defined in Table 5-15.
5.6.4.4 CE-Series Card POS Ports Statistics Parameters
The Ethernet POS Ports statistics window lists Ethernet POS parameters at the line level. Table 5-20 defines the CE-Series Ethernet card POS Ports parameters.
5.6.4.5 CE-Series Card POS Ports Utilization Window
The POS Ports Utilization window shows the percentage of Tx and Rx line bandwidth used by the POS ports during consecutive time segments. The Utilization window provides an Interval drop-down list that enables you to set time intervals of 1 minute, 15 minutes, 1 hour, and 1 day. Line utilization is calculated with the following formulas:
Rx = (inOctets * 8) / (interval * maxBaseRate)
Tx = (outOctets * 8) / (interval * maxBaseRate)
The interval is defined in seconds. The maxBaseRate is defined by raw bits per second in one direction for the Ethernet port (that is, 1 Gbps). The maxBaseRate for CE-Series cards is shown in Table 5-13.
Note
5.6.4.6 CE-Series Card Ether Ports History Window
The Ethernet POS Ports History window lists past Ethernet POS ports statistics for the previous time intervals. Depending on the selected time interval, the History window displays the statistics for each port for the number of previous time intervals as shown in Table 5-14. The listed parameters are defined in Table 5-19.
5.7 Performance Monitoring for Optical Cards
This section lists PM parameters for ONS 15454 optical cards, including the OC-3, OC-12, OC-48, and OC-192 cards. Figure 5-19 shows the signal types that support near-end and far-end PMs.
Figure 5-19 Monitored Signal Types for the OC-3 Cards
Note
Figure 5-20 shows where overhead bytes detected on the ASICs produce PM parameters for the OC3 IR 4 SH 1310 and OC3 IR SH 1310-8 cards.
Figure 5-20 PM Read Points on the OC-3 Cards
Note
Table 5-21 and Table 5-22 list the PM parameters for OC-3 cards.
Table 5-21 OC-3 Card PMs
CV-S
ES-S
SES-S
SEF-SCV-L
ES-L
SES-L
UAS-L
FC-L
PSC (1+1)
PSD (1+1)CV-P
ES-P
SES-P
UAS-P
FC-P
PPJC-PDET
NPJC-PDET
PPJC-PGEN
NPJC-PGEN
PPJC-PDET-P
PPJC-PGEN-P
PJC-DIFFCV-LFE
ES-LFE
SES-LFE
UAS-LFE
FC-LFECV-PFE
ES-PFE
SES-PFE
UAS-PFE
FC-PFE
1 The STS Path (FE) PMs are valid only for the OC3-4 card on ONS 15454.
Table 5-23 lists the PM parameters for OC-12, OC-48, and OC-192 cards.
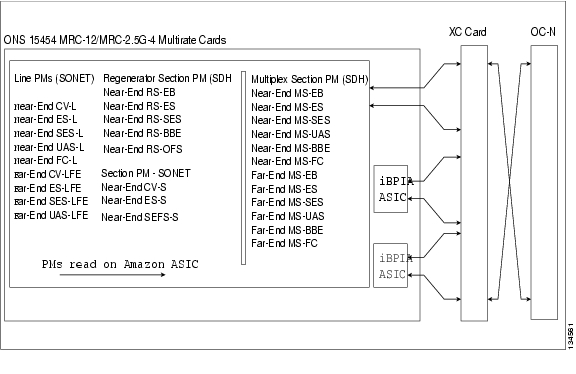
5.8 Performance Monitoring for Multirate Cards
This section lists PM parameters for the optical mutirate card, also known as the MRC-12 card.
Figure 5-21 shows where overhead bytes detected on the ASICs produce PM parameters for the MRC-12 card.
Figure 5-21 PM Read Points for the MRC-12 Card
Table 5-24 lists the PM parameters for MRC-12 cards.
Table 5-24 MRC-12 Card PMs
CV-S
ES-S
SEF-SCV-L
ES-L
SES-L
UASL
FC-LCV-L
ES-L
SES-L
UAS-L
FC-L
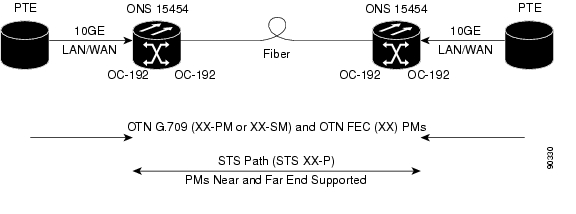
5.9 Performance Monitoring for Transponder and Muxponder Cards
This section lists PM parameters for transponder cards (TXP_MR_10G, TXP_MR_2.5G, TXPP_MR_2.5G, and TXP_MR_10E), and muxponder cards (MXP_2.5G_10G, MXP_25G_10E, MXP_MR_2.5G, and MXPP_MR_2.5G).
The MXP_MR_2.5G and MXPP_MR_2.5G cards also have payload performance information, divided into Statistics, Utilization, History, and SONET PM tabbed windows within the card view Performance tab Payload PM window. See the "MXP_MR_2.5G/MXPP_MR_2.5G Payload Statistics Window" section, the "MXP_MR_2.5G/MXPP_MR_2.5G Payload Utilization Window" section, and the "MXP_MR_2.5G/MXPP_MR_2.5G Payload History Window" section for payload PM information for MXP_MR_2.5G and MXPP_MR_2.5G cards.
Figure 5-22 shows the signal types that support near-end and far-end PMs for the TXP_MR_10G card. The signal types for the remaining transponder and muxponder cards are similar to the TXP_MR_10G card.
Figure 5-22 Monitored Signal Types
Note
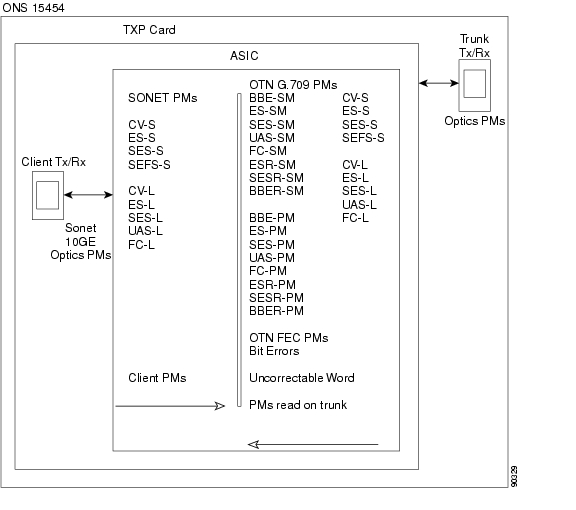
Figure 5-23 shows where overhead bytes detected on the ASICs produce PM parameters for the TXP_MR_10G card. The remaining transponder and muxponder cards perform similarly to this illustration.
Figure 5-23 PM Read Points for TXP_MR_10G Card
Table 5-25 describes the PM parameters for the TXP_MR_10G, TXP_MR_2.5G, TXPP_MR_2.5G, TXP_MR_10E, MXP_2.5G_10G, MXP_2.5G_10E, MXP_MR_2.5G, and MXPP_MR_2.5G cards.
Table 5-25 Muxponder and Transponder Card PMs
(NE and FE)3CV-L
ES-L
SES-L
UAS-L
FC-LCV-S
CV-L
ES-S
ES-L
SES-S
SES-L
SEF-S
UAS-L
FC-LES-PM
ES-SM
ESR-PM
ESR-SM
SES-PM
SES-SM
SESR-PM
SESR-SM
UAS-PM
UAS-SM
BBE-PM
BBE-SM
BBER-PM
BBER-SM
FC-PM
FC-SMLBC
OPT
OPRCGV
DCG
IOS
IPC
NIOS
VPCBIEC
UNC-WORDS
1 Applicable to OCH and CLNT facilities.
2 For MXP_MR_2.5G and MXPP_MR_2.5G cards, these parameters are defined in the Performance > Payload PM > SONET PM tabs within the card view.
3 Applicable to OCH facility.
4 TXP_MR_2.5G and TXPP_MR_2.5G card ESCON payload does not support optics PMs on the client port due to Small Form-factor Pluggable (SFP)-imposed restrictions.
5 Applicable to TXP_MR_2.5G and TXPP_MR_2.5G cards only.
5.9.1 MXP_MR_2.5G/MXPP_MR_2.5G Payload Statistics Window
The Payload PM Statistics window lists parameters at the line level. The Statistics window provides buttons to change the statistical values shown. The Baseline button resets the displayed statistics values to zero. The Refresh button manually refreshes statistics. Auto-Refresh sets a time interval at which automatic refresh occurs. The Statistics window also has a Clear button. The Clear button sets the values on the card to zero. All counters on the card are cleared. Table 5-26 defines the MXP_MR_2.5G and MXPP_MR_2.5G card statistics parameters.
5.9.2 MXP_MR_2.5G/MXPP_MR_2.5G Payload Utilization Window
The Payload PM Utilization window shows the percentage of Tx and Rx line bandwidth used by the ports during consecutive time segments. The Utilization window provides an Interval drop-down list that enables you to set time intervals of 1 minute, 15 minutes, 1 hour, and 1 day. Line utilization is calculated with the following formulas:
Rx = (inOctets + inPkts * 20) * 8 / 100% interval * maxBaseRate
Tx = (outOctets + outPkts * 20) * 8 / 100% interval * maxBaseRate
The interval is defined in seconds. The maxBaseRate is defined by raw bits per second in one direction for the port (that is, 1 Gbps). The maxBaseRate for MXP_MR_2.5G and MXPP_MR_2.5G cards is shown in Table 5-13.
Note
5.9.3 MXP_MR_2.5G/MXPP_MR_2.5G Payload History Window
The Payload PM History window lists past statistics for the previous time intervals. Depending on the selected time interval, the History window displays the statistics for each port for the number of previous time intervals as shown in Table 5-14. The listed parameters are defined in Table 5-26.
5.10 Performance Monitoring for Storage Access Networking Cards
The following sections define PM parameters and definitions for the SAN card, also known as the FC_MR-4 or Fibre Channel card.
CTC provides FC_MR-4 performance information, including line-level parameters, port bandwidth consumption, and historical statistics. The FC_MR-4 card performance information is divided into the Statistics, Utilization, and History tabbed windows within the card view Performance tab window.
5.10.1 FC_MR-4 Statistics Window
The Statistics window lists parameters at the line level. The Statistics window provides buttons to change the statistical values shown. The Baseline button resets the displayed statistics values to zero. The Refresh button manually refreshes statistics. Auto-Refresh sets a time interval at which automatic refresh occurs. The Statistics window also has a Clear button. The Clear button sets the values on the card to zero. All counters on the card are cleared. Table 5-27 defines the FC_MR-4 card statistics parameters.
5.10.2 FC_MR-4 Utilization Window
The Utilization window shows the percentage of Tx and Rx line bandwidth used by the ports during consecutive time segments. The Utilization window provides an Interval drop-down list that enables you to set time intervals of 1 minute, 15 minutes, 1 hour, and 1 day. Line utilization is calculated with the following formulas:
Rx = (inOctets + inPkts * 24) * 8 / 100% interval * maxBaseRate
Tx = (outOctets + outPkts * 24) * 8 / 100% interval * maxBaseRate
The interval is defined in seconds. The maxBaseRate is defined by raw bits per second in one direction for the port (that is, 1 Gbps or 2 Gbps). The maxBaseRate for FC_MR-4 cards is shown in Table 5-28.
Table 5-28 maxBaseRate for STS Circuits
STS-24
850000000
STS-48
850000000 x 21
1 For 1 Gbps of bit rate being transported, there are only 850 Mbps of actual data because of 8b->10b conversion. Similarly, for 2 Gbps of bit rate being transported, there are only 1700 Mbps (850 Mbps x 2) of actual data.
Note
5.10.3 FC_MR-4 History Window
The History window lists past FC_MR-4 statistics for the previous time intervals. Depending on the selected time interval, the History window displays the statistics for each port for the number of previous time intervals as shown in Table 5-29. The listed parameters are defined in Table 5-27.
5.11 Performance Monitoring for DWDM Cards
The following sections define PM parameters and definitions for the ONS 15454 OPT-PRE, OPT-BST, 32MUX-O, 32DMX-O, 32DMX, 4MD-xx.x, AD-1C-xx.x, AD-2C-xx.x, AD-4C-xx.x, AD-1B-xx.x, AD-4B-xx.x, OSCM, OSC-CSM, and 32WSS DWDM cards.
5.11.1 Optical Amplifier Card Performance Monitoring Parameters
The PM parameters for the OPT-PRE and OPT-BST cards are listed Table 5-30.
.
Table 5-30 Optical PM Parameters for OPT-PRE and OPT-BST Cards.
OPT
OPR
5.11.2 Multiplexer and Demultiplexer Card Performance Monitoring Parameters
The PM parameters for the 32MUX-O, 32WSS, 32DMX, and 32DMX-O cards are listed in Table 5-31.
5.11.3 4MD-xx.x Card Performance Monitoring Parameters
The PM parameters for the 4MD-xx.x cards are listed in Table 5-32.
5.11.4 OADM Channel Filter Card Performance Monitoring Parameters
The PM parameters for the AD-1C-xx.x, AD-2C-xx.x, and AD-4C-xx.x cards are listed in Table 5-33.
Table 5-33 Optical PMs for AD-1C-xx.x, AD-2C-xx.x, and AD-4C-xx.x Cards
OPR
OPT
5.11.5 OADM Band Filter Card Performance Monitoring Parameters
The PM parameters for the AD-1B-xx.x and AD-4B-xx.x cards are listed in Table 5-34.
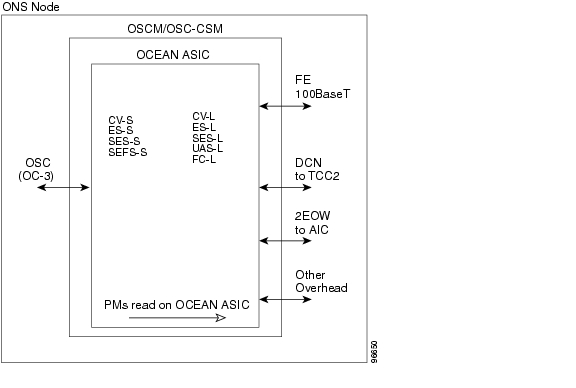
5.11.6 Optical Service Channel Card Performance Monitoring Parameters
Figure 5-24 shows where overhead bytes detected on the ASICs produce PM parameters for the OSCM and OSC-CSM cards.
Figure 5-24 PM Read Points on OSCM and OSC-CSM Cards
The PM parameters for the OSCM and OSC-CSM cards are described in Table 5-35.
Table 5-35 OSCM/OSC-CSM (OC3) Card PMs
CV-S
ES-S
SES-S
SEF-SCV-L
ES-L
SES-L
UAS-L
FC-LOPWR
1 Applicable to OC3
2 Applicable to OTS facilities
![]()
![]()
![]()
![]()
![]()
![]()
![]()
![]()
Posted: Fri Oct 5 04:26:54 PDT 2007
All contents are Copyright © 1992--2007 Cisco Systems, Inc. All rights reserved.
Important Notices and Privacy Statement.