|
|

Table Of Contents
Alarm Monitoring and Management
10.2.1 Controlling Alarm Display
10.2.2 Viewing Alarm-Affected Circuits
10.2.5 Viewing Alarms on the LCD
10.3.1 Creating and Modifying Alarm Profiles
10.3.2 Applying Alarm Profiles
Alarm Monitoring and Management
This chapter explains how to manage alarms with Cisco Transport Controller (CTC), which includes
•
Viewing alarms
•
•
•
•
•
To troubleshoot specific alarms, see the Cisco ONS 15454 Troubleshooting and Maintenance Guide.
10.1 Overview
The Cisco Transport Controller (CTC) detects and reports SONET alarms generated by the Cisco ONS 15454 and the larger SONET network. You can use CTC to monitor and manage alarms at a card, node, or network levels and view alarm counts on the LCD front panel. Default alarm severities conform to the Telcordia GR-253 standard, but you can reset severities to customized alarm profiles or suppress CTC alarm reporting. For a detailed description of the standard Telcordia categories employed by ONS nodes, see the Cisco ONS 15454 Troubleshooting and Maintenance Guide.
Note
10.2 Viewing ONS 15454 Alarms
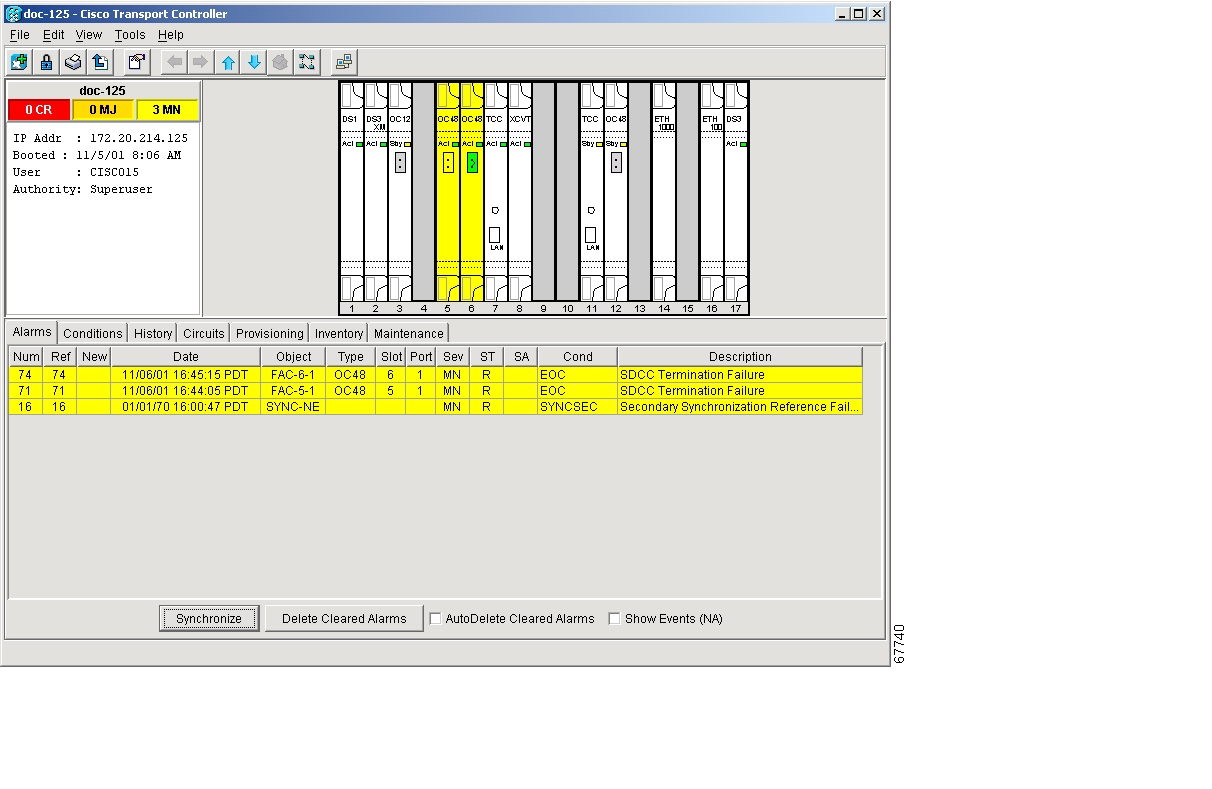
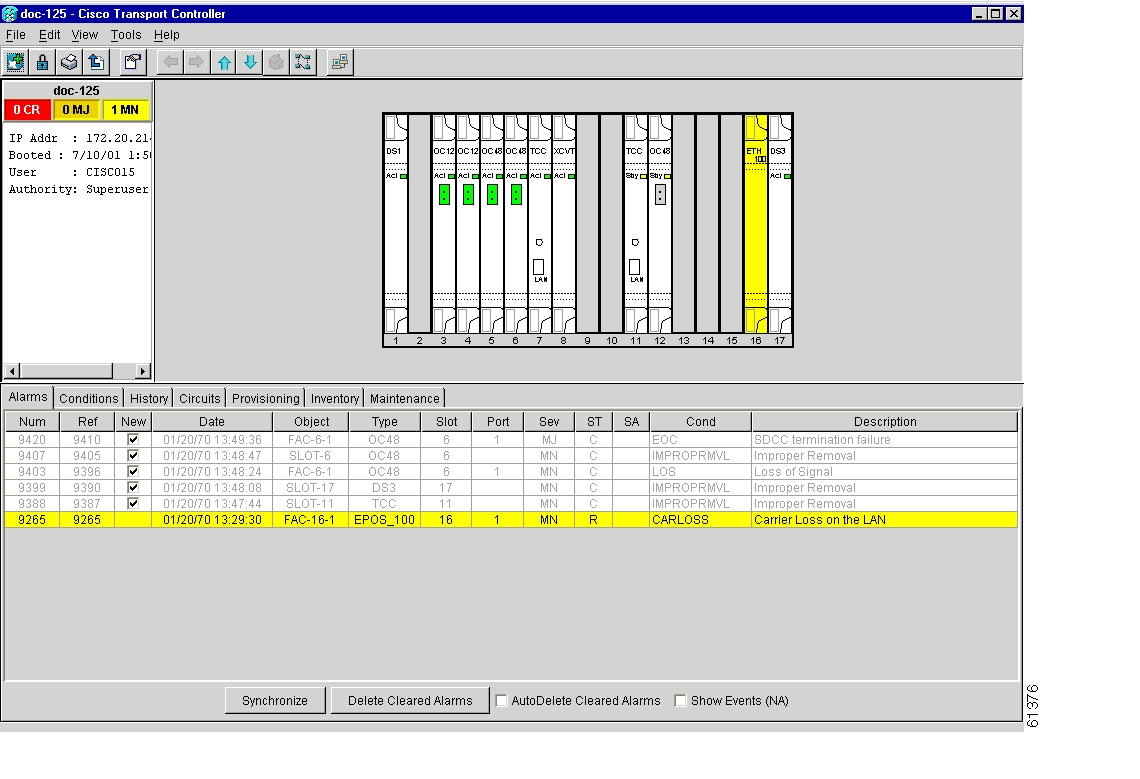
At the card, node, or network-level CTC view, click the Alarms tab to display the alarms for that card, node or network. Table 10-1 lists the tab's column headings and the information recorded in each column.
Figure 10-1 Viewing alarms in the CTC node view
Alarms display in one of five background colors, listed in Table 10-2, to quickly communicate the alarm severity. Events, conditions, and cleared alarms are also color coded. Conditions and events display in the History or Conditions tab.
10.2.1 Controlling Alarm Display
You can control the display of the alarms on the Alarms tab. Table 10-3 shows the actions you can perform from the Alarms tab.
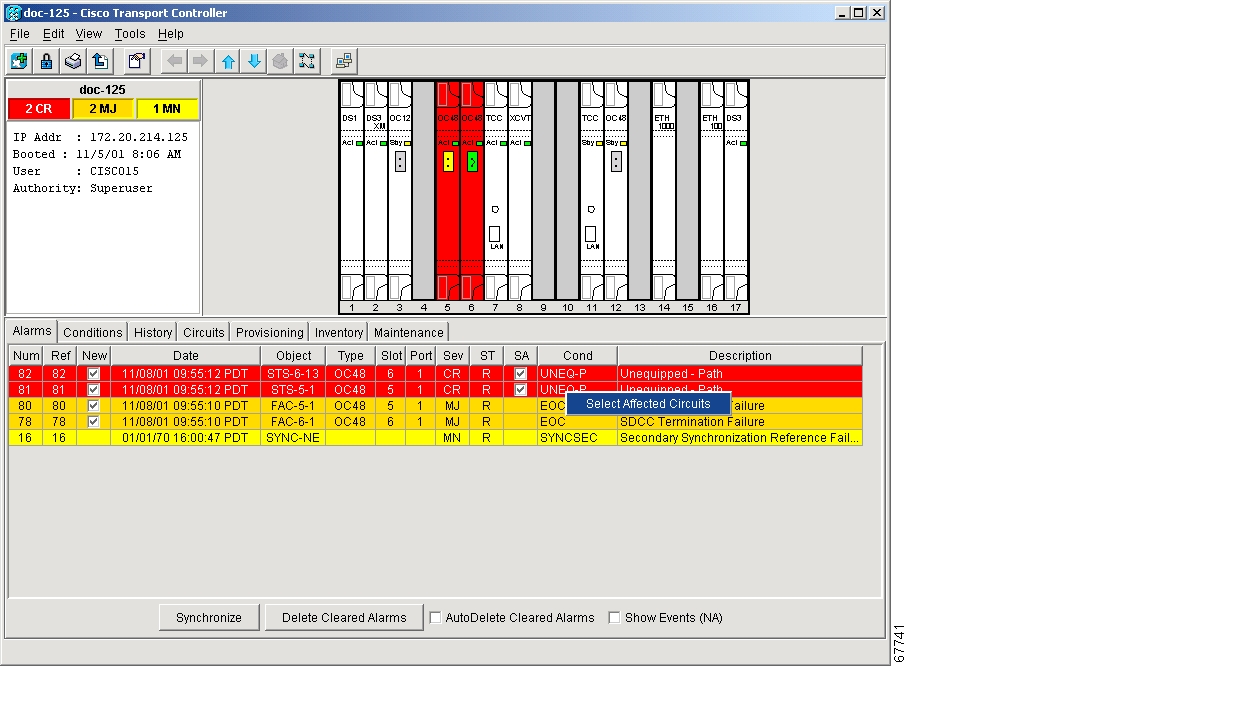
10.2.2 Viewing Alarm-Affected Circuits
User can view which ONS 15454 circuits are affected by a specific alarm. Figure 10-6 illustrates the Select Affected Circuits option.
Figure 10-2 Selecting the Affected Circuits option
Procedure: View Affected Circuits for a Specific Alarm
Step 1
The Select Affected Circuit dialog appears.
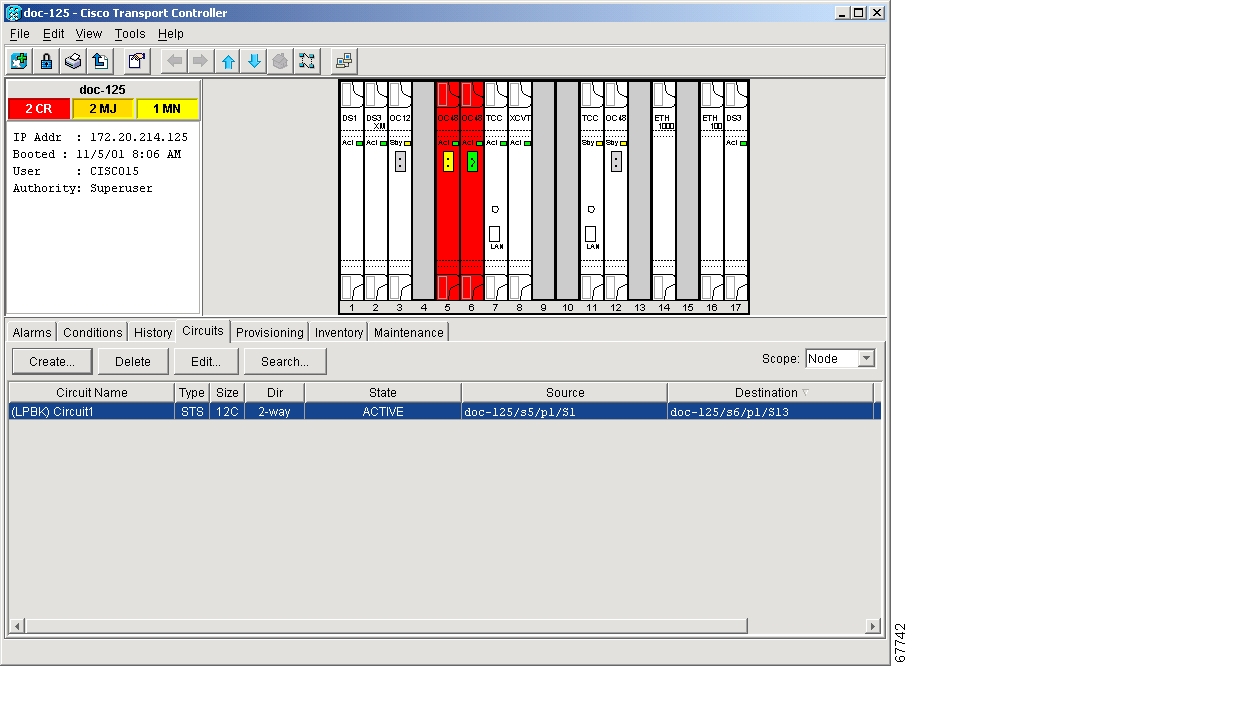
Step 2
The Circuits screen appears with affected circuits highlighted ( Figure 10-3.)
Figure 10-3 Highlighted circuit appears
10.2.3 Conditions Tab
The Conditions tab displays retrieved fault conditions. A fault is a problem detected by ONS 15454 hardware or software. When a fault occurs and continues for a minimum time period, it raises a fault condition, which is a flag showing whether this particular fault currently exists on the ONS 15454. Fault conditions include all existing conditions, whether the severity is that of an alarm (Critical, Major or Minor) or a condition (Not Reported or Non Alarmed.) See the trouble notifications information in the Cisco ONS 15454 Troubleshooting and Maintenance Guide for more information on the classifications for alarms and conditions.
Displaying all existing fault conditions is helpful while troubleshooting the ONS 15454. The Conditions tab does not adhere to Telcordia guidelines for reporting alarms, events, and conditions. Alarm reporting under the Alarms tab is Telcordia-compliant.
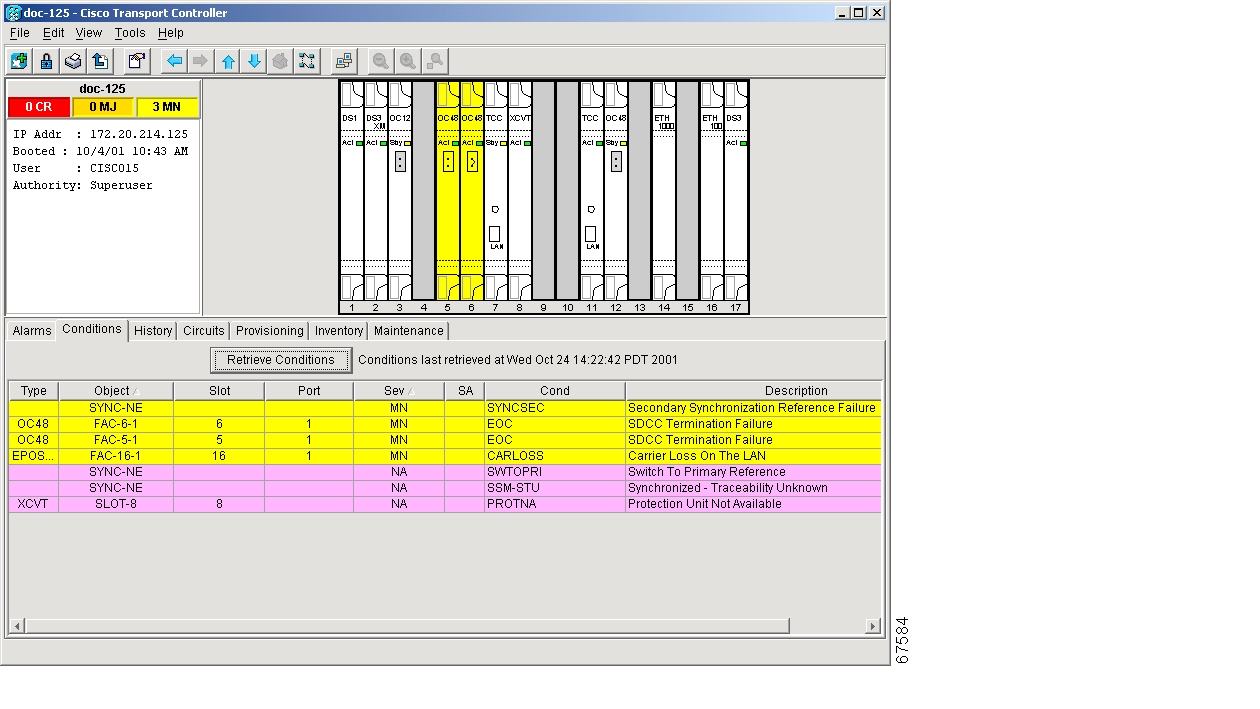
10.2.3.1 Retrieve and Display Conditions
At the node view, click the Conditions tab and the Retrieve Conditions button to retrieve the current set of all existing fault conditions from the ONS 15454, as maintained by the alarm manager. Users can perform the same operation at the card view for the card level and at the network view for the network level.
Figure 10-4 Viewing fault conditions retrieved under the Conditions tabs
10.2.3.2 Conditions Column Descriptions
Table 10-4 lists the tab's column headings and the information recorded in each column.
10.2.4 Viewing History
The History tab displays historical alarm data. It also displays events, which are non-alarmed activities such as timing changes and threshold crossings. For example, protection switching events or performance monitoring threshold crossings appear here. The History tab presents two alarm history views:
•
•
Tip
Figure 10-5 Viewing all alarms reported for the current session
10.2.5 Viewing Alarms on the LCD
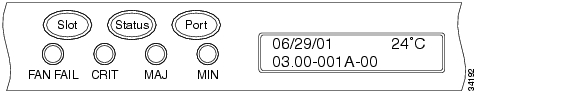
The Critical, Major and Minor alarm LEDs on the fan-tray assembly front panel indicate whether a critical, major, or minor alarm is present anywhere on the ONS 15454. These LEDs are viewable through the front door so that you can quickly determine if any alarms are present on the node. These LEDs are independent of the Card, Port, and Status indicators on the LCD.
When you press the Slot, Status, or Port buttons on the LCD to toggle to a certain slot or port, the LCD displays the Critical, Major, or Minor alarm count for the selected slot and port. Figure 10-6 illustrates the LCD panel.
Figure 10-6 The LCD panel
Procedure: View Alarm Counts on a Specific Slot and Port
Step 1
Set the slot number to Node to see a summary of alarms for the node.
Step 2
Step 3
Figure 10-6 shows the LCD panel.
Note
10.3 Alarm Profiles
The alarm profiles feature allows you to change default alarm severities by creating unique alarm profiles for individual ONS 15454 nodes. A profile you create can be applied to any node on the network. Alarm profiles must be stored on a node before they can be applied to a node, card, or port. CTC can store up to ten alarm profiles; eight are available for custom use and two are reserved. CTC can load an unlimited number of alarm profiles that have been stored on a node, server, or CTC workstation.
The two reserved profiles include the default profile, which sets severities to standard Telcordia GR-253 settings, and the Inherited profile, which sets all alarm severities to transparent (TR). If an alarm has an Inherited profile, it inherits (copies) its severity from the same alarm's severity at the next level. For example, a card with an Inherited alarm profile copies the severities used by the node that contains the card. The Inherited profile is not available at the node level.
10.3.1 Creating and Modifying Alarm Profiles
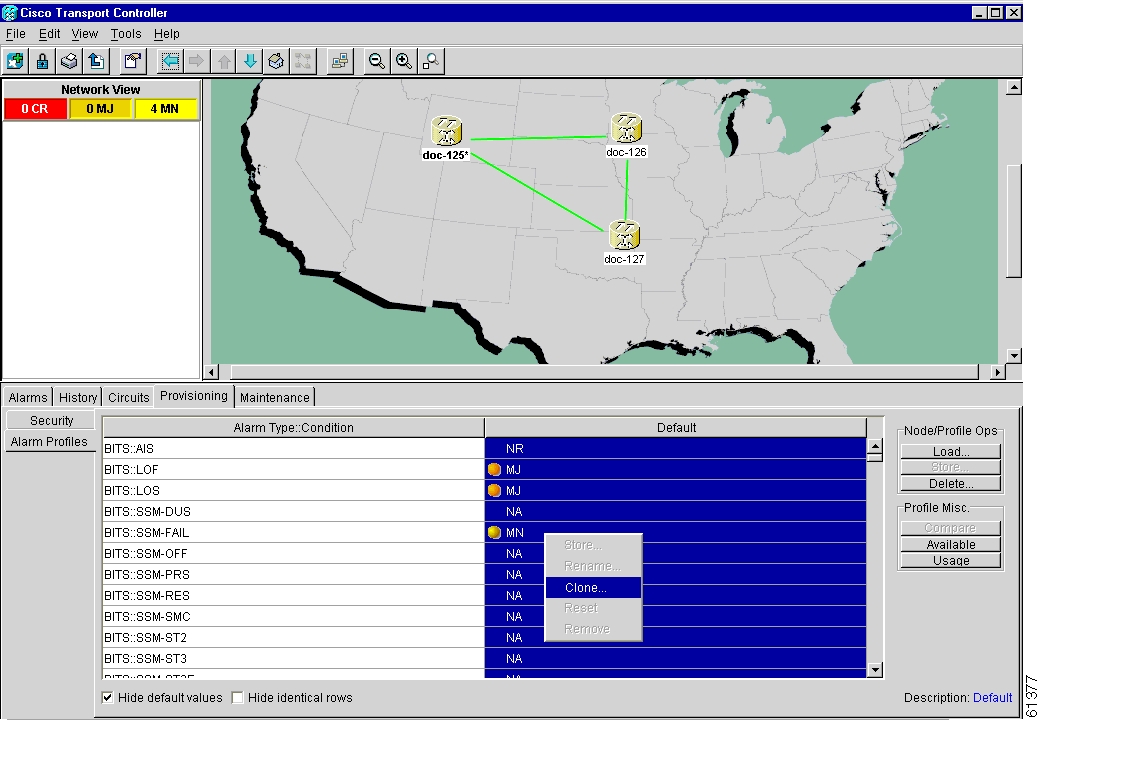
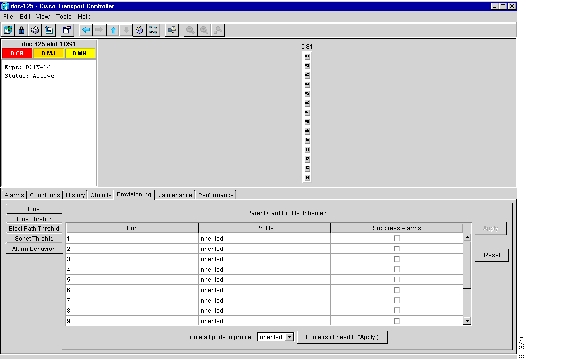
Alarm profiles are created at the network view using the Provisioning > Alarm Profiles tabs ( Figure 10-7.) A default alarm profile (in the Default column) is pre-provisioned for every alarm. After loading the Default profile on the node, you can use the Clone feature to create new profiles based on the default alarm profile. After the new profile is created, the Alarm Profiles tab shows the default profile and the new profile.
Figure 10-7 Alarm profiles screen showing the default profiles of the listed alarms
Procedure: Create an Alarm Profile
Step 1
Step 2
Step 3
Step 4
Step 5
Step 6
Step 7
Step 8
Profile names must be unique. If you try to import or name a profile that has the same name as another profile, CTC adds a suffix to create a new name.
Step 9
A new alarm profile (named in Step 5) is created. This profile duplicates the severities of the default profile and is added as a new column on the far right-hand side.
Step 10
a.
b.
c.
d.
e.
f.
Note
10.3.1.1 Alarm Profile Menus
The Alarm Profiles tab displays two menus on the right-hand side, Node/Profile Ops and Profile Misc, which include six alarm profile buttons. Table 10-5 lists and describes each of the alarm profile buttons.
10.3.1.2 Alarm Profile Editing
Table 10-6 lists and describes the five profile editing options available when you right-click in an alarm profile column.
10.3.1.3 Alarm Severity Option
You change or assign alarm severity using a menu. To view this menu, right-click the alarm you want to change in its alarm profile column. Seven severity levels appear for the alarm:
•
•
•
•
•
•
•
Transparent and Unset only appear in alarm profiles; they do not appear when you view alarms, history, or conditions.
10.3.1.4 Row Display Options
In addition to the alarm profile tabs, the Alarm Behavior tab displays two checkboxes at the bottom of the screen: Hide default values and Hide identical rows. The Hide default values checkbox highlights alarms with non-default severities by clearing alarm cells with default severities. The Hide identical rows checkbox hides rows of alarms that contain the same severity for each profile.
10.3.2 Applying Alarm Profiles
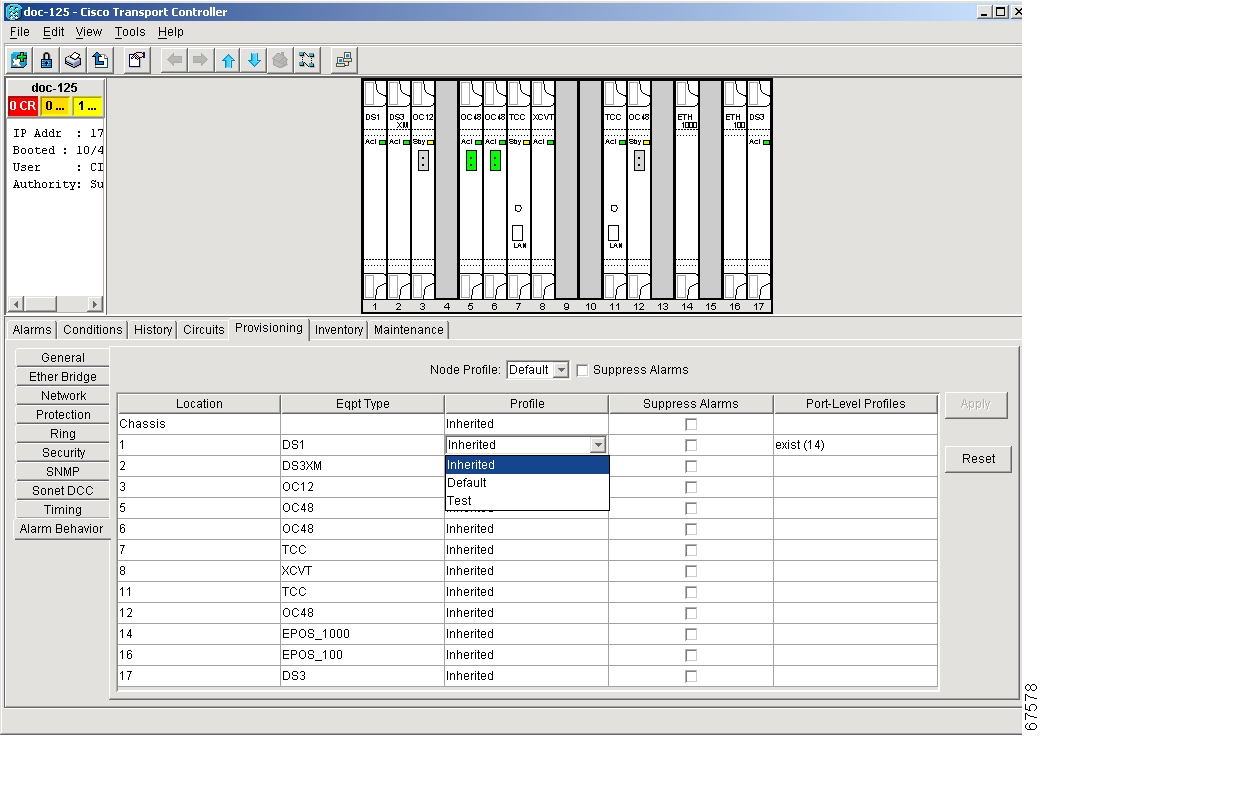
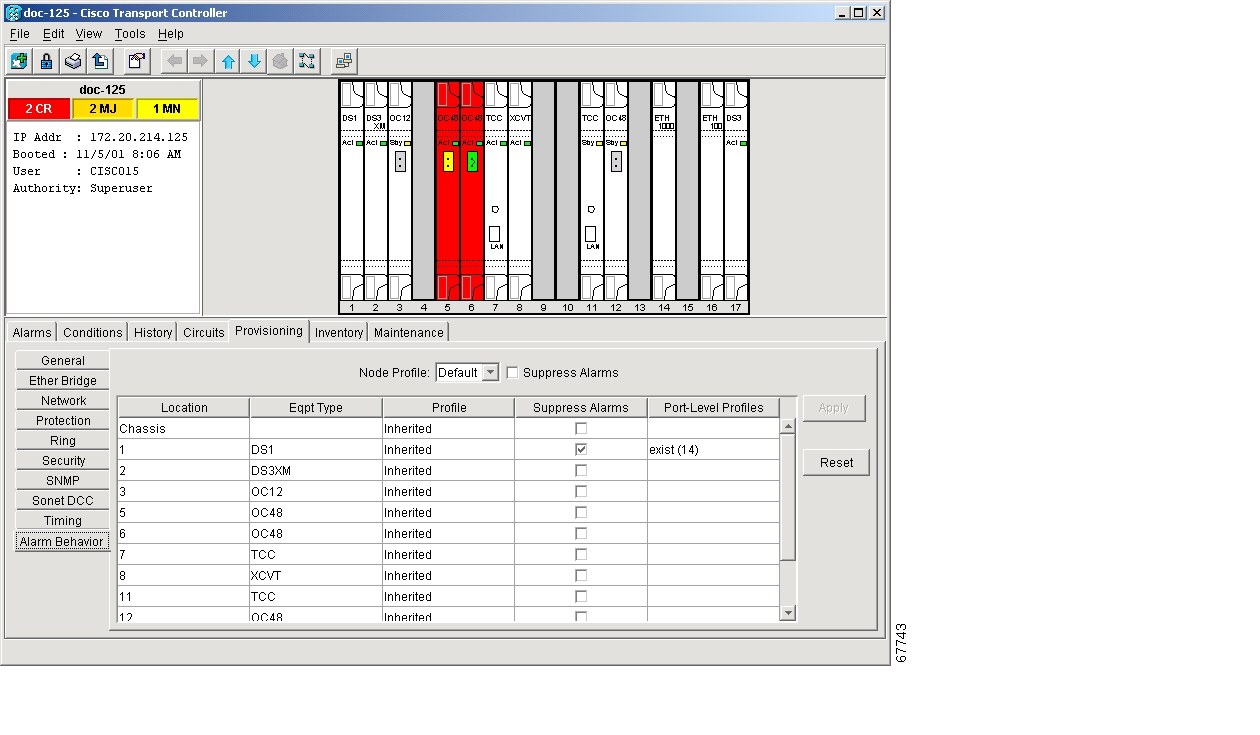
In CTC card view, the Alarm Behavior subtab displays the alarm profiles of the selected card. In node view, the Alarm Behavior subtab displays alarm profiles for the node. Alarms form a hierarchy. A node-level alarm profile applies to all cards in the node, except those that have their own profiles. A card-level alarm profile applies to all ports on the card, except those that have their own profiles.
At the node level, you may apply profile changes on a card-by-card basis or set a profile for the entire node. Figure 10-8 shows the profile of a DS-1 card being changed to Inherited at the node view.
Figure 10-8 Node view of a DS1 alarm profile
At the card level, you can apply profile changes on a port-by-port basis or set all ports on that card at once. Figure 10-9 shows the affected DS-1 card; notice the CTC shows Parent Card Profile: Inherited.
Figure 10-9 Card view of a DS1 alarm profile
Procedure: Apply an Alarm Profile at the Card View
Step 1
Step 2
Step 3
a.
b.
c.
Step 4
a.
b.
c.
d.
Tip
Procedure: Apply an Alarm Profile at the Node View
Step 1
Step 2
Step 3
a.
b.
c.
Step 4
a.
b.
c.
Note
Tip
10.4 Suppressing Alarms
Suppressing alarms causes alarms to appear under the Conditions tab instead of the Alarms tab. It prevents alarms from appearing on CTC Alarm or History tabs or in any other clients. The suppressed alarms behave like conditions, which have their own non-reporting (NR) severities. Under the Conditions tab, the suppressed alarms appear with their alarm severity, color code, and service-affecting status.
Note
Procedure: Suppressing Alarms
Step 1
At the card level, you can suppress alarms on a port-by-port basis. At the node level, you can suppress alarms on a card-by-card basis or the entire node.
Step 2
Figure 10-10 The suppress alarms checkbox
Step 3
The node sends out autonomous messages to clear any raised alarms.
Note
![]()
![]()
![]()
![]()
![]()
![]()
![]()
![]()
Posted: Fri Feb 22 16:10:16 PST 2008
All contents are Copyright © 1992--2008 Cisco Systems, Inc. All rights reserved.
Important Notices and Privacy Statement.