|
|

This chapter provides an overview of trap messages generated by the LightStream 2020 multiservice ATM switch (LS2020 switch). It describes how traps are generated, the types of traps generated, their formats, and their relative priorities.
Traps inform you of network events. When a network event occurs, the LS2020 switch sends a trap message, or possibly a series of messages, to one or more user-specified destinations that may include the network management station (NMS), the switch's local console, a log file on the switch, or a terminal that is running the command line interface (CLI). A trap may notify you of a serious condition that requires immediate corrective action, or it may give you information that, while important, may not require any action. You can initiate further interaction with an LS2020 switch to determine the nature and extent of the event signaled by the trap.
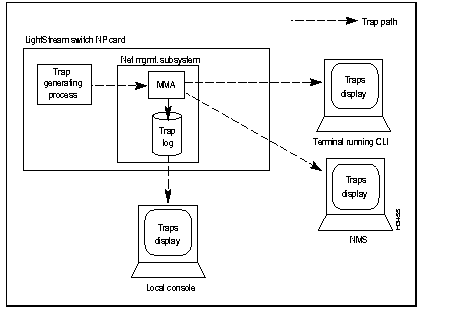
Figure 1-1 shows the flow of traps through the LS2020 system. Traps are passed from software processes to another process called the master management agent (MMA). Traps are stored in the trap log and sent to the local console, the CLI process, or an NMS. Traps are generated by processes running on an LS2020 switch and sent to the MMA.
By default, the MMA writes the traps to a log file on the switch's network processor (NP). From there, traps are sent to the local console, if one is present. Traps can also be displayed on one or more NMSs, as well as on a terminal running the CLI.

By default, a switch sends traps only to its trap log and to its local console, if one is present. However, you can configure a switch to send traps to another NP or to an NMS for viewing. This capability can be used to collect traps for all the switches in the network in a single place or to send traps to as many as 25 different destinations in the network. See the LightStream 2020 Installation Guide for information about changing trap delivery addresses.
You can also copy a switch's trap log to an NMS or workstation and view it there. See the section entitled "Moving Trap Log from NP" in the chapter "Managing LightStream 2020 Traps" for information about copying the trap log to another LS2020 system.
LS2020 switches generate five types of traps:
Each type of trap is described briefly below.
The SNMP traps displayed by the LS2020 switch are the standard SNMP traps defined by the SNMP MIB-II specifications. Such traps are displayed as "generic" traps. SNMP traps are used by LS2020 network operators.
Link Up and Link Down are examples of SNMP traps.
Operational traps provide information on the key system components to help you find and correct problems. Operational traps indicate that something is wrong with the system or that a significant change has occurred in system status. Operational traps can also be used to report the status of hardware components. Operational traps are of primary interest to network operators.
Port 3 down is an example of an operational trap.
Operational traps are divided into three categories:
Within each software process, operational traps are numbered from 1 to 999. Note that traps numbered from 1000 to 1999 are not documented, since the only response that you can take in such cases is to call your customer service representative.
Informational traps provide supplemental details on problems that are reported by some operational and SNMP traps. Informational traps are used by customer support representatives to do advanced troubleshooting and software debugging.
The following is an example of an informational trap:
Trunk emtb7.2.5->emtb8.4.2 DOWN [transitioning to down (from has-vci)]
Within each software process, informational traps are numbered from 2000 to 2999.
Trace traps are used to track a sequence of actions through a process. Trace traps are used by customer support representatives to do advanced troubleshooting and software debugging. Within each software process, trace traps are numbered from 3000 to 3999. Because trace traps are not intended for customer use, they are not discussed in detail in this manual.
Debug traps are used to find and solve serious software problems in an LS2020 switch. Debug traps are used by customer support representatives and developers. Within each software process, debug traps are numbered from 4000 to 4999. Because debug traps are not intended for customer use, they are not discussed in detail in this manual.
Each type of trap is assigned a priority level that cannot be changed. Table 1-1 lists the priorities of the different trap types in descending order.
| Trap Type | Priority |
|---|---|
| SNMP | Highest |
| Operational | Lower
|
| Informational | Lower
|
| Trace | Lower
|
| Debug | Lowest |
You can use priority levels to set a trap reporting threshold that controls which trap types will be reported. Setting the trap reporting threshold to a given priority level causes the system to report all traps at or above that level, and to discard traps below that level. For example, if you set the trap reporting threshold to informational, the system reports informational, operational, and SNMP traps, while discarding trace and debug traps.
By default, the system displays all SNMP and operational traps and logs all SNMP, operational, and informational traps for your network. (Trace and debug traps are discarded.) This arrangement works well for most networks. If you want to change the trap reporting threshold, refer to the chapter entitled "Managing LightStream 2020 Traps."
Two trap formats have been defined for the LS2020 switch:
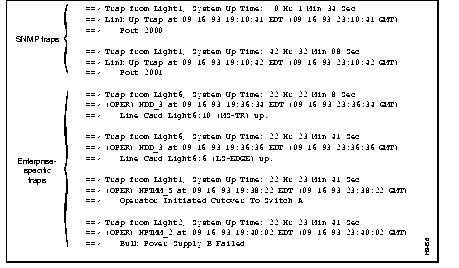
The SNMP trap format is defined by prevailing MIB-II specifications, while enterprise-specific traps are specific to the LS2020 switch. Figure 1-2 shows a sample trap display from nodes called Light1 and Light6. The display contains both SNMP and enterprise-specific traps.

Standard SNMP traps include the following information:
Enterprise-specific traps contain the following information:
Trace and debug traps also include the process identification (PID) number and process alias name of the process in which the trap occurred.
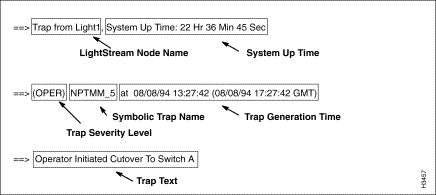
Figure 1-3 shows each field of a sample enterprise-specific trap.

|
|