The primary tool to configure and monitor the User Control Point (UCP) software is the Network Control Console (NCC). The NCC is a Windows NT-based graphical interface that lets you configure points of presence (POPs), servers and services, monitor their activity and performance, and view messages sent between these objects for troubleshooting purposes.
The following sections explain how to start and stop the NCC.
Starting the NCC
To start the NCC:
Step 1 From the Windows Start menu, select Network Control Console.
The Admin dialog box appears.
Step 2 Enter your Administrator name and password in the appropriate fields.
Step 3 Click OK.
Stopping the NCC
To stop the NCC, select Exit from the File menu.
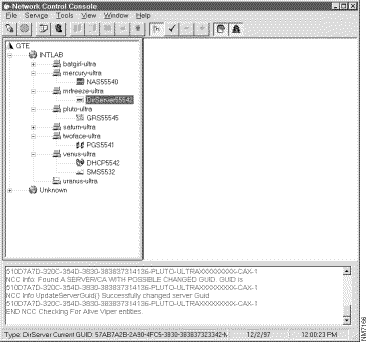
Using the NCC Main Window
When the NCC starts, it displays the main window, shown here:
The left side of the window displays a tree view of your UCP configuration. The tree shows your network in four levels, starting with the root (or network) level, followed by each POP, then each server, and finally, each service.
To expand a collapsed branch, double-click the branch. A plus sign (+) next to any of the icons indicates that the branch is collapsed and that there are entities beneath that branch of the tree. A minus sign (-) appears to indicate that all entities under that branch are visible.
To collapse an expanded branch, double-click on the branch.
The bottom portion of the screen is the info bar, which displays messages sent between UCP entities and other information.
At the very bottom of the screen is the status bar, which displays information about the selected entity.
Using the Toolbar
The toolbar runs across the top of the screen, just below the menu bar. The toolbar buttons and their descriptions are listed in Table 4-1<Xref_Color>.
Table 4-1 Toolbar Button Descriptions
Button
Description
Starts the selected service
Stops the selected service
Displays the Properties dialog box for the selected entity
Deletes the selected entity
Displays the Transactions graph for the selected entity
Displays the Backlog graph for the selected entity
Displays the Response time graph for the selected entity
Displays the Packets by Service graph for the selected entity
Displays the Topology Viewer
Toggles automatic tree updates on and off
Refreshes the tree
Sends a Discover event to all running entities
Collapses the tree one level
Expands the tree one level
Toggles the display of the information bar on and off
Toggles the tree display on and off
Showing or Hiding the Info Bar, Status Bar, Toolbar, and Tree View
The info bar, status bar, toolbar, and tree view are all displayed by default. You can hide all of them, or if they are hidden, display them using the View menu. The View menu indicates that an item is displayed with a check mark next to that item. To hide or display one of these items, select the item from the View menu. If the item is displayed, it will be hidden, and if hidden, it will be displayed.
Reloading the Tree
To reload the tree view, select Reload Treefrom the View menu.
Refreshing the Tree
To refresh the tree view, select Refresh Treefrom the View menu.
Clearing Info Bar Text
To clear the info bar of all existing text, select Clear Info Text from the View menu.
Pausing Info Bar Text
To pause the info bar from showing new text, select Pause Info Text from the View menu.
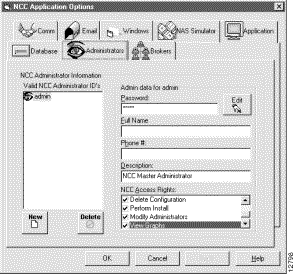
Configuring Administrators
To access the NCC, you must log in with a valid administrator ID when the NCC starts. The NCC comes with one administrator ID configured by default. That ID is given all access rights to the NCC. You can add new administrator IDs, modify existing IDs, or delete existing IDs.
Adding an Administrator
To add a new administrator:
Step 1 From the Tools menu, select Options. The NCC Application Options dialog box appears.
Step 2 Click the Administrators tab.
Step 3 Click New.
Step 4 In the Valid NCC Administrator IDs list, enter the ID of the new administrator.
Step 5 To create a password for the new administrator ID, click Edit.
The Password dialog box appears.
Step 6 Enter and re-enter the password in the value fields.
Step 7 In the Full Name field, enter the administrator's name.
Step 8 In the Phone # field, enter the administrator's phone number.
Step 9 In the Description field, enter a description of this administrator ID.
Step 10 The new administrator ID is given all access rights. To remove an access right, deselect its check box. The available rights are:
Start Services
Stop Services
Modify Entity Configuration
Delete Configuration
Perform Install
Modify Administrators
View Graphs
Step 11 Click OK.
Modifying an Administrator
To modify an existing administrator:
Step 1 From the Tools menu, select Options.
The NCC Application Options dialog box appears.
Step 2 Click the Administrators tab.
Step 3 In the Valid NCC Administrator IDs list, click the administrator you want to modify.
Step 4 To change the administrator ID, in the Valid NCC Administrator IDs list, enter the new ID.
Step 5 To change the administrator's password, click Edit.
The Password dialog box appears.
Step 6 In the value fields, enter and re-enter the new password.
Step 7 In the Full Name field, enter the administrator's name.
Step 8 In the Phone # field, enter the administrator's new phone number field.
Step 9 In the Description field, enter the new administrator's description.
Step 10 To change the administrator's access rights, select or deselect the check boxes next to each right you want to change. If a check box is enabled, the administrator is granted the right. If a check box is empty, the administrator is not granted the right. The available rights are:
Start Services
Stop Services
Modify Entity Configuration
Delete Configuration
Perform Install
Modify Administrators
View Graphs
Step 11 Click OK.
Deleting an Administrator
To delete an administrator:
Step 1 From the Tools menu, select Options.
The NCC Application Options dialog box appears.
Step 2 Click the Administrators tab.
Step 3 In the Valid NCC Administrator IDs list, click the administrator you want to delete.
Step 4 Click Delete.
Step 5 Click OK.
Creating a Network
A network is the first level of the UCP network. By default, the network is called root. To modify the network name:
Step 1 From the Tools menu, select Options. The NCC Application Options property sheet appears.
Step 2 Click the Application tab.
Step 3 In the Preferences window, edit the Tree View Root Node field.
Step 4 Click OK.
Creating POPs
A point of presence (POP) is the second level of the UCP network. After you have actually installed a POP, you must update the NCC by adding the new POP to the NCC database.
Adding a New POP
To add a new POP to the NCC:
Step 1 Right-click the Network icon in the tree.
Step 2 From the popup menu, select New POP. A new POP appears, with a generic name.
Step 3 Enter the name of the new POP in the highlighted field next to the POP icon.
Deleting a POP
To delete an existing POP from the NCC:
Step 1 Right-click the POP you want to delete.
Step 2 From the popup menu, choose Delete. A dialog box appears, asking if you want to delete the POP node and its associated data.
Step 3 Click Yes.
Managing Servers
A server is the third level of the network in UCP. After you have installed a server, you must update the NCC by adding and configuring the new server in the NCC database.
Adding a Server
To add a new server:
Step 1 In the tree, right-click the POP on which you want to install a new server.
Step 2 From the popup menu, select New Server.
A new server appears, with a generic name.
Step 3 Enter the name of the new server in the highlighted field next to the POP icon.
Configuring a Server
To configure an existing server:
Step 1 In the tree, right-click the server you want to configure.
Step 2 From the popup menu, select Properties. The Server Properties dialog box appears.
The Server Properties dialog box contains two tabs:
General tab—Contains information about the server itself.
System tab—Contains information about the server that lets other entities communicate with it.
Step 3 In the General tab and the System tab, modify or enter the data as necessary. (The fields in the two tabs are described in Table 4-2 and Table 4-3.)
Step 4 Click OK when you are finished making changes to the data.
Table 4-2 Server Properties—General Tab Fields
Field
Description
Pop Short Name
Lists the name assigned to the POP where the server was installed when the POP was added to the UCP directory structure.
Description
Short description of the server.
GUID
Globally unique identifier (GUID) for the control adapter on the server. This value is created when UCP is installed; you cannot change this value.
Serial Number
Server serial number.
Version Number
UCP product version number installed on the server. You cannot change this field.
Phone 1
Phone number for contacting the server administrator.
Phone 2
Alternate phone number for contacting the server administrator.
Table 4-3 Server Properties—System Tab Fields
Field
Description
IP Address
IP address used by the server. This field is for reference purposes—it does not actually set the IP address used by the server.
Heartbeat Interval
Specifies the interval (in seconds) between heartbeat events published by the control adapter installed on the server.
Root ID
Server root ID.
Root Password
Server root password.
Program Path
Path to the directory where the UCP software is installed on the server.
Shared Secret
Shared secret used by the information brokers and adapters to encrypt data sent over the network.
Stopping a Server
To stop a server:
Step 1 In the tree, right-click the server you want to stop.
Step 2 From the popup menu, select Stop.
Deleting a Server
To delete a server:
Step 1 In the tree, right-click the server you want to delete.
Step 2 From the popup menu, select Delete.
A dialog box appears, asking if you want to delete the server node and its associated data.
Step 3 Click Yes.
Viewing Graphs of the Network, POPs, Servers, or Services
The NCC can display a number of graphs to monitor the activity and performance of the network, a POP, or a server. The different graphs available and the information they show are:
Backlog—The current number of queued packets for each UCP service that is running. The window shows the packets for the following services:
PGS—Protocol Gateway Service.
CSII—CiscoSecure Information Bus Interface (CSII). This icon represents the CiscoSecure Access Control Server (ACS), which provides authentication, authorization, and accounting (AAA) services.
Errors—The number of errors for the selected object. For example, selecting Errors while a server is selected displays a graph of the number of errors that have occurred on that server.
Exceptions—A graphical representation of the number of exceptions that have occurred for the object selected in the directory tree display. For example, selecting Exceptions from the POP menu while a POP is selected shows the exceptions that have occurred for the POP. Selecting Exceptions while a server is selected shows the exceptions for the server.
There are three types of Exceptions:
Errors—Indicate serious program failures that may require corrective action. A green bar or section indicates errors.
Warnings—Indicate conditions where proceeding would be dangerous. Blue indicates warnings.
Info—Provide information about the current course of action. Red indicates exceptions.
Note The Exceptions graph can also be displayed for services
and other entities.
Packets by Service—The number of packets processed by each UCP service since the NCC was first started. Packets are tracked for the following services:
CSII—CiscoSecure Information Bus Interface (CSII). This icon represents the CiscoSecure ACS, which provides authentication, authorization, and accounting services.
DNS—Domain Name Service.
Mother cache.
GRS—Global Roaming Service.
Use the row of buttons at the bottom of the window to select the category of packets to display. When a button is not selected, the color of the button appears darker. When a button is selected, its color appears lighter and a bar for the category of packets associated with the button appears.
You can display the following categories of packets:
Received packets
Processed packets
Accepted packets
Rejected packets
Backlog packets
Timed Out packets
Response Time—A graph of system response time in relation to the number of users logged on. It is used in conjunction with the network access server (NAS) simulator to test service response time.
The left portion of the graph shows the number of users logged in. The right portion of the graph shows the response time.
Transactions by Service—The average transactions by service for the currently active UCP services. This window shows transactions for the following services:
PG—Protocol Gateway Service (PGS).
CSII—CiscoSecure Information Bus Interface (CSII). This icon represents the CiscoSecure ACS, which provides AAA services.
The window presents two averages for transactions per service—current and rolling average. The graph of current transactions displays the average over the current polling interval, which is set in the Communication tab in the Service Properties dialog box. The rolling average graph displays the average over the last five polling intervals.
If you notice a sudden drop in the current average while the rolling average remains relatively constant, this might indicate a serious problem with UCP; for example, a service might have stopped unexpectedly.
Note The Transactions by Service graph can also be displayed for other services, such
as DNS, Mother cache, and GRS.
To view any of these graphs:
Step 1 Right-click on the entity in the tree for which you want to view a graph.
Step 2 From the popup menu, select the graph you want to view.
When a graph is displayed, a graph toolbar appears on top of the graph dialog box. The graph toolbar buttons and their functions are described in Table 4-4.
Table 4-4 Graph Toolbar Button Descriptions
Button
Description
Copies the graph to the clipboard as a bitmap
Copies the graph data to the clipboard as text
Prints the graph
Changes the graph type
Changes the color of the selected object
Toggles 3D and 2D view
Rotates the chart
Zooms in on the chart
Toggles the display of the legend on and off
Toggles the display of the series legend on and off
Toggles the vertical grid on and off
Toggles the horizontal grid on and off
Changes the text fonts
Displays chart options dialog box
Managing Brokers
This section describes how to configure the ActiveWeb Information Broker(s). For more information, see the ActiveWeb documentation and the Cisco User Control Point Software Installation Guide.
Configuring the Default Broker
After installing NCC, it is important that NCC can communicate with the ActiveWeb Information Broker(s). To configure NCC to communicate with the default ActiveWeb Information broker, follow these steps:
Step 1 Start NCC.
Step 2 From the Tools Menu, select Options.
The Options properties sheet appears.
Step 3 Verify that NCC is pointing to the correct broker. You can do this by making sure the Broker Host field indicates the host name IP address of the default broker.
Step 4 Click OK.
Step 5 From the Tools Menu, select AWAD Configuration.
The AWAD Configuration dialog box appears.
Step 6 Make sure the host name or IP address of the default broker is in the Broker Name field.
Step 7 Exit and restart NCC.
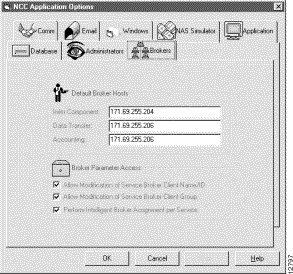
Configuring UCP Services for Multiple Brokers
Note Before performing any steps in this section, install ActiveWeb on each system that
will host brokers and see the "Creating and Starting Multiple ActiveWeb Information
Brokers" section in the Cisco User Control Point Software Installation Guide.
Because all events flow through the Information Broker, it is a potential performance bottleneck. To improve performance and throughput, UCP event traffic can be distributed among as many as four brokers.
Each broker can be assigned to the following categories:
Standard (heartbeat) events
DataTransfer events
InterComponent events
Accounting events
To configure UCP services to communicate with multiple brokers, follow these steps:
Step 1 From the Tools menu, select Options. The NCC Application Options properties sheet appears.
Step 2 Click the Brokers tab.
Step 3 In the Default Broker Hosts section, select a broker for each of the following categories:
InterComponent
DataTransfer
Accounting
Step 4 Click OK.
Note This procedure only configures the default settings that will be used by new services.
If services are already configured, you will need to manually configure their settings. See
the "Manually Configuring Broker
Settings for UCP Services" section.
Manually Configuring Broker Settings for UCP Services
To manually configure broker settings for UCP services, follow these steps:
Step 1 Right-click a service and select Properties from the popup window.
Note Do not modify the Client Name and the Client Group fields.
Step 2 In the Broker Info section, click Standard in the Broker Type frame.
The Standard (heartbeat) broker manages heartbeat events from UCP components.
Step 3 In the Host field, enter the name or IP address of the system running the Heartbeat broker.
Step 4 In the Name field, enter the name of the broker (default: Broker #1).
Step 5 In the Broker Info section, click InterComponent in the Broker Type frame.
The InterComponent broker manages communication between UCP components.
Step 6 In the Host field, enter the name or IP address of the system running the InterComponent broker.
Step 7 In the Name field, enter the name of the broker.
Step 8 In the Broker Info section, click DataTransfer in the Broker Type frame.
The DataTransfer broker manages the transfer of profiles from the SMS to the Data Store and subsequently to the caches.
Step 9 In the Host field, enter the name or IP address of the system running the DataTransfer broker.
Step 10 In the Name field, enter the name of the broker.
Step 11 In the Broker Info section, click Accounting in the Broker Type frame.
The Accounting broker manages the event traffic for the Accounting Parser and NetFlow Parser services.
Step 12 In the Host field, enter the name or IP address of the system running the Accounting broker.
Step 13 In the Name field, enter the name of the broker.
Step 14 Click Apply, then OK.
Step 15 Repeat this procedure for each UCP service.
Managing Services
Services are the bottom level of the UCP network. There are a variety of services available to UCP users:
Dynamic Host Configuration Protocol (DHCP)
Domain Name Service (DNS)
Protocol Gateway Service (PGS or PGW)
Network access server (NAS)
Subscriber Management Service (SMS)
Cache Manager
Global Roaming Server (GRS)
NetFlow Service
CiscoSecure ACS
Each service, once installed on a server, can be started, stopped, monitored, and configured from the NCC.
Starting a Service
To start a service:
Step 1 In the tree, right-click the server on which you want to start a service.
Step 2 From the popup menu, select Start New Service.
Step 3 From the next popup menu, select the name of the service you want to start.
Stopping a Service
To stop a service that is currently running:
Step 1 In the tree, right-click the service you want to stop.
Step 2 From the popup menu, select Stop.
Configuring a Service
Note This section is intended to be used as a reference. If you are starting and configuring
a service on a server for the first time, refer to the Cisco User Control Point Software
Installation Guide.
To configure a service:
Step 1 In the tree, right-click the service you want to configure.
Step 2 From the popup menu, select Properties. The Service Properties dialog box appears.
For most services, the Service Properties dialog box contains seven tabs. (The Protocol Gateway and DHCP services contain nine tabs.) The seven tabs common to all services are:
General tab—Allows you to view and set general configuration parameters for the currently selected UCP service.
Administration tab—Allows you to set administration parameters for the currently selected UCP service.
Performance tab—Lets you specify parameters that control system performance and generation of system alerts and to view performance statistics.
Logging tab—Controls how system messages are saved to a log file.
Mode tab—Used to specify the mode in which the currently selected UCP service runs.
Communication tab—Used to configure options related to communication with the selected service.
Specific tab—Used to configure options specific to each service. You can display the configuration parameters in two formats: A tabular format by clicking the Grid Display button, or a tree format by clicking the Tree Display button. To change a value in the grid display, type over the existing value. To change a value in the tree display, select the parameter you want to change in the tree display, and enter the new value in the Current Value field.
Step 3 Modify or enter data as necessary in the various tabs. Descriptions of the various fields follow in Table 4-5 through Table 4-11. Note that Table 4-5 contains descriptions of all specific parameters for all services. Each service will only have a portion of the parameters on that list.
Step 4 When finished making all changes to the service data, click OK.
Table 4-5 Service Properties—General Tab Fields
Field
Description
Name
Name of the service (read only).
Type
Service type (read only).
Path
Directory path to where the service is installed on the host server (read only).
Version
Optional text reference that allows the administrator to enter a version number for the service.
PID
Optional text reference that shows the Process Identifier (PID) of the running service.
GUID
Globally unique identifier (GUID) of the service adapter controlling the service (read only).
Host
Host name or IP address of the broker for the selected category of broker events. To assign a broker host for another category of broker events, select another category in the Broker Type section.
Name
Name of the broker for the selected category of broker events. For example, "Broker #1."
Client Name
Client ID of the client.
Client Group
Name of the client group to which the client was assigned in the information broker configuration.
Server
Name of the server where the service is installed (read only).
Pop Name
Name of the point of presence (POP) where the service is installed (read only).
Primary
Primary backup service for the selected service.
Secondary
Secondary backup service for the selected service.
Description
Description of the service.
Table 4-6 Service Properties—Administrator Tab Fields
Field
Description
Primary
Name of the primary administrator. If there is no primary administrator, select None.
Secondary
The name of the secondary administrator. If there is no secondary administrator, select None.
Page When Service Goes Down
Check this box if you want the administrator to receive a notification page if the server running the service goes down.
Notify if Administrators are Changed
Check this box if you want the administrator to receive a notification page when the administrator is changed.
Notify Clients When the Service Goes Down
Check this box if you want administrators of clients to be notified when the service goes down.
Table 4-7 Service Properties—Performance Tab Fields
Field
Description
Max Threads
Maximum number of processing threads that the PGS will use to process transactions for the service.
Max Queue Size
Maximum size for the PGS queue that holds pending transactions for the service.
Initial Memory Pool Size
Initial size of the memory pool the PGS allocates to processing activity for the service.
Default Packet Size (Bytes)
Default packet size for packets used to process transactions for the service.
Quickly Report Overload Pattern
Not currently implemented.
Processing
Minimum percentage of processing utilization that triggers an alert to the administrator.
CPU
Minimum percentage of CPU utilization that triggers an alert to the administrator.
Memory
Minimum percentage of memory utilization that triggers an alert to the administrator.
Throughput from Service (per second)
Total number of packets processed per second by the service for the last check interval.
Average Throughput
Average number of packets processed per second for a specified interval.
Current Backlog
Total number of packets in the service queue for the last check interval.
Average Backlog
Average number of packets in the service queue for a specified interval.
Table 4-8 Service Properties—Logging Tab Fields
Field
Description
Logging Type
Specifies the type of logging. You can specify the following:
None—Messages will not be logged.
File—Messages will be logged to the file specified in the Logging Target File Name field.
System Log—Messages will be sent to the server's current configured syslog.
ActiveWeb—Messages will be sent via the Information Bus.
Logging Target File Name
Directory path and filename for the log file.
Max Log File Size
Maximum size for the log file (in kilobytes).
Table 4-9 Service Properties—Mode Tab Fields
Field
Description
Running Mode
Specifies which mode the service runs in. You can select the following running modes:
Normal—Displays all messages deemed important for the administrator, such as errors.
Debug—Displays all messages displayed in normal mode, plus messages relating to service state and health.
Diagnostic—Displays all messages displayed in debug mode but in further detail so a remote administrator can diagnose problems.
Running Mode Level
Level of detail of information displayed by the various messages.
Run Service as Daemon Process
Indicates whether the service will have a parent process or tty dependencies.
Auto Restart Enabled
Specifies that the service is restarted automatically if it goes down.
Race Checking Enabled
When enabled, the service will perform extra checking for race conditions. A race condition is similar to an endless loop where a process cannot transition to the next logical step.
Table 4-10 Service Properties—Communication Tab Fields
Field
Description
Listening Port Number
TCP/IP or UDP port number on which the service listens for requests.
Receive Port Buffer Size
Size of the receiving buffer that holds the incoming packets.
Target Host Retries
Number of times a transmission is retried after a failure.
HeartBeat Interval
Number of seconds that elapse before the service publishes a HeartBeat event.
Race Check Interval
When a service is started, then subsequently stopped by a different session of the NCC in a short period of time, a warning is issued. This field determines the length of time, in seconds, the service must be running to avoid such a warning.
Resource Interval
Number of seconds that elapse before system resources are checked.
Status Report Interval
Number of seconds that elapse before the service publishes a status report.
Long Running Avg Report Interval
Length of the long interval, in seconds, that the NCC uses to calculate UCP service performance averages such as Average Throughput and Average Backlog.
Short Running Avg Report Interval
Length of the short interval, in seconds, that the NCC uses to calculate UCP service performance averages such as Average Throughput and Average Backlog.
Table 4-11 Service Properties—Specific Tab Fields
Parameter
Description
aaservername
AAA server name.
accountingport
Port number to use to send accounting packets.
accountingservername
Account service host name.
addauthority
Turn addauthority on/off.
clienttablepath
Path where client table is.
cliscriptpath
Directory path to the script for the CiscoSecure information interface adapter.
configurationfile
Configuration filename.
datafile
Specifies the directory path and filename for the data file used by the CiscoSecure Information Bus Interface (CSII). This file contains performance information related to the CiscoSecure ACS.
dbconnectstring
Not used.
dbserverhost
Name of the host running the CiscoSecure ACS Data Store server.
dbserverport
Port number of the host running the CiscoSecure ACS Data Store server.
dbuserinfo
Not used.
deltatodecrpersec
Packet decrement per second.
deltatoincrpersec
Packet increment per second.
dhcpforward
Protocol Gateway Service requestor which, if enabled, permits DHCP requests to be forwarded to a PGS to a remote DHCP server.
dumpauthenticatedpacket
1: Dump authenticated packet. 0: Otherwise.
dumpdebug
1: Dump debug information. 0: No dump.
dumpleasescavenger
1: Dump scavenger-related information. 0: No dump.
dumploadleasedb
1: Dump lease records. 0: No dump.
dumppacket
1: Dump packet related information. 0: No dump.
dumpperformance
1: Dump performance status periodically. 0: No dump.
dumprequestpacket
1: Dump request packet. 0: Otherwise.
dumpserviceadapter
1: Dump ActiveWeb event-related information. 0: No dump.
dumpsettings
1: Dump settings. 0: Otherwise.
dumptolog
1: Dump output to log. 0: No dump.
dumpuserrecord
1: Dump user record. 0: Otherwise.
dynamicip
Protocol Gateway Service requestor which, if enabled, obtains IP addresses from a remote DHCP server for Framed IP users logging in without an IP address.
enable
Used to turn a specific item on and off.
guidtarget
GUID of SMS adapter that subscribes to events published by the NetFlow Parser.
hashsize
Memory hash table size, number of buckets.
indextablefile
Database file for cache index.
ippoolmanagedbname
Database name where IP range events are stored.
ippoolmanagedbtablename
Database table name where IP range events are stored.
leasedbfile
Lease database file location.
libraryname
Location of shared library.
limitforstop
(-1): Never stop. (Positive integer n): Stop after n requests.
list
List of states. Current states are: UserRecord, DynamicIP, Authentication, Authorization, DHCPForward.
list
List of protocols. Current protocols are: RADIUS, DHCP, Radius2Radius.
maintaininterval
Frequency to remove expired entries.
maxpersec
Maximum packet rate.
maxwaitingtime
Time to stay.
minpersec
Minimum packet rate.
netflowdirectoryname
Directory where NetFlow flat files are stored.
nfchecktimeInterval
Number of minutes to elapse before service checks the NetFlow flat files and publishes NetFlow information to the SMS adapter.
nfcollectordirectoryname
Directory where NetFlow Collector executables are stored.
noheartbeat
1: Don't send out heartbeat. 0: Otherwise.
noipcollector
1: Disable IP collector. 0: Otherwise.
Nologtimestamp
1: No time stamp will be output to the log file. 0: Time stamp is output.
performancestatusinterval
Frequency of performance reporting. Useful only when dumpPerformance is set to 1.
port
Port to use for remote port number.
portnumber
Port number.
primaryserver
Specify the primary server in the format: <port> <host name>.
readbufsize
Listening socket buffer size.
replyportnumber
Reply port number.
replyqueuesize
Queue size.
requesthashtablesize
Hash table size.
restartflag
Not used.
retries
Number of retries.
runforeground
1: Run in foreground. 0: Otherwise.
scavengerrate
Time interval when scavenger checks for the threshold condition.
scavengerthreshold
Scavenger threshold, usually set to 80 (%).
servicetablefile
Not used.
sharedsecret
Shared secret to use.
start
Start state.
statemachine
State machine name.
subnetmanagedbname
Database name where subnet events are stored.
subnetmanagedbtablename
Database table name where subnet events are stored.
tablechkintervald
Not used.
tablequeryinterval
Not used.
tablequerytimeout
Not used.
targetcacheguid
Cache service GUID.
targetdsguid
Not used.
threadpoolsize
Number of threads.
timetoholdmax
Time interval at maximum rate.
timetoholdmin
Time interval at minimum packet rate.
user1
FQDN of user used for self-testing cache from command line (optional).
user2
FQDN of user used for self-testing cache from command line (optional).
user3
FQDN of user used for self-testing cache from command line (optional).
username
Not used.
userpassword
Not used.
userrecord
Protocol Gateway Service requestor which, if enabled, sends authentication requests (usually from a NAS) to a cache service that contains user data.
usertablefile
Database file for user and group records.
useserviceadapter
1: Service connects to the specified broker, sending heartbeat events and responding to other events. 0: Otherwise.
usethreadpool
On/off.
validateclient
1: Check client against entries in client table. 0: Do not check.
writebufsize
Sending socket buffer size.
Defining Valid Protocol Gateway Clients
The Service Properties dialog box includes a tab unique to the PGS— the Valid Clients tab, which lets you determine which network clients can request PGS.
Viewing and Modifying Existing Valid Protocol Gateway Clients
To view or modify existing valid PGS clients:
Step 1 In the tree, right-click the PGS service for which you want to view shared net information.
Step 2 From the popup menu, select Properties.
The Service Properties dialog box appears.
Step 3 Click the Valid Clients tab.
Step 4 In the Valid Clients list, click the client you want to view or modify.
Step 5 The client data is displayed in the Client Data fields. To modify the data, enter the new data in the Client Data fields as necessary. A description of the Client Data fields is provided in Table 4-12.
Step 6 Click OK.
Table 4-12 Service Properties—Valid Clients Tab Client Data Fields
Field
Description
Vendor Name
Service vendor name; determines which dictionary is used.
User Authentication Prefix
Name of the authentication file used to authenticate users.
Description
Text description of the client.
Location
DNS realm in which the client resides.
Shared Secret
Shared secret the client uses to authenticate itself; use the Edit button to modify.
Adding Valid Protocol Gateway Clients
Step 1 In the tree, right-click the PGS service for which you want to view shared net information.
Step 2 From the popup menu, select Properties.
The Service Properties dialog box appears.
Step 3 Click the Valid Clients tab.
Step 4 Click New.
A new icon representing the client appears in the Valid Clients list.
Step 5 Next to the icon in the Valid Clients list, enter the IP address or the host name of the new client.
Step 6 In the Client data fields, enter data as necessary. A description of the Client Data fields is provided in Table 4-12.
Deleting Valid Protocol Gateway Clients
Step 1 In the tree, right-click the PGS service for which you want to view shared net information.
Step 2 From the popup menu, select Properties.
The Service Properties dialog box appears.
Step 3 Click the Valid Clients tab.
Step 4 In the Valid Clients list, click the client you want to delete.
Step 5 Click Delete.
Step 6 Click OK.
Importing Valid Protocol Gateway Clients
Step 1 In the tree, right-click the PGS service for which you want to view shared net information.
Step 2 From the popup menu, select Properties.
The Service Properties dialog box appears.
Step 3 Click the Valid Clients tab.
Step 4 Click Import.
The Item Selection dialog box appears.
Step 5 In the Select a PGS Service field, select the PGS from which you want to import clients.
Step 6 Click OK.
The Item Selection dialog box closes.
Step 7 Click OK.
Selecting Valid Protocol Gateway Clients from Existing Network Clients
Step 1 In the tree, right-click the service for which you want to view shared net information.
Step 2 From the popup menu, select Properties.
The Service Properties dialog box appears.
Step 3 Click the Valid Clients tab.
Step 4 Click Select. The Existing Clients list appears.
Step 5 Click the client in the Existing Clients list and click < to add a single client.
Step 6 Click << to add all existing network clients.
Step 7 Click OK.
Viewing DHCP Information
The Service Properties dialog box includes two tabs that let you view information specific to the DHCP service—the Shared Nets and Leases tabs.
Viewing DHCP Shared Net Information
The Shared Nets tab of the Service Properties dialog box is unique to the DHCP service. It lets you view information about both subnets and IP address pools. To view DHCP shared net information:
Step 1 In the tree, right-click the DHCP service for which you want to view shared net information.
Step 2 From the popup menu, select Properties.
The Service Properties dialog box appears.
Step 3 Click the Shared Nets tab.
Click the Subnets button to view information about subnets.
Click the IP Pools button to view information about IP pools.
Step 4 In the Shared Networks list, select the subnet/IP you want to view.
The information displays in the Subnets For table (when the Subnets button is selected) or in the IP Pools For table (when the IP Pools button is enabled). The fields in these tables are described in Table 4-13 and Table 4-14.
Table 4-13 Subnet For Table Fields
Field
Description
SubnetAddr
Subnet IP address.
SubnetMask
Subnet mask.
LeaseDef
Default value for the number of seconds before a lease expires.
LeaseMax
Maximum value for the number of seconds before a lease expires.
SharedNetwork
Shared network identifier.
AGUID
Network AGUID.
Table 4-14 IP Pools For Table Fields
Field
Description
FromIP
Beginning IP address in the range of IP addresses.
ToIP
Ending IP address in the range of IP addresses.
SharedNetwork
Shared network identifier.
AGUID
Network AGUID.
Viewing DHCP Lease Information
The Leases tab of the Service Properties dialog box is unique to the DHCP service. It lets you view information about the DHCP service that is read from the dhcpd.conf file.
To view DHCP lease information:
Step 1 In the tree, right-click the DHCP service for which you want to view lease information.
Step 2 From the popup menu, select Properties.
The Service Properties dialog box appears.
Step 3 Click the Leases tab.
The lease data displays in table format. The fields in the table are described in Table 4-15.
Table 4-15 Service Properties—Leases Tab Fields
Field
Description
SharedNetwork
Shared network identifier.
FromIP
Starting IP address in the range of IP addresses comprising the IP pool.
ToIP
Ending IP address in the range of IP addresses comprising the IP pool.
TotalIPs
Total number of available IP addresses in the IP pool.
UsedIPs
Number of IP addresses in the pool currently being used.
FreeIPs
Number of IP addresses in the pool currently available.
Adding New Configuration Parameters
When the Service Properties—Specific tab is displayed in tree format, you can add new configuration parameters. This feature allows you to add configuration parameters without installing a new release of the UCP when the UCP software is changed.
To add a configuration parameter:
Step 1 In the tree, right-click the service to which you want to add a parameter.
Step 2 From the popup menu, select Properties.
The Service Properties dialog box appears.
Step 3 Click the Specific tab.
Step 4 If the display is not in tree format, click Tree Display to change the display to tree format.
Step 5 Click New.
Step 6 Enter a new section name and click OK.
The new section name appears in the directory tree. The section name is highlighted.
Step 7 Click New Key.
Step 8 Enter a new key name and click OK.
Step 9 Repeat Step 7 and Step 8 for each new key you want to add.
Step 10 To set the values for the new keys, highlight the key name in the tree, enter the value for the key in the Current Value field, and click OK.
Step 11 Click OK when you are done updating the configuration properties.
Monitoring a Service
Monitoring a service lets you see all events generated by the service, a description of the events, and the time each event was sent.
To monitor a service:
Step 1 In the tree, right-click the service you want to monitor.
Step 2 From the popup menu, choose Monitor.
The Service Monitor dialog box appears.
The Type column shows the type of event sent, the Description column shows a short description of the event, and the Time column shows the date and time the event was sent.
You can pause the display of information by clicking the button with the Stop icon, or erase all existing information by clicking the button with the eraser icon.
Deleting a Service
To delete a service:
Step 1 In the tree, right-click the service you want to delete.
Step 2 From the popup menu, choose Delete.
A dialog box appears, asking if you want to delete the service and its associated data.
Step 3 Click Yes.
Modifying the NCC
The NCC Application Option dialog box contains several tabs that let you modify the NCC itself.
Setting NCC Preferences
To set preferences about the NCC itself:
Step 1 From the Tools menu, select Options....
The NCC Application Option dialog box appears.
To cause the Service Properties dialog box to display automatically whenever a service is started, check the Display Service Template When Starting a New Service check box.
To give a label to the root node of the tree, enter the desired label in the Tree Root Node Caption field.
To enable use of the CiscoSecure user interface, enter the URL of the CiscoSecure user interface in the CiscoSecure Administrator URL field.
To limit the size of the NCC database, enter the desired maximum size of the database file in the Maximum NCC Database Size field.
Step 2 Click OK.
Changing NCC Window Colors
You can change the colors of the NCC windows. To do so:
Step 1 From the Tools menu, select Options....
The NCC Application Option dialog box appears.
Step 2 Click the Windows tab.
Step 3 In the Windows Name field, choose the window for which you want to change the color.
Step 4 Select whether you want to change the foreground or background color:
To change the window foreground color, click the Fore Color button.
To change the background color, click the Back Color button.
Step 5 From the color palette, click the color you want.
Step 6 Click Set Color.
Step 7 Click OK.
Configuring E-Mail Notification
You can configure the NCC to send e-mail notification to selected addresses when certain events occur. The events that you can configure to trigger an e-mail notification are:
A service dying
Exceeding the maximum utilization of a server
The database reaching the maximum size allowed
You can configure e-mail to be sent to both recipients in the "To:" and the "Cc:" fields.
To configure e-mail notification:
Step 1 From the Tools menu, select Options....
The NCC Application Option dialog box appears.
Step 2 Click the Email tab.
Step 3 Select whether you want to enable or disable notification:
To enable e-mail notification, check the Enable Email Notification check box.
To disable e-mail notification, clear the Enable Email Notification check box.
Step 4 In the Host field, enter the host name of the e-mail server.
Step 5 Select which recipient list to modify:
To modify the list of recipients who will be sent mail directly, click the To Recipients button.
To modify the list of recipients who will be sent e-mail via the "Cc:" field, click the Cc Recipients button.
Step 6 Choose who will be on your e-mail recipient list:
To add a recipient to the Recipients list, enter the e-mail address of the new recipient in the New Email Recipient ID field and click Add.
To remove a recipient from the Recipients list, click the recipient in the Recipients list and click Delete.
Step 7 Enter the return address of the e-mail in the From:field.
Step 8 Configure notification events:
To modify the list of events that will cause e-mail notification, modify the check boxes in the Notification Events list.
To cause an event to trigger e-mail notification, check the box next to the event in the list.
To prevent an event from triggering e-mail notification, clear the check box next to the event.
Step 9 Click OK.
Setting NCC Communication Preferences
The Comm tab of the NCC Application Option dialog box contains fields that let you determine the timing of communications between the PGS and other UCP components.
To configure NCC communication preferences:
Step 1 From the Tools menu, select Options....
The NCC Application Option dialog box appears.
Step 2 Click the Comm tab.
Step 3 Modify the data as necessary. The various fields are described in Table 4-16.
Step 4 Click OK.
Table 4-16 UCP Application Option—Comm Tab Field Descriptions
Field
Description
Broker Host
Name of the server on which the PGS runs.
Retrieve Events Interval
Elapsed time, in milliseconds, that the NCC listens for events.
Retrieve Events Delay
Length of time, in milliseconds, that the NCC listens for events.
Entity Check Interval Seconds
Elapsed time, in minutes, before the NCC checks the database for new entities (services, servers, and so on).
Discover Interval Minutes
Number of minutes that elapse between discover events sent by the NCC.
Service Timeout Minutes
Number of minutes of inactivity that must elapse before a service will time out and be shut down.
Auto DB Compaction
Number of hours that elapse before the NCC database is automatically compacted.
Configuring the UCP Access Database Adapter
The UCP database adapter is a separate process that works in conjunction with the NCC and performs data collection services. The AWAD Configuration dialog box lets you configure the adapter, determine the events to which the adapter subscribes, and restart the adapter. To configure the adapter:
Step 1 From the Tools menu, select AWAD Configuration.... The AWAD Configuration dialog box appears.
Step 2 Modify the data as necessary. The various fields are described in Table 4-17.
Step 3 Click OK.
Table 4-17 AWAD Configuration Dialog Box Field Descriptions
Field
Description
Path
Path to the Microsoft Access database used by the NCC.
Name (Database Group)
Name of the Microsoft Access database file used by the NCC.
Name (Adapter Group)
Adapter client name.
Log Size (Kb)
Size, in kilobytes, of the log file for the Microsoft Access database (default=10 megabytes).
Name (Broker Group)
Name of the Information Broker with which the Microsoft Access database is communicating.
Host
Name of the UNIX host that is running the Information Broker.
Client ID
Client identifier of the access adapter.
Client Group
Name of the client group to which the Information Broker belongs.
Broker Events
Name of monitoring events to which the database adapter subscribes.
Modifying the List of Events to Which the Database Adapter Subscribes
To add or delete events from the list of events to which the database adapter subscribes:
Step 1 From the Tools menu, select AWAD Configuration....
Step 2 Modify your list of events:
To add an event, click Add, and enter the name of the new event in the Broker Events list.
To delete an event, click the event in the Broker Events list and click Delete.
Step 3 Click OK.
Restarting the UCP Database Adapter
To restart the NCC database adapter:
Step 1 From the Tools menu, select AWAD Configuration....
Step 2 Click Restart Adapter.
Step 3 Click OK.
Simulating NAS Connections
The network access server (NAS) simulator is a tool that simulates making hundreds of connections per second to a service to test that service. The simulation begins by making a minimum number of connections every second, and continues making that number of connections for a specified time. It then increases the number of connections every second until the specified maximum is reached. It maintains the maximum number of connections for the specified number of seconds, then decreases the number of connections until the minimum is again reached. The cycle then repeats.
To configure a simulation:
Step 1 From the Tools menu, select Options....
The NCC Application Option dialog box appears.
Step 2 Click the NAS Simulator tab.
Step 3 Set the beginning number of logins per second with the Logins/Sec Minimum slide bar.
Step 4 Enter the number of seconds to maintain the minimum number of logins in the Seconds to Hold field.
Step 5 Enter the amount to increase the number of logins per second until the maximum is reached in the Increase Count/Sec field.
Step 6 Set the maximum number of logins per second with the Logins/Sec Maximum slide bar.
Step 7 Enter the number of seconds to maintain the maximum number of logins in the Seconds to Holdfield.
Step 8 Enter the amount to decrease the number of logins per second until the minimum is again reached in the Decrease Count/Sec field.
Step 9 Click Start Simulation.
Managing the NCC Database
The NCC maintains several database tables containing all of the information needed for the UCP configuration. Over time, these tables can become quite large. The Database tab of the NCC Application Option dialog box contains several controls that let you manage the size of the various tables.
Viewing NCC Table Information
Step 1 From the Tools menu, select Options....
The NCC Application Option dialog box appears.
Step 2 Click the Database tab.
Step 3 In the NCC Tables list, click the table for which you want to view information.
The fields in the Table Info group display the table name and number, the time and date the table definition was last modified, and whether or not the table can be updated.
Deleting NCC Database Records
Step 1 From the Tools menu, select Options....
The NCC Application Option dialog box appears.
Step 2 Click the Database tab.
Step 3 In the NCC Tables list, click the table in which you want to delete records.
Step 4 To delete all records in the database, click the All Records button. To delete only records older than a certain date, click the Records Older Than Date button and enter the most recent date of records you want to delete in the Date field.
Step 5 Click Delete Records.
Compacting the NCC Database
Step 1 From the Tools menu, select Options.... The NCC Application Option dialog box appears.
Step 2 Click the Database tab.
Step 3 In the NCC Tables list, click the table you want to compact.
Step 4 Click Compact Database.
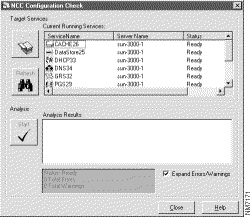
Analyzing NCC Configuration
The NCC Configuration Check dialog box lets you check the configuration of currently running UCP services. It displays errors and warnings of service configuration values that it finds to be potentially improperly configured. It also lets you refresh or view the properties of a currently running service. To start a configuration analysis:
Step 1 From the Tools menu, select Configuration Analysis. The NCC Configuration Check dialog box appears.
Step 2 To include the text of each warning or error message, check the Expand Errors/Warnings check box. To list only the number of errors and warnings that occurred for the service, clear the Expand Errors/Warnings check box.
Step 3 Click Start.
The NCC displays a list of analysis results. The results list any errors or warnings that have occurred on any of the currently installed services.
Step 4 To display the properties dialog box from the UCP Configuration Check dialog box, click on the service for which you want to view the properties in the Current Running Services list and click Open.
Step 5 To refresh a currently running service, click on the service in the Current Running Serviceslist and click Refresh.
Managing Service Administration Information
The NCC maintains a database of contact information for administrators. You can use this database as a reference if you need to contact an administrator.
Adding an Administrator to the Service Administrator Database
To add an administrator to the Service Administrator database:
Step 1 From the Tools menu, select Service Administration. The User Administration dialog box appears.
Step 2 Click Add.
Step 3 Enter the name of the new administrator in the User Names List.
Step 4 Enter the rest of the administrator contact data in the appropriate fields.
Step 5 Click OK.
Deleting an Administrator from the Service Administrator Database
To delete an administrator from the Service Administrator database:
Step 1 From the Tools menu, select Service Administration. The Service Administration dialog box appears.
Step 2 In the User Names list, click the administrator you want to delete.
Step 3 Click Delete.
Step 4 Click OK.
Viewing UCP Topology
Through the NCC, you can connect to a Netsys server with your web browser and view your network topology. To view the network topology, select Topology Viewer from the Tools menu. The web browser opens and displays the Netsys topology report.
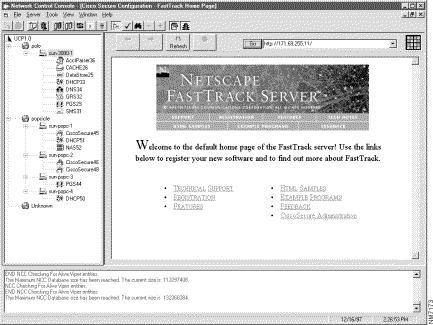
Performing CiscoSecure Administration
The NCC lets you perform CiscoSecure administration by starting a web browser and connecting to the CiscoSecure URL. To connect to the CiscoSecure URL, choose CiscoSecure Administration from the Tools menu. The web browser starts, and the CiscoSecure home page appears.
For more information about CiscoSecure administration, see the CiscoSecure documentation.