was originally developed by Tobias
Oetiker with the support of numerous people, most notably Dave Rand.
This tool uses SNMP to collect statistics from network equipment and
creates web-accessible graphs of the statistics. It is designed to be
run periodically to provide a picture of traffic over time.
is ideally suited for identifying busy-hour
traffic. All you need to do is scan the graph looking for the largest
peaks.
is most commonly used to graph traffic
through router interfaces but can be configured for other uses. For
example, since NET SNMP can be used to collect disk usage data,
could be used to retrieve and graph the
amount of free space on the disk drive over time for a system running
. Because the graphs are web-accessible,
is well suited for remote measurement.
uses SNMP's GET command to collect
information. With the current implementation, collection is done by a
Perl module supplied as part of
. No
separate installation of SNMP is needed.
, typically every five minutes. However,
can be run as a standalone program, or the
sampling interval can be changed. Configuration files, generally
created with the
utility, determine the
general appearance of the web pages and what data is collected.
generates graphs of traffic in GIF format
and HTML pages to display these graphs. Typically, these will be made
available by a web server running on the same computer as
, but the files can be viewed with a web
browser running on the same computer or the files can be moved to
another computer for viewing. This could be helpful when debugging
since the web server may considerably
complicate the installation, particularly if you are not currently
running a web server or are not comfortable with web server
configuration.
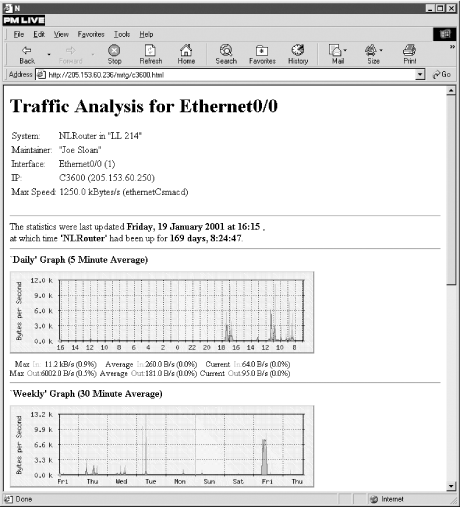
. In this example, you can see some basic
information about the router at the top of the page and, below it,
two graphs. One shows traffic for the last 24 hours and the other
shows traffic for the last two weeks, along with summary statistics
for each. The monthly and yearly graphs have scrolled off the page.
This is the output for a single interface. Input traffic is shown in
green and output traffic is shown in blue, by default, on color
displays.
generate a summary web page with a graph
for each interface. Each graph is linked to the more complete traffic
report such as the one shown in
. The
utility is used to generate this page
once the configuration file has been
created.
8.4.1.1. mrtg configuration file
To use
mrtg, you
will need a separate configuration file for each device. Each
configuration file will describe all the interfaces within the
device. Creating these files is the first step after installation.
While a sample configuration file is supplied as part of the
documentation, it is much easier to use the
cfgmaker script. An SNMP community string and
hostname or IP number must be supplied as parts to a compound
argument:
bsd2# cfgmaker public@172.16.2.1 > mrtg.cfg
Since the
script writes the configuration to standard output, you'll need
to redirect your output to a file. If you want to measure traffic at
multiple devices, then you simply need to create a different
configuration file for each. Just give each a different (but
meaningful) name.
Once you have a basic configuration file, you can further edit it as
you see fit. As described next, this can be an involved process.
Fortunately,
cfgmaker does a reasonable job. In
many cases, this will provide all you need, so further editing
won't be necessary.
Here is the first part of a fairly typical configuration file. (You
may want to compare this to the sample output shown in
Figure 8-6.)
# Add a WorkDir: /some/path line to this file
WorkDir: /usr/local/share/doc/apache/mrtg

######################################################################
# Description: Cisco Internetwork Operating System Software IOS (tm) 3600
 Software (C3620-IO3-M), Version 12.0(7)T, RELEASE SOFTWARE (fc2) Copyright (c)
1986-1999 by cisco Systems, Inc. Compiled Wed 08-Dec-99 10:08 by phanguye
#     Contact: "Joe Sloan"
# System Name: NLRouter
#    Location: "LL 214"
#.....................................................................

Target[C3600]: 1:public@172.16.2.1
MaxBytes[C3600]: 1250000
Title[C3600]: NLRouter (C3600): Ethernet0/0
PageTop[C3600]: <H1>Traffic Analysis for Ethernet0/0
 </H1>
 <TABLE>
   <TR><TD>System:</TD><TD>NLRouter in "LL 214"</TD></TR>
   <TR><TD>Maintainer:</TD><TD>"Joe Sloan"</TD></TR>
   <TR><TD>Interface:</TD><TD>Ethernet0/0 (1)</TD></TR>
   <TR><TD>IP:</TD><TD>C3600 (205.153.60.250)</TD></TR>
   <TR><TD>Max Speed:</TD>
       <TD>1250.0 kBytes/s (ethernetCsmacd)</TD></TR>
  </TABLE>

#---------------------------------------------------------------

Target[172.16.2.1.2]: 2:public@172.16.2.1
MaxBytes[172.16.2.1.2]: 1250000
Title[172.16.2.1.2]: NLRouter (No hostname defined for IP address): Ethernet0/1
PageTop[172.16.2.1.2]: <H1>Traffic Analysis for Ethernet0/1
 </H1>
 <TABLE>
   <TR><TD>System:</TD><TD>NLRouter in "LL 214"</TD></TR>
   <TR><TD>Maintainer:</TD><TD>"Joe Sloan"</TD></TR>
   <TR><TD>Interface:</TD><TD>Ethernet0/1 (2)</TD></TR>
   <TR><TD>IP:</TD><TD>No hostname defined for IP address (172.16.1.1)</TD></TR>
   <TR><TD>Max Speed:</TD>
       <TD>1250.0 kBytes/s (ethernetCsmacd)</TD></TR>
  </TABLE>

#---------------------------------------------------------------
As you can see from the example, the
general format of a directive is
Keyword[Label]:
Arguments. Directives always start
in the first column of the configuration file. Their arguments may
extend over multiple lines, provided the additional lines leave the
first column blank. In the example, the argument to the first
PageTop directive extends for 10 lines.
In this example, I've added the
second line -- specifying a directory where the working files will
be stored. This is a mandatory change. It should be set to a
directory that is accessible to the web server on the computer. It
will contain log files, home pages, and graphs for the most recent
day, week, month, and year for each interface. The interface label,
explained shortly, is the first part of a filename. Filename
extensions identify the function of each file.
Everything else, including the
files just described, is automatically generated. As you can see,
cfgmaker uses SNMP to collect some basic
information from the device, e.g.,
sysName,
sysLocation, and
sysContact, for inclusion in the configuration
file. This information has been used both in the initial comment
(lines beginning with
#) and in the HTML code
under the
PageTop directive. As you might guess,
PageTop determines what is displayed at the top
of the page in
Figure 8-6.
cfgmaker also determines the type of
interface by retrieving
ifType and its maximum
operating speed by retrieving
ifSpeed,
ethernetCsmacd and
125.0
kBytes/s in this example. The interface type is
used by the
PageTop directive. The speed is used
by both
PageTop and the
MaxBytes directive. The
MaxBytes directive determines the maximum value
that a measured variable is allowed to reach. If a larger number is
retrieved, it is ignored. This is given in bytes per second, so if
you think in bits per second, don't be misled.
cfgmaker
collects information on each interface and creates a section in the
configuration file for each. Only two interfaces are shown in this
fragment, but the omitted sections are quite similar. Each section
will begin with the
Target directive. In this
example, the first interface is identified with the directive
Target[C3600]:
1:public@172.16.2.1. The interface was identified
by the initial scan by
cfgmaker. The label was
obtained by doing name resolution on the IP address. In this case, it
came from an entry in
/etc/hosts.
[34] If name resolution fails, the IP and port numbers will be
used as a label. The argument to
Target is a
combination of the port number, SNMP community string, and IP address
of the interface. You should be aware that adding or removing an
interface in a monitored device without updating the configuration
file can lead to bogus results.
The only other directive in this example is
Title, which determines the title displayed for
the HTML page. These examples are quite adequate for a simple page,
but
mrtg provides both additional directives and
additional arguments that provide a great deal of flexibility.
By default,
mrtg collects the SNMP objects
ifInOctets and
ifOutOctets
for each interface. This can be changed with the
Target command. Here is an example of a small
test file (the recommended way to test
mrtg)
that is used to collect the number of unicast and nonunicast packets
at an interface.
bsd2# cat test.cfg
WorkDir: /usr/local/share/doc/apache/mrtg

Target[Testing]: ifInUcastPkts.1&ifInNUcastPkts.1:public@172.16.2.1
MaxBytes[Testing]: 1250000
Title[Testing]: NLRouter: Ethernet0/0
PageTop[Testing]: <H1>Traffic Analysis for Ethernet0/0
 </H1>
 <TABLE>
   <TR><TD>System:</TD><TD>NLRouter in "LL 214"</TD></TR>
   <TR><TD>Maintainer:</TD><TD>"Joe Sloan"</TD></TR>
   <TR><TD>Interface:</TD><TD>Ethernet0/0 (1)</TD></TR>
   <TR><TD>IP:</TD><TD>C3600 (205.153.60.250)</TD></TR>
   <TR><TD>Max Speed:</TD>
       <TD>1250.0 kBytes/s (ethernetCsmacd)</TD></TR>
  </TABLE>
mrtg knows a limited number of OIDs. These are
described in the
mibhelp.txt file that comes
with
mrtg. Fortunately, you can use dotted
notation as well, so you aren't limited to objects with known
identifiers. Nor do you have to worry about MIBs. You can also use an
expression in the place of an identifier, e.g., the sum of two OIDs,
or you can specify an external program if you wish to collect data
not available through SNMP. There are a number of additional formats
and options available with
Target.
Other keywords are available that
will allow you to customize
mrtg's
behavior. For example, you can use the
Interval
directive to change the reported frequency of sampling. You'll
also need to change your
crontab file to match.
If you don't want to use
cron, you can use
the
RunAsDaemon directive, in conjunction with
the
Interval directive to set
mrtg up to run as a standalone program.
Interval takes an argument in minutes; for
example,
Interval: 10 would
sample every 10 minutes. To enable
mrtg to run
as a stand-alone program, the syntax is
RunAsDaemon:
yes.
Several directives are useful
for controlling the appearance of your graphs. If you don't
want all four graphs, you can suppress the display of selected graphs
with the
Suppress directive. For example,
Suppress[Testing]:
my will suppress the monthly and yearly
graphs. Use
d and
w for
daily and weekly graphs. You may use whatever combination you want.
One
annoyance with
mrtg is that it scales each graph
to the largest value that has to be plotted.
mrtg shouldn't be faulted for this; it is
simply using what information it has. But the result can be graphs
with some very unusual vertical scales and sets of graphs that you
can't easily compare. This is something you'll definitely
want to adjust.
You can work around this problem with several of the directives
mrtg provides, but the approach you choose will
depend, at least in part, on the behavior of the data you are
collecting. The
Unscaled directive suppresses
automatic scaling of data. It uses the value from
MaxBytes as maximum on the vertical scale. You
can edit
MaxBytes if you are willing to have
data go off the top of the graph. If you change this, you should use
AbsMax to set the largest value that you expect
to see.
Other commands allow you to change the
color, size, shape, and background of your graphs. You can also
change the directions that graphs grow. Here is an example that
changes the display of data to bits per second, has the display grow
from left to right, displays only the daily and weekly graphs, and
sets the vertical scale to 4000 bits per second:
Options[Testing]: growright,bits
Suppress[Testing]: my
MaxBytes[Testing]: 500
AbsMax[Testing]: 1250000
Unscaled[Testing]: dw
Notice that you still need to give
MaxBytes and
AbsMax in bytes.
Many more keywords are available. Only the most common have been
described here, but these should be more than enough to meet your
initial needs. See the mrtg sample configuration file and
documentation for others.
Once you have the configuration file, use
indexmaker to create a main page for all the
interfaces on a device. In its simplest form, you merely give the
configuration file and the destination file:
bsd2# indexmaker mrtg.cfg > /usr/local/www/data/mrtg/index.html
You may specify a router name and a regular expression that will
match a subset of the interfaces if you want to limit what you are
looking at. For example, if you have a switch with a large number of
ports, you may want to monitor only the uplink ports.
You'll probably want to run
mrtg manually
a couple of times. Here is an example using the configuration file
test.cfg:
bsd2# mrtg test.cfg
Rateup WARNING: .//rateup could not read the primary log file for testing
Rateup WARNING: .//rateup The backup log file for testing was invalid as well
Rateup WARNING: .//rateup Can't remove testing.old updating log file
Rateup WARNING: .//rateup Can't rename testing.log to testing.old updating log f
ile
The first couple of runs will generate warning messages about missing
log files and the like. These should go away after a couple of runs
and can be safely ignored
.
Finally,
you'll want to make an appropriate entry in your
contab file. For example, this entry will run
mrtg every five minutes on a FreeBSD system:
0,5,10,15,20,25,30,35,40,45,50,55 * * * * /usr/ports/net/mrtg/work/mrtg-2.8.12/r
un/mrtg /usr/ports/net/mrtg/work/mrtg-2.8.12/run/mrtg.cfg > /dev/null 2>&1
This should be all on a single line. The syntax is different on some
systems, such as Linux, so be sure to check your local manpages.


