|
|

Table Of Contents
Cisco Release 12.1(8b)E12 Safe Harbor Testing for Financial Enterprise Customers
Unidirectional Link Detection-Aggressive Mode
Port Aggregation Protocol (Channeling)
Enhanced Interior Gateway Routing Protocol
Simple Network Management Protocol
User Datagram Protocol Broadcast Flooding
Cisco Release 12.1(8b)E12 Safe Harbor Testing for Financial Enterprise Customers
Version History
Executive Summary
Cisco IOS Safe Harbor is an initiative that provides the global financial services enterprise customer with a stable Cisco IOS 12.1 E version-of-choice. Safe Harbor focuses on satisfying customer quality requirements in key vertical markets. This program links and expands upon several Cisco testing projects, including development, regression testing, and systems testing critical to the success of the financial services business. Safe Harbor is the successful completion of extensive validated testing for each release targeting the financial enterprise market.
The Cisco nEverest program will integrate testing for many diverse vertical markets and will leverage Safe Harbor testing to ensure a "holistic" approach to the general improvement of Cisco IOS software.
This document describes the testing environment, test plans, and results.
This document contains the following sections:
•
Hardware Forwarding Features
About Cisco IOS Safe Harbor
The goal of Cisco IOS Safe Harbor is to provide improved network stability, reliability, and performance with respect to Cisco IOS software. Safe Harbor involves testing the feature sets and protocols in a particular Cisco IOS Release 12.1 E image on the Catalyst 6500 platform to provide high quality code for the financial services business. This combination of features, hardware, and image is tested in a laboratory environment that simulates the financial services business network environment using regularly updated topologies and configurations provided by the financial customer. For information on the hardware tested and the network setup of the test environment, see the "Financial Lab Topology" section.
The groups of feature sets that are tested include the following: hardware redundancy, Layer 2 features, hardware forwarding features, Layer 3 routing features, network management features, and several miscellaneous features. Regression tests are conducted to validate existing features and ensure that functionality is maintained. Negative tests are designed and conducted to stress the features and their interoperability. For information on each feature and its testing, see the "Feature Sets Testing" section.
During the testing, the network is placed under loads that are consistent with those in a financial services network. A standard suite of tools (for example, Netcom Smartbits, IXIA packet generator, or Cisco Pagent) is used to generate network traffic. Network testing includes a combination of automated and manual tests. Simple Network Management Protocol (SNMP) is used to poll the network during the tests, and all tests are analyzed. For a summary of the test results, see the "Test Results Summary" section.
Note
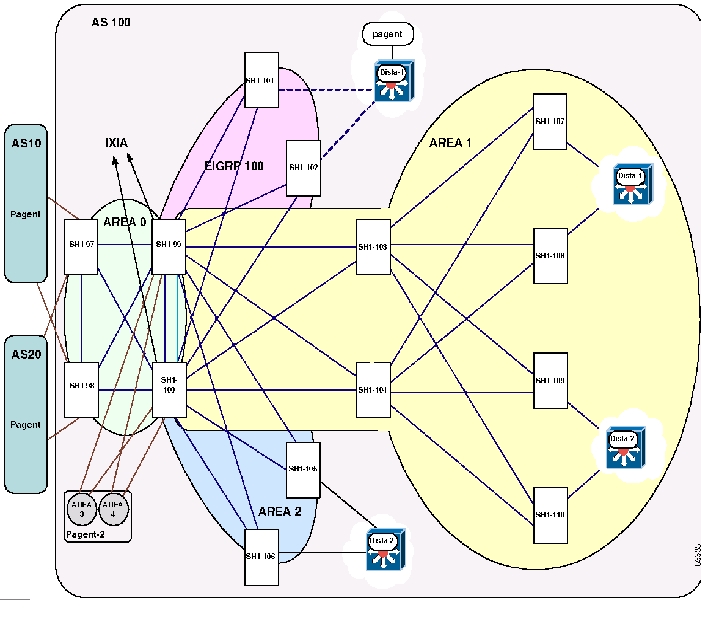
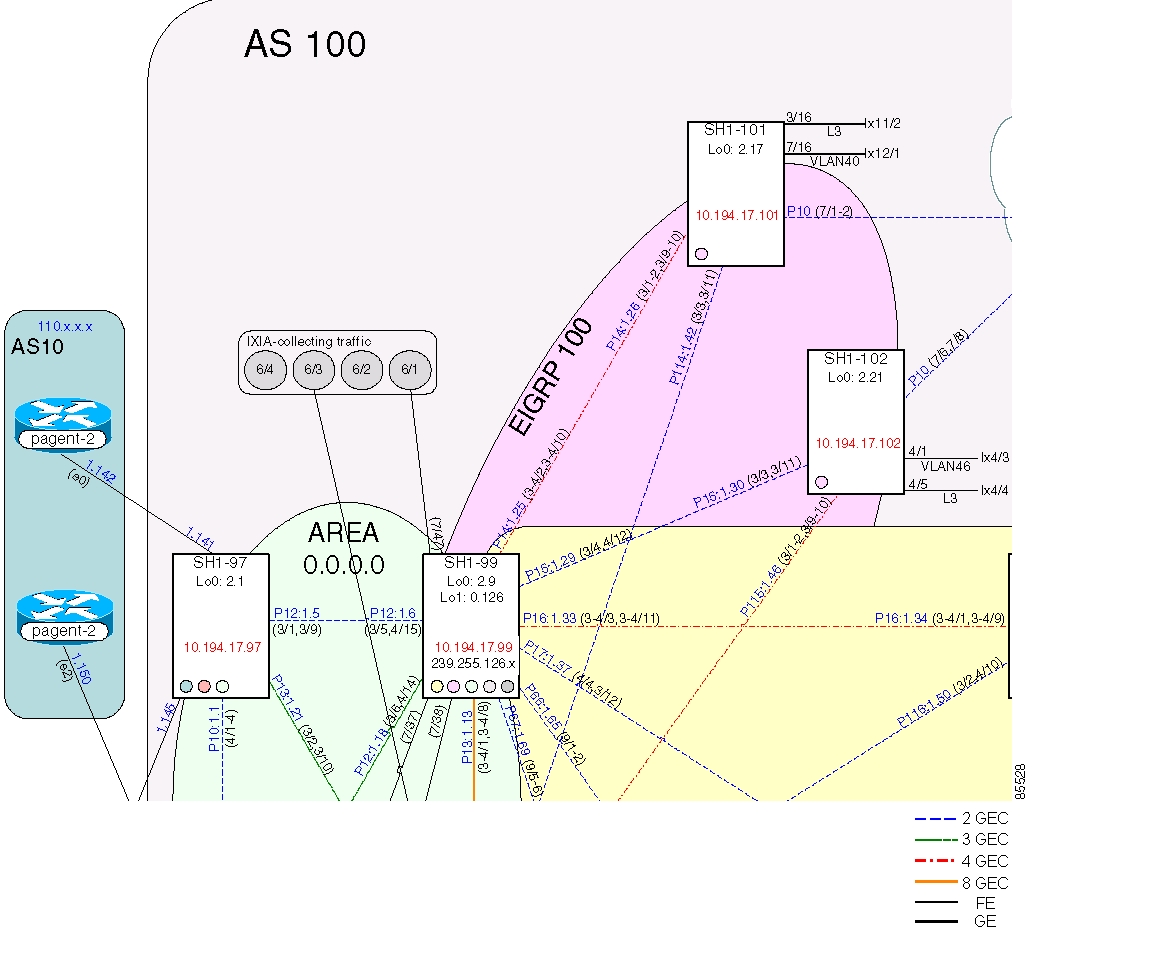
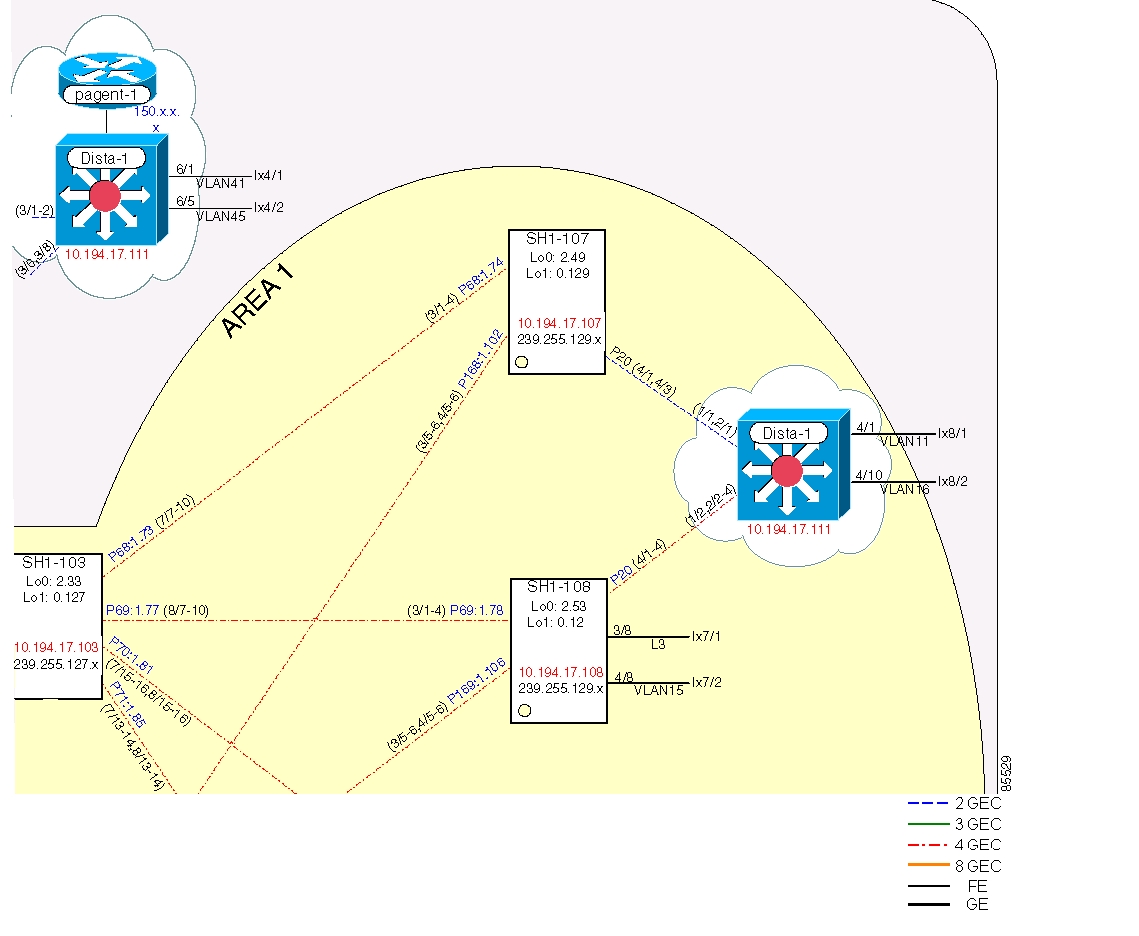
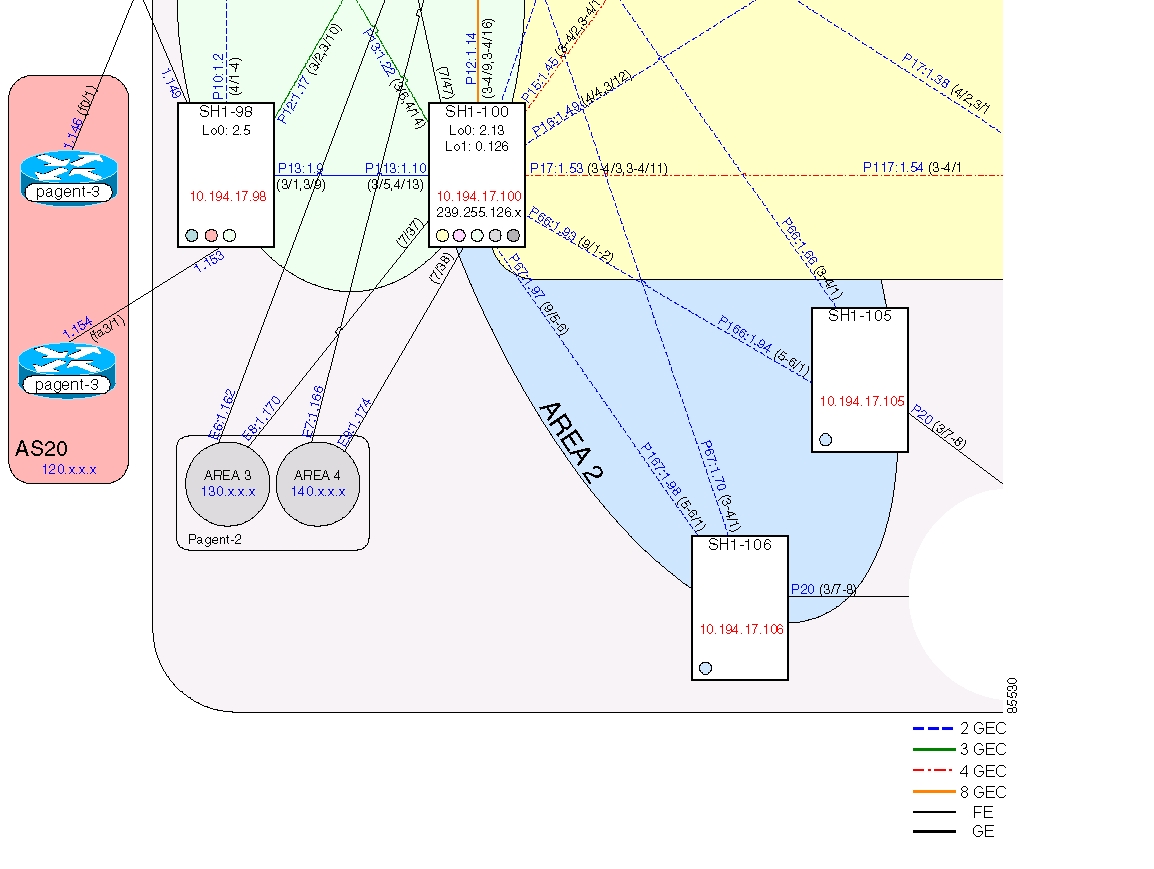
Financial Lab Topology
Figure 1 through Figure 5 show the base Native IOS financial lab topology. The financial services network environment configured in the lab includes the following hardware:
•
•
•
•
The hardware configuration in the financial test lab includes a combination of distributed fabric, fabric-capable, and nonfabric modules.
Note
Basic Topology: Port Channel Deployment
Figure 1 through Figure 5 show the port channel deployment for the Safe Harbor testing. Catalyst 6500 series switches running Native Cisco IOS support both Layer 2 (L2) and Layer 3 (L3) EtherChannels, with up to eight ports aggregated in a single Etherchannel interface. All interfaces in each EtherChannel must be identically configured (the same speed, all Layer 2 or Layer 3, and so on).
EtherChannel load balancing can use either MAC addresses or IP addresses, and either source or destination or both source and destination addresses. The selected mode applies to all EtherChannels configured on the switch.
EtherChannel is a trunking technology that groups together multiple full-duplex 802.3 Ethernet interfaces to provide fault-tolerant high-speed links between switches, routers, and servers. An EtherChannel interface (consisting of up to eight Ethernet interfaces) is treated as a single interface; this is called a port channel.
The port channels configured for Safe Harbor testing are Gigabit EtherChannels (GECs). The following types of GEC port channels are configured and tested for Safe Harbor:
•
•
•
•
Basic Topology: Routing Protocols
The following routing protocols are configured for Safe Harbor testing:
•
–
–
•
•
Figure 1 through Figure 5 shows the following:
•
•
•
•
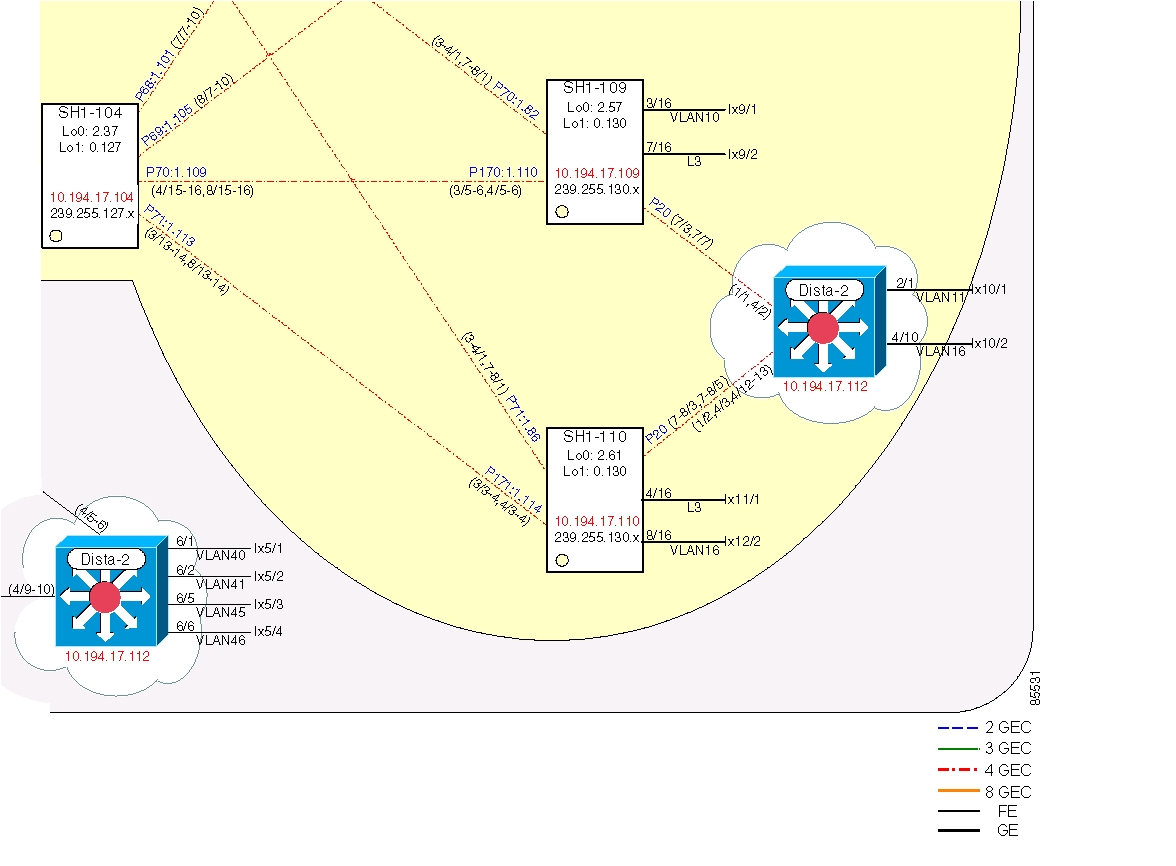
Figure 1 Routing Topology
Figure 2 Quadrant 1 Detailed Interconnections Information
Figure 3 Quadrant 2 Detailed Interconnections Information
Figure 4 Quadrant 3 Detailed Interconnections Information
Figure 5 Quadrant 4 Detailed Interconnections Information
Test Results Summary
Table 1 summarizes the results of all completed testing as part of the Cisco IOS Safe Harbor initiative. Table 1 includes the following information: The feature or function tested, the section that describes the feature set to which the feature or function belongs, the results of the feature or function tests (pass or fail), the component tests for each feature/function, and any DDTS found during the Safe Harbor testing.
Note
For a compete list of IOS commands and usage in this document, refer to http://www.cisco.com/univercd/cc/td/doc/product/software/ios121/index.htm.
Feature Sets Testing
Functionality critical to the global financial service business tested for the Cisco IOS Safe Harbor release is described in the following sections:
•
Hardware Redundancy
Whenever a fault is encountered, the redundant module takes over the functions of the failed hardware module. Testing hardware redundancy for Safe Harbor involves performing various failover scenarios to verify that internal hardware redundancy fails over as expected. The tests described in the following sections were performed:
Fabric Flap
This test reset the active SFM in the system repeatedly to verify that SFM failover operates as designed. The device under test (DUT) was SH1-103. With an IXIA traffic stream passing through it, the DUT SFM was failed 20 times. Test results included measures of the period during which no traffic was passed and the time required for the failed SFM to come back online to the "standby" state.
Test Plan
The procedure used to perform the hardware redundancy fabric flap test follows:
Step 1
Step 2
Step 3
Commands
•
Step 4
Commands
•
•
Step 5
Commands
•
•
Step 6
Step 7
Step 8
Step 9
Step 10
Expected Results
We expect that SFM failover operates as designed after repeatedly resetting the active SFM in the system.
Results
Table 3 shows the fabric flap test results.
Supervisor Failover
This test verified the proper operation of redundant supervisors during a series of twenty continual resets. The goal of this test was to verify that the box failed between the supervisors as designed, recovered, and forwarded traffic. This test was further designed to verify that failure operations were within the design guidelines for the applicable hardware and software versions under test. Although this test measured time, it by no means measures the speed at which failover can take place (which is dependent upon the configuration and line cards in the system).
Because both supervisor engines 1 and 2 are covered in this test, two devices were used during this procedure. These devices were SH1-107 (Sup1) and SH1-109 (Sup2). A traffic stream was sent from Dista-1 to Dista-2 at a fixed rate. Configurations were altered so that this traffic stream can go only through SH1-108 or SH1-110, depending on the test being run. The amount of traffic loss during device resets was used to determine the recovery time (failover time).
Test Plan
The procedure used to perform the supervisor failover test follows.
Step 1
Commands
•
•
•
•
Step 2
Step 3
Step 4
Step 5
Step 6
Table 4 Supervisor1 (SH1-108) Summarized Results
Failover time
138.3
139.0
139.8
Step 1
Commands
•
•
•
•
Step 2
Step 3
Step 4
Step 5
Step 6
Table 5 Supervisor2 (SH1-110) Summarized Results
Failover time
87.1
94.8
108.9
Expected Results
We expect that failure operations are within the design guidelines for the given hardware and software versions under test with no configuration or functionality loss.
Results
Table 6 shows the supervisor failover test results.
Layer 2 Features
Layer 2 feature testing for Safe Harbor involves the features:
•
•
•
Spanning Tree Protocol
The spanning-tree algorithm provides path redundancy by defining a tree that spans all of the switches in an extended network and then forces certain redundant data paths into a standby (blocked) state. At regular intervals, the switches in the network send and receive spanning-tree packets that they use to identify the path. If one network segment becomes unreachable, or if spanning-tree costs change, the spanning-tree algorithm reconfigures the spanning-tree topology and reestablishes the link by activating the standby path. Because this feature has limited use in the financial customer networks, it received limited coverage in testing here.
The following test was performed:
•
Basic Spanning Tree Protocol Configuration
This test tested the basic functionality of the Spanning Tree Protocol (STP), including verifying that the various STP states occurred within the defined times; that STP properly converged, with all switches pointing to the correct device as root; and that the CPU did not reach unreasonable levels. The DUTs are SH1-109, SH1-110, and Dista-2.
Note
Test Plan
The procedure used to perform the basic Spanning Tree Protocol configuration test follows.
Step 1
Step 2
Commands
•
•
Step 3
Commands
•
Step 4
Step 5
Commands
•
Step 6
Step 7
Commands
•
Step 8
Expected Results
We expect spanning-tree recalculation occurs in an anticipated time frame. This value depends on the parameters of the spanning-tree domain.
Results
Table 7 shows the basic Spanning Tree Protocol configuration test results.
Unidirectional Link Detection-Aggressive Mode
The Unidirectional Link Detection-Aggressive Mode (UDLD-AM) protocol allows devices connected through fiber-optic or copper Ethernet cables (for example, Category 5 cabling) to monitor the physical configuration of the cables and detect when a unidirectional link exists. When a unidirectional link is detected, UDLD shuts down the affected port and alerts the user. Unidirectional links can cause a variety of problems, including spanning-tree topology loops and erroneous Layer 3 routing.
Note
Note
The following tests were performed:
•
•
Basic UDLD Test on Layer 2 Link
This test created a unidirectional link between SH1-109 (the device under test [DUT]) and Dista-2. Console messages were logged during the mock failure, and port states were recorded.
Test Plan
The procedure used to perform the basic UDLD test on Layer 2 link test follows.
Step 1
Step 2
Commands
•
•
•
Step 3
Note
Commands
•
•
Step 4
Commands
•
•
Step 5
Step 6
Commands
•
•
Step 7
Commands
•
•
•
Step 8
Commands
•
•
Step 9
Commands
•
Step 10
Expected Results
We expect that UDLD-AM will detect a unidirectional Layer 2 link, shut down the affected port, and alert the user. We also expect that the link is reestablished when physical connectivity is restored and UDLD-disabled ports are reset.
Results
Table 8 shows the basic UDLD test on Layer 2 link test results.
Basic UDLD Test on Layer 3 Link
This test involved the emulation of a unidirectional link on a Layer 3 interface. Console messages and interface states were logged throughout the process. The DUTs are SH1-104 and SH1-109.
Test Plan
The procedure used to perform the basic UDLD test on Layer 3 link test follows.
Step 1
Step 2
Commands
•
•
•
Step 3
Note
Commands
•
•
Step 4
Commands
•
•
Step 5
Step 6
Commands
•
•
Step 7
Commands
•
•
Step 8
Commands
•
•
Step 9
Commands
•
Step 10
Expected Results
We expect that UDLD-AM will detect a unidirectional Layer 3 link, shut down the affected port, and alert the user. We also expect that the link is reestablished when physical connectivity is restored and UDLD-disabled ports are reset.
Results
Table 9 shows the basic UDLD test on Layer 3 link test results.
Trunking
A trunk is a point-to-point link between one or more switch ports and another networking device such as a router or a switch. Trunks carry the traffic of multiple VLANs over a single link and allow VLANs to be extended across an entire network. Table 10 lists and describes the five modes of trunking on Cisco switches.
The following trunking tests were performed:
Basic Trunk Configuration
This test verified the basic functionality of the various trunking configurations. A static trunking configuration was tested between devices SH1-107 and Dista-1. A dynamic trunking configuration also was tested between devices SH1-108 and Dista-1.
Test Plan
The procedure used to perform the basic trunk configuration test follows.
Step 1
Commands
•
•
•
Step 2
Commands
•
•
•
Expected Results
We expect basic trunking functionality to work properly and perform correctly in failure and recovery scenarios.
Results
Table 11 shows the basic trunk configuration test results.
Failure and Recovery
This test verified failure and recovery of both statically and dynamically configured trunks. The static trunk links were between SH1-107 and Dista-1. The dynamic trunk links were between SH1-108 and Dista-1. These links were failed and then recovered, to verify that trunking was reestablished.
Test Plan
The procedure used to perform the failure and recovery test follows.
Step 1
Step 2
Commands
•
•
Step 3
Commands
•
•
Step 4
Commands
•
•
•
Step 5
Commands
•
•
•
Step 6
Commands
•
•
•
Step 7
Commands
•
•
•
Step 8
Expected Results
We expect basic trunking functionality to work properly and perform correctly in failure and recovery scenarios.
Results
Table 12 shows the failure and recovery test results.
Port Aggregation Protocol (Channeling)
The port aggregation protocol (PAgP) facilitates the automatic creation of EtherChannels by exchanging packets between Ethernet ports. PAgP packets are exchanged only between ports in auto and desirable modes. Ports configured in on or off mode do not exchange PAgP packets. The protocol learns the capabilities of port groups dynamically and informs the other ports. Once PAgP identifies correctly matched EtherChannel links, it groups the ports into an EtherChannel. The EtherChannel is then added to the spanning tree as a single bridge port.
EtherChannel includes four user-configurable modes: on, off, auto, and desirable. Only auto and desirable are PAgP modes. The auto and desirable modes can be modified with the silent and non-silent keywords. By default, ports are in auto silent mode.
An EtherChannel distributes frames across the links in a channel by reducing part of the binary pattern formed from the addresses in the frame to a numerical value that selects one of the links in the channel.
EtherChannel frame distribution is based on a Cisco-proprietary hashing algorithm. The algorithm is deterministic; given the same addresses and session information, you always hash to the same port in the channel, preventing out-of-order packet delivery.
The following tests were performed:
•
•
•
•
Basic Layer 2 Channeling Configuration
This test verified the basic aspects of Layer 2 PAgP configuration to verify that the basic functionality worked correctly. For this test, a set of links between SH1-109 and Dista-1 was given a configuration for static channeling. Dynamic channeling was tested in the bundling of links between SH1-110 and Dista-2.
Test Plan
The procedure used to perform the Basic Layer 2 Channeling Configuration test follows.
Step 1
Note
Commands
•
Step 2
Commands
•
Step 3
Commands
•
•
•
Expected Results
We expect that EtherChannels are created and frames exchange across Layer 2 links properly.
Results
Table 13 shows the basic Layer 2 channeling test results.
Basic Layer 3 Channeling Configuration
This test verified that Layer 3 port-channel functionality was tested. This test verified static and dynamic channel configurations for each of the following combinations: dCEF::dCEF channels, non-dCEF::non-dCEF channels, and mixed::mixed (involving both non-dCEF and dCEF modules). Table 14 maps each of the six steps to the combination covered.
Table 14 Basic Layer 3 Channeling Configuration Matrix
1
Yes
Static
2
Yes
Dynamic
3
Mixed
Static
4
Mixed
Dynamic
5
No
Static
6
No
Dynamic
Test Plan
The procedure used to perform the basic Layer 3 channeling configuration test follows.
Step 1
Commands
•
•
•
•
Step 2
Commands
•
•
•
•
Step 3
Commands
•
•
•
•
Step 4
Commands
•
•
•
•
Step 5
Commands
•
•
•
•
Step 6
Commands
•
•
•
•
Expected Results
We expect that EtherChannels are created and frames exchange across Layer 3 links properly.
Results
Table 15 shows the basic Layer 3 channeling test results.
Layer 2 and Layer 3 EtherChannel Load Balance
This test verified that load distribution took place across the individual interfaces in an EtherChannel. An IXIA traffic stream was generated, sending traffic from 20 emulated sources to a single destination. This traffic was sent from one side of the SH1 network to the other, passing through several GECs along the way. Along each hop in the path to the destination, load distribution was verified by examining the traffic statistics on individual interfaces. All traffic sent from the multiple sources was received on the other end of the network, though balanced across many interfaces. Traffic was forwarded from sources to destination via hardware shortcuts.
Traffic (10 million packets) was sent at a rate of 25,000 pps from Dista-1 to Dista-2. Devices SH1-107 and SH1-108 used supervisor 1 engines, and devices SH1-109 and SH1-110 used supervisor 2 engines. Because traffic was forwarded through all devices (except SH1-107), coverage of both Sup1 and the Sup2 was implied. Both Layer 2 and Layer 3 EtherChannels were tested. The Layer 2 channels in this network were those between SH1-107, SH1-108, and Dista-1, and between SH1-109, SH1-110, and Dista-2.
Test Plan
The procedure used to perform the Layer 2 and Layer 3 EtherChannel load balance test follows.
Step 1
Step 2
Commands
•
Step 3
Step 4
Commands
•
•
Note
Step 5
Commands
•
Note
Step 6
Note
Step 7
Expected Results
We expect load distribution to take place across the individual interfaces in the EtherChannel.
Results
Table 16 shows the Layer 2 and Layer 3 EtherChannel load balance test results.
Gigabit Ethernet Module Reset
This test verified the ability of Layer 2 and Layer 3 EtherChannels to handle module resets and failures. The supervisor 1 and supervisor 2 were both tested. With IXIA traffic (configured for 20 source IP addresses and one destination IP address) sent from Dista-1 to Dista-2, two modules were reset, individually, on device SH1-108 (Sup1). One of the modules was involved in a Layer 2 GEC and the other in a Layer 3 GEC. For Sup2 coverage, a single module was reset on SH1-110. This module has interfaces involved in both Layer 2 and Layer 3 GECs.
Test Plan
The procedure used to perform the Gigabit Ethernet Module Reset test follows.
Step 1
Step 2
Commands
•
Step 3
Commands
•
•
•
Step 4
Commands
•
•
•
Step 5
Commands
•
•
•
Step 6
Expected Results
We expect the GEC and GEC ports to work properly if the Gigabit Ethernet module gets reset.
Results
Table 17 shows the Gigabit Ethernet module reset test results.
VLAN Trunking Protocol
VLAN Trunking Protocol (VTP) is a Layer 2 messaging protocol that maintains VLAN configuration consistency by managing the addition, deletion, and renaming of VLANs on a network-wide basis. VTP minimizes misconfigurations and configuration inconsistencies that can result in a number of problems, such as duplicate VLAN names, incorrect VLAN-type specifications, and security violations.
You can use VTP to manage VLANs 1 to 1005 in your network. (Note that VTP does not support VLANs 1025 to 4094.) With VTP, you can make configuration changes centrally on one switch and have those changes automatically communicated to all the other switches in the network.
The following test was performed:
•
Basic VLAN Trunking Protocol Configuration
This test configured VLANs and verified normal behavior in various combinations of VTP client, server, and transparent modes between devices SH1-107 and Dista-1.
Test Plan
The procedure used to perform the basic VLAN trunking protocol configuration test follows.
Step 1
Step 2
Commands
•
•
Step 3
Commands
•
•
Step 4
Step 5
Step 6
Step 7
Step 8
Step 9
Step 10
Step 11
Step 12
Step 13
Step 14
Expected Results
We expect that VLAN configuration consistency through management of the addition, deletion, and renaming of VLANs on a network-wide basis will be maintained.
Results
Table 18 shows the basic VLAN trunking protocol configuration test results.
Hardware Forwarding Features
Hardware forwarding testing for Safe Harbor involves these features:
IP Unicast
The Internet Protocol (IP) is a packet-based protocol used to exchange data over computer networks. IP handles addressing, fragmentation, reassembly, and protocol demultiplexing. It is the foundation on which all other IP protocols (collectively referred to as the IP Protocol suite) are built. A network-layer protocol, IP contains addressing and control information that allows data packets to be routed.
The Transmission Control Protocol (TCP) is built upon the IP layer. TCP is a connection-oriented protocol that specifies the format of data and acknowledgments used in the transfer of data. TCP also specifies the procedures that the networking devices use to verify that the data arrives correctly. TCP allows multiple applications on a system to communicate concurrently because it handles all demultiplexing of the incoming traffic among the application programs.
The following tests were performed:
•
•
Layer 2 Gigabit EtherChannel Failover
This test sent traffic over a Layer 2 GEC, and the links in that GEC were failed one at a time until the traffic was forced to find a different path to the destination. There were two separate test procedures, one for supervisor 1 coverage, and another for supervisor 2 coverage. The device under test (DUT) for the first test was SH1-108, which had a Layer 2 GEC connecting it with Dista-1. The DUT for the second test was SH1-110, which had a Layer 2 GEC connecting it with Dista-2.
Test Plan
The procedure used to perform the IP unicast Layer 2 Gigabit EtherChannel failover test follows.
Step 1
Step 2
Commands
•
•
Step 3
Commands
•
Step 4
Step 5
Step 6
Step 7
Step 8
Commands
•
•
Step 9
Commands
•
Step 10
Step 11
Step 12
Step 13
Step 14
Expected Results
We expect that traffic interruption will be acceptable when an L2 GEC is failed and that the traffic will resume on its original path when the L2 GEC is brought back up.
Results
Table 19 shows the Layer 2 Gigabit EtherChannel failover test results.
Layer 3 Gigabit EtherChannel Failover
This test verified the ability of a system to cope with a Layer 3 GEC failure, with a minimum amount of traffic loss. IXIA traffic was directed through the Layer 3 GEC, and the Layer 3 GEC was forced to fail, first a single interface, and then the entire channel. Because the GEC between SH1-108 and SH1-103 was tested, supervisor 1 (SH1-108) and the supervisor 2 (SH1-103) were included in the same test.
Test Plan
The procedure used to perform the IP Unicast Layer 3 Gigabit EtherChannel Failover test follows.
Step 1
Step 2
Commands
•
•
Step 3
Commands
•
Step 4
Commands
•
Step 5
Commands
•
Step 6
Step 7
Step 8
Commands
•
Step 9
Commands
•
Step 10
Commands
•
Step 11
Expected Results
We expect that traffic interruption will be acceptable when an L2 GEC is failed and that the traffic will resume on its original path when the L2 GEC is brought back up.
Results
Table 20 shows the Layer 3 Gigabit EtherChannel failover test results.
IP Multicast
Traditional IP communication allows a host to send packets to a single host (unicast transmission) or to all hosts (broadcast transmission). IP multicast provides a third scheme, allowing a host to send packets to a subset of all hosts (group transmission). These hosts are known as group members.
Packets delivered to group members are identified by a single multicast group address. Multicast packets are delivered to a group using best-effort reliability, just like IP unicast packets.
The multicast environment consists of senders and receivers. Any host, regardless of whether it is a member of a group, can send to a group. However, only the members of a group receive the message.
A multicast address is chosen for the receivers in a multicast group. Senders use that address as the destination address of a datagram to reach all members of the group.
Membership in a multicast group is dynamic; hosts can join and leave at any time. There is no restriction on the location or number of members in a multicast group. A host can be a member of more than one multicast group at a time.
Note
The following tests were performed:
•
•
•
•
•
•
•
•
•
•
•
•
•
•
Basic Multicast and Multicast Source Discovery Protocol
This test verified multicast and Multicast Source Discovery Protocols (MSDP) basic functionality, including the creation of hardware shortcuts for multicast entries. In this test, IXIA was used to send traffic streams to five multicast groups, 239.255.127.100 through 239.255.127.104. The traffic entered the network at an interface on SH1-108, and exits the network at three points, one on SH1-108 and two on Dista-1. One million packets were sent at a rate of 10,000 pps. IP PIM was configured for sparse-mode and the ip pim spt-threshold infinity command was set.
Test Plan
The procedure used to perform the basic multicast and Multicast Source Discovery Protocol test follows.
Step 1
Step 2
Step 3
Step 4
Commands
•
Step 5
Commands
•
Step 6
Step 7
Step 8
Expected Results
We expect multicast and MSDP basic functionality, including the creation of hardware shortcuts for multicast entries, to work properly.
Results
Table 21 shows the basic multicast and MSDP test results.
Basic IGMP and CGMP Functionality
Internet Group Management Protocol (IGMP) software components run on both the Cisco router and the switch. An IGMP-capable IP multicast router sees all IGMP packets and can inform the switch when specific hosts join or leave IP multicast groups.
When the IGMP-capable router receives an IGMP control packet, it creates an IGMP packet that contains the request type (either join or leave), the multicast group address, and the MAC address of the host. The router sends the packet to a well-known address to which all switches listen. When a switch receives the packet, the supervisor engine interprets the packet and modifies the forwarding table automatically. Cisco Group Management Protocol (CGMP) should seamlessly integrate with IGMP and performs the same function.
This test verified IGMP and CGMP basic functionality, including the IGMP and CGMP status, and verified that no multicast traffic was flooded into ports that do not have a multicast client. IGMP joins were sourced by IXIA-8/2 and sent to Dista-1 4/6 (VLAN 16) for multicast groups 239.255.127.100 through 239.255.127.104. Traffic for these groups was sourced by IXIA 8/1 and sent to Dista-1 4/1 (VLAN 11). The traffic was 1.5 million packets sent at a rate of 10,000 pps. Success of the test was measured by 100 percent of traffic being received by the single receiver interface, no traffic going to unintended interfaces, and no sustained or abnormal impact to the memory of CPU utilization.
Test Plan
The procedure used to perform the basic IGMP and CGMP functionality test follows.
Step 1
Commands
•
•
Step 2
Step 3
Step 4
Step 5
Commands
•
•
•
•
Step 6
Commands
•
•
Step 7
Commands
•
•
Step 8
Step 9
Step 10
Expected Results
We expect IGMP and CGMP basic functionality, including the IGMP and CGMP status to work properly, and that no multicast traffic is flooded into ports that do not have a multicast client.
Results
Table 22 shows the basic IGMP and CGMP functionality test results.
Core Multicast Source Discovery Protocol
This test verified the functionality of Core MSDP at the core level. SH1-103 and SH1-104 were configured as MSDP peers for multicast groups 239.255.127.100 through 239.255.127.104. Multicast data traffic for these five groups was sent from IXIA connected to Dista-2 to two receiver ports, one on Dista-1 and one on Dista-2. This test was successful if the traffic used the path through the active MSDP peer (SH1-104) to get to the receiver.
SH1-107 and SH1-108 were configured with the ip pim spt-threshold infinity command to verify that the (*, G) path was used, forcing the traffic to go through the active MSDP router. Multicast traffic was sent at a rate of 10,000 pps. All packets were received by each of the two ports. The unicast background traffic must be fully received. There were no negative impact on memory or CPU utilization, on any of the Layer 3 devices.
Test Plan
The procedure used to perform the core MSDP test follows.
Step 1
Commands
•
•
Step 2
Commands
•
Step 3
Step 4
Step 5
Step 6
Commands
•
•
Step 7
Step 8
Step 9
Expected Results
We expect functionality of core MSDP at the core level to work properly.
Results
Table 23 shows the core MSDP test results.
Non-Reverse Path Forwarding Rate Limiting and Multicast Stub
Stub multicast routing allows you to configure remote and stub routers as IGMP proxy agents. Instead of fully participating in PIM, these stub routers simply forward IGMP messages from the hosts to the upstream multicast router.
This test verified that the multicast stub command worked and that non-Reverse Path Forwarding (RPF) rate limiting functionality worked on Policy Feature Cards (PFC1 and PFC2), and dCEF, including a hardware shortcut.
PFC1, PFC2, and the DFCs support ACL-based filtering of RPF failures for sparse mode stub networks. When you enable the ACL-based method of filtering Reverse Path Forwarding failures by entering the mls ip multicast stub command on the redundant router, the following ACLs automatically download to the PFC and are applied to the interface you specify:
access-list 100 permit ip A.B.C.0 0.0.0.255 anyaccess-list 100 permit ip A.B.D.0 0.0.0.255 anyaccess-list 100 permit ip any 224.0.0.0 0.0.0.255access-list 100 permit ip any 224.0.1.0 0.0.0.255access-list 100 deny ip any 224.0.0.0 15.255.255.255The ACLs filter Reverse Path Forwarding failures and drop them in hardware so that they are not forwarded to the router. This test has two parts. The first part tests multicast stub functionality on PFC1 (on SH1-107). The second part tests multicast stub functionality on the PFC2 (on SH1-109). In each, multicast traffic was sent from one side of the network (from Dista-1 and Dista-2) to the other side. As a component of each part, the non-Reverse Path Forwarding rate limiting functionality was observed.
Test Plan
The procedure used to perform the non-TFP rate limiting and multicast stub test follows.
Supervisor 1
In this part of the test, SH1-107 was configured to be the multicast stub router. Five groups of multicast traffic (groups 239.255.127.100 to 239.255.127.104) were sent from Dista-2. Joins for these five groups were sent from Dista-1. The IP address of the remote interface connecting SH1-107 to SH1-104 was configured as the IGMP helper address. The IGMP join packets that were received by SH1-107 were forwarded via this address statement to SH1-104. All five groups should appear on SH1-104, when the show ip igmp groups command is used.
Coupled with the mls ip multicast stub command on SH1-107 is the ip pim neighbor-filter access-list command configured on SH1-104. This configuration blocked PIM neighbor updates coming from SH1-107, and made SH1-107 truly transparent to the rest of multicast functionality.
Step 1
Step 2
Commands
•
Step 3
Commands
•
Step 4
Commands
•
•
Step 5
Commands
•
Step 6
Commands
•
Step 7
Step 8
Step 9
Commands
•
•
Step 10
Commands
•
Step 11
Commands
•
•
•
Step 12
Step 13
Step 14
Step 15
Supervisor 2
In this part of the test, SH1-109 was configured to be the multicast stub router. Five groups of multicast traffic (groups 239.255.129.100 through 239.255.129.104) were sent from Dista-1. Joins for these five groups were sent from Dista-2. The IP address of the remote interface connecting SH1-109 to SH1-104 was configured as the IGMP helper address. The IGMP join packets that are received by SH1-109 were forwarded via this address statement to SH1-104. All five groups should appear on SH1-104, when the show ip igmp groups command is used.
Coupled with the mls ip multicast stub command on SH1-109 is the ip pim neighbor-filter access-list command configured on SH1-104. This configuration blocked PIM neighbor updates coming from SH1-109, and made SH1-109 truly transparent to the rest of multicast functionality.
Step 1
Step 2
Commands
•
Step 3
Commands
•
Step 4
Commands
•
•
Step 5
Commands
•
Step 6
Commands
•
Step 7
Step 8
Step 9
Commands
•
•
Step 10
Commands
•
Step 11
Commands
•
•
•
Step 12
Step 13
Step 14
Step 15
Expected Results
We expect the multicast stub command to work and non-RPF rate limiting functionality to work on Policy Feature Cards (PFC1 and PFC2), and dCEF, including a hardware shortcut.
Results
Table 24 shows the non-RPF rate limiting and multicast stub test results.
Table 24 Non-RFP Rate Limiting and Multicast Stub Test Results
Non-Reverse Path Forwarding Rate Limiting and Multicast Stub
Pass
Gigabit EtherChannel Failover: Non-dCEF GEC Failover
This test verified multicast and MSDP functionality during a non-distributed Cisco Express Forwarding (dCEF) GEC failover.
Traffic for multicast groups 239.255.127.100 through 239.255.127.104 was sent out via IXIA from Dista-1 and received at Dista-2. Traffic was sent at a rate of 10,000 pps. The port channel between devices SH1-103 and SH1-108 was failed, first two of four ports, then all four ports.
Note
Test Plan
The procedure used to perform the Gigabit EtherChannel failover: non-dCEF GEC failover test follows.
Step 1
Step 2
Commands
•
Step 3
Commands
•
Step 4
Step 5
Commands
•
•
Step 6
Step 7
Commands
•
•
•
Step 8
Commands
•
Step 9
Commands
•
•
Step 10
Step 11
Step 12
Commands
•
•
•
Step 13
Commands
•
•
•
Step 14
Expected Results
We expect that multicast and MSDP functionality during a non-distributed (dCEF) GEC failover to work properly.
Results
Table 25 shows the Gigabit EtherChannel failover: non-dCEF GEC failover test results.
Gigabit EtherChannel Failover: Mixed GEC Failover
This test verified multicast and MSDP functionality during a dCEF and non-dCEF GEC failover. There was a four-port channel between devices SH1-103 and SH1-110. On the SH1-103 side, those four ports were spread evenly between two modules, a dCEF-capable module, and a non-dCEF module. During this test, the two ports on the non-dCEF module were disabled and enabled, one port on each dCEF and non-dCEF module were disabled and enabled, both ports on the dCEF card were disabled and enabled, and, all four ports were disabled and enabled.
Note
Note
Test Plan
The procedure used to perform the Gigabit EtherChannel failover: mixed GEC failover test follows.
Step 1
Step 2
Commands
•
Step 3
Commands
•
Step 4
Step 5
Step 6
Commands
•
•
•
•
•
Step 7
Commands
•
Step 8
Commands
•
•
Step 9
Step 10
Step 11
Step 12
Step 13
Step 14
Step 15
Commands
•
•
•
Step 16
Commands
•
•
Step 17
Expected Results
We expect multicast and MSDP functionality during a dCEF and non-dCEF GEC failover to work properly.
Results
Table 26 shows the Gigabit EtherChannel failover: mixed GEC failover test results.
Gigabit EtherChannel Failover: dCEF GEC Failover
This test verified multicast and MSDP functionality during a dCEF GEC failover. There was a four-port channel between devices SH1-104 and SH1-110. On the SH1-110 side, those four ports were spread evenly between two dCEF-enabled modules. During this test, two ports of the dCEF GEC were disabled and enabled, then all four ports were disabled and enabled.
Test Plan
The procedure used to perform the IP Multicast Gigabit EtherChannel Failover: dCEF GEC Failover test follows.
Step 1
Step 2
Commands
•
Step 3
Commands
•
Step 4
Step 5
Step 6
Commands
•
Step 7
Commands
•
•
•
•
Step 8
Commands
•
Step 9
Commands
•
•
Step 10
Step 11
Step 12
Commands
•
•
Step 13
Commands
•
•
•
Step 14
Expected Results
We expect multicast and MSDP functionality during a dCEF GEC failover to work properly.
Results
Table 27 shows the IP multicast Gigabit EtherChannel Failover: dCEF GEC Failover test results.
Table 27 IP Multicast Gigabit EtherChannel Failover: dCEF GEC Failover Test Results
Pass
Switch Fabric Module Failover
This test verified multicast functionality during Switch Fabric Module (SFM) failover. Multicast traffic generated by IXIA was sent through the network from Dista-2 to Dista-1, through SH1-110. The legacy module on SH1-110 was powered down, ensuring compact-mode switching, and the active SFM was failed in a number of situations. Traffic was tracked in each case, and traffic loss was calculated.
In several of the following steps, verification that the traffic is using the SFM is requested. Verify by examining how the Medusa ASIC is handling traffic. The Medusa ASIC interfaces are between the line card local bus and the backplane of the Catalyst 6500. If traffic is using the SFM (no legacy, or nonfabric-enabled, cards present), the Medusa mode will be "Compact" for all line cards, indicating that it is sending a compact header on the backplane for the switching decision. Note that any WS-X6816 modules are always in "Compact" mode, because they are fabric-only cards. More on the switching modes involving the SFM can be found at the Cisco Catalyst 6500 Series Switches site:
http://www.cisco.com/en/US/products/hw/switches/ps708/products_configuration_guide_chapter09186a008007fb2a.html#xtocid17541
Test Plan
The procedure used to perform the fabric module failover test follows.
Step 1
Step 2
Commands
•
Step 3
Commands
•
Step 4
Commands
•
Step 5
Commands
•
Step 6
Step 7
Commands
•
•
•
Step 8
Commands
•
•
•
Step 9
Commands
•
•
Step 10
Commands
•
•
•
Step 11
Commands
•
•
Step 12
Expected Results
We expect multicast functionality during SFM failover to work properly.
Results
Table 28 shows the switch fabric module failover test results.
Gigabit Ethernet Module Failover
This test verified multicast functionality during Gigabit Ethernet (GE) module failover. The Gigabit Ethernet modules of SH1-110 and SH1-108 was reset (failed over) with traffic passing through them. The ability of the devices to compensate for these failovers was measured by traffic loss.
Test Plan
The procedure used to perform the Gigabit Ethernet module failover test follows.
Step 1
Step 2
Commands
•
Step 3
Commands
•
Step 4
Commands
•
Step 5
Commands
•
Step 6
Step 7
Commands
•
•
•
Step 8
Commands
•
Step 9
Commands
•
Step 10
Commands
•
Step 11
Commands
•
Step 12
Commands
•
Step 13
Step 14
Step 15
Commands
•
Step 16
Commands
•
Step 17
Commands
•
Step 18
Expected Results
We expect multicast functionality during GE module failover to work properly.
Results
Table 29 shows the Gigabit Ethernet module failover test results.
Protocol Independent Module-Designated Router Failover
This test verified multicast functionality during designated router (PIM-DR) failover. IXIA traffic for five multicast groups was sourced from the IXIA connected to Dista-1 and collected from Dista-2. The default PIM-DRs in this part of the network are SH1-108 (Sup12) and SH1-110 (Sup22). Their backups were SH1-107 and SH1-109, respectively. Giving coverage to the Sup22, SH1-110 was isolated from the network by shutting down its port-channel interfaces to its neighbors. SH1-109 was then forced to take over the PIM-DR role and forward traffic. Coverage was given for the Sup12 by performing similar actions on SH1-108 and SH1-107.
Test Plan
The procedure used to perform the Protocol Independent Module-designated router (PIM-DR) failover test follows.
Step 1
Step 2
Commands
•
•
Step 3
Commands
•
Step 4
Commands
•
Step 5
Commands
•
Step 6
Step 7
Step 8
Commands
•
•
•
Step 9
Commands
•
•
Step 10
Commands
•
•
•
Step 11
Commands
•
•
Step 12
Commands
•
•
•
Step 13
Expected Results
We expect multicast functionality during PIM-DR failover to work properly.
Results
Table 30 shows the protocol independent module-designated router failover test results.
Auto-Rendezvous Point Functionality and Failover
Auto Rendezvous Point eliminates the need to statically (manually) configure rendezvous point information in every router in the network. Selected routers in the network can be configured to be candidate rendezvous points for a given set of multicast groups (as defined by access control lists). These routers advertise their candidacy in the form of rendezvous point-announce messages at a configurable interval (default is 60 seconds).
One or more (for redundancy) routers are configured as mapping agents, which will cache active Group-to rendezvous point information. Mapping agents learn which routers are candidate rendezvous points for given groups by joining the well-known Cisco-RP-Announce multicast group (224.0.1.39) to receive candidate rendezvous point announcements. Once an rendezvous point is selected (based on highest IP address) by the mapping agent, the other routers in the network will learn of the IP address of the rendezvous point for the given groups by listening to the well-known Cisco-RP-Discovery multicast group (224.0.1.40) which they had joined at startup.
The command to configure a router as a candidate rendezvous point is:
ip pim send-rp-announce interface scope ttlThe command to configure the mapping agent is:
ip pim send-rp-discovery scope ttlThis test verified that two candidates were configured with each of those routers also acting as the mapping agents. Test success was based on whether the candidate with the highest IP address was correctly advertised as the rendezvous point for the active groups. A test involving the failure of the elected candidate rendezvous point wasl also performed to verify traffic failover of the candidate with the lower IP address, and to verify that traffic reverted its path through the candidate with the higher IP address, once it comes back online.
Test Plan
The procedure used to perform the auto-RP functionality and failover test follows.
Step 1
Step 2
Step 3
Commands
•
•
•
•
Step 4
Commands
•
•
Step 5
Commands
•
Step 6
Commands
•
Step 7
Step 8
Step 9
Commands
•
•
•
Step 10
Commands
•
Step 11
Commands
•
•
•
Step 12
Commands
•
•
•
Step 13
Commands
•
•
•
Step 14
Commands
•
Step 15
Expected Results
We expect the Auto Rendezvous Point feature to eliminate the need to manually configure rendezvous point information in every router in the network. We also expect to see traffic fail over of the candidate with the lower IP address and when the elected candidate rendezvous point fails, that traffic reverts its path through the candidate with the higher IP address when it comes back online.
Results
Table 31 shows the auto-RP functionality and failover test results.
Layer 3 Interface Multicast Negative
This test introduced faults into the topology and verified that multicast functionality remained consistent with functional specifications on Layer 3 ports. We introduced online insertion and removal (OIR) of line cards, reset individual line cards, and reload the switch and supervisor engine or Switch Fabric Module failover.
Test Plan
The procedure used to perform the Layer 3 interface multicast negative test follows.
Step 1
Step 2
Commands
•
Step 3
Commands
•
Step 4
Commands
•
Step 5
Commands
•
•
Step 6
Commands
•
•
Step 7
Commands
•
Step 8
Commands
•
Step 9
Commands
•
Step 10
Commands
•
•
Step 11
Commands
•
Step 12
Commands
•
•
•
•
Step 13
Commands
•
Step 14
Commands
•
Step 15
Expected Results
We expect multicast functionality to remain consistent with functional specifications on Layer 3 ports when introducing faults into the topology.
Results
Table 32 shows the Layer 3 interface multicast negative test results.
Unicast and Multicast Test with 130K Injected IP Routes
This test verified that the switch functioned correctly when both unicast and multicast traffic were added with 100K BGP, 20K OSPF, and 10K EIGRP routes injected into the network.
Test Plan
The procedure used to perform the unicast and multicast test with 130K injected IP routes test follows.
Step 1
Step 2
Commands
•
•
Step 3
Commands
•
•
•
•
Step 4
Commands
•
•
•
•
Step 5
Commands
•
•
•
•
Step 6
Commands
•
Step 7
a.
b.
c.
d.
Step 8
Commands
•
Step 9
a.
b.
Step 10
a.
b.
Step 11
Step 12
Expected Results
We expect that switch to function correctly when both unicast and multicast traffic are added with 100K BGP, 20K OSPF, and 10K EIGRP routes injected into the network.
Results
Table 33 shows the unicast and multicast test with 130K injected IP routes test results.
IP PIM Neighbor-Filter Command
DDTS CSCdw63676 describes a case in which the router crashes when the ip pim neighbor-filter access-list command is entered on a VLAN interface, regardless of whether that ACL is present.
This test verified that the solution for this DDTS was effective and present in Cisco IOS Release 12.1(8b)E12. The DUT is SH1-103. This command was configured on a VLAN on the DUT. This test verified that no negative effect resulted from this command being entered.
Test Plan
The procedure used to perform the IP PIM neighbor-filter command test follows.
Step 1
Commands
•
•
Step 2
Step 3
Expected Results
We expect that no negative effect results from entry of the ip pim neighbor-filter access-list command in Cisco IOS Release 12.1(8b)E12.
Results
Table 34 shows the IP multicast IP PIM neighbor-filter command test results.
Dual Sources
DDTS CSCdx55659 describes a case in which an (S, G) entry on a router was deleted if that router was receiving traffic for a single multicast group from two separate, legitimate sources. In this case, for which a solution was verified in this test, traffic for multicast group 239.255.127.100 entered the network at Dista-2. A multicast receiver was on SH1-109 and successfully received this traffic (creating an (S, G) entry in its mroute table. If a second source for group 239.255.127.100 was started, entering at SH1-108, this (S, G) entry on SH1-109 was deleted after about 2 minutes. If the traffic source was stopped, the (S, G) entry will not recover on its own; instead, a clear ip mroute * command needed to be entered.
A fix for this problem was integrated into Cisco IOS Release 12.1(8b)E12. A successful test was one in which the problem fails to reproduce, and all traffic sent by both sources was received.
Test Plan
The procedure used to perform the dual sources test follows.
Step 1
Step 2
Step 3
Step 4
Commands
•
Step 5
Step 6
Commands
•
Step 7
Expected Results
We expect this DDTS to fail to reproduce, and all traffic sent by both sources to be received.
Results
Table 35 shows the dual sources test results.
Secondary Subnet
DDTS CSCdu71914 provides a fix for a case in which MLS entries are not created for IP multicast traffic on secondary subnets. This test verified resolution of the problem. On device SH1-108, a secondary subnet was defined for VLAN 15, to which the IXIA-generated multicast traffic came, from Dista-2. The primary IP address for VLAN 15 was 172.31.15.69/24. The secondary IP address for VLAN 15 on SH1-108 was 172.31.150.69/24. The IXIA port 7/2, which was the source of the IGMP joins and the destination for the multicast traffic, configured for IGMP joins coming from IP sources 172.31.15.72 and 172.31.150.72.
With these configurations in place, an IXIA traffic stream for groups 239.255.127.100 through 239.255.127.104 was started from Dista-2. IGMP joins were started on Dista-1 for those groups (Ix7/2). This test verified that an MLS entry exists on SH1-108 for the secondary subnet.
Test Plan
The procedure used to perform the secondary subnet test follows.
Step 1
Step 2
Commands
•
Step 3
Step 4
Step 5
Step 6
Step 7
Commands
•
Step 8
Commands
•
Step 9
Commands
•
•
Step 10
Commands
•
•
Step 11
Commands
•
•
Step 12
Step 13
Expected Results
We expect MLS entries will be created for IP multicast traffic on secondary subnets.
Results
Table 36 shows the secondary subnet test results.
MSDP Failover
This test verified MSDP functionality during an MSDP PIM-rendezvous point (RP) failover. A multicast traffic stream was sent from Dista-1 to Dista-2. SH1-103, was configured as the PIM rendezvous point, and traffic flowed through it. The rendezvous point (SH1-103) was failed over in three ways. First, it was isolated by shutting down its port-channel interfaces connecting it to the rest of the network (simulating a device failure). Second, the loopback1 interface on SH1-103 will be shut down, forcing SH1-104 to become the rendezvous point. Third, the port-channel between SH1-103 and SH1-108 was shut down, forcing SH1-104 to become the rendezvous point.
Test Plan
The procedure used to perform the MSDP failover test follows.
Step 1
Step 2
Commands
•
•
Step 3
Commands
•
Step 4
Commands
•
Step 5
Commands
•
Step 6
Step 7
Note
Commands
•
Step 8
Commands
•
•
Step 9
Commands
•
•
Step 10
Commands
•
•
Step 11
Commands
•
•
Step 12
Commands
•
•
Step 13
Commands
•
•
Step 14
Expected Results
We expect that multicast traffic will be forwarded in the event of an MSDP failover.
Results
Table 37 shows the MSDP failover test results.
Layer 3 Routing Features
Layer 3 routing feature testing for Safe Harbor involves these features:
•
•
Cisco Express Forwarding
Cisco Express Forwarding (CEF) evolved to best accommodate the changing network dynamics and traffic characteristics resulting from increasing numbers of short period flows typically associated with web-based applications and interactive type sessions. Existing Layer 3 switching paradigms use a route-cache model to maintain a fast lookup table for destination network prefixes. The route-cache entries are traffic-driven in that the first packet to a new destination was routed via routing table information and, as part of that forwarding operation, a route-cache entry for that destination was then added. This behavior allows subsequent packet flows to that same destination network to be switched based on an efficient route cache match. These entries are periodically aged out to keep the route cache current and can be immediately invalidated if the network topology changes. This "demand-caching" scheme—maintaining a very fast access subset of the routing topology information—is optimized for scenarios whereby the majority of traffic flows are associated with a subset of destinations. However, given that traffic profiles at the core of the Internet (and potentially within some large enterprise networks) are no longer resembling this model, a new switching paradigm was required that would eliminate the increasing cache maintenance resulting from growing numbers of topologically dispersed destinations and dynamic network changes.
CEF avoids the potential overhead of continuous cache churn by instead using a Forwarding Information Base (FIB) for the destination switching decision that mirrors the entire contents of the IP routing table; that is, there was a one-to-one correspondence between FIB table entries and routing table prefixes, Therefore, there was no need to maintain a route cache.
The following tests were performed:
•
•
Cisco Express Forwarding Packet-Switching
This test verified that IP unicast traffic was hardware-switched. If traffic was not hardware-switched (by the PFC), the traffic was fast-switched by the MSFC (see Table 38).
Results Summary
Table 38 Packets Hardware-Switched
500
500
1000
100
Test Plan
The procedure used to perform the Layer 3 CEF Cisco Express Forwarding Packet Switching follows.
Note
Step 1
The Safe Harbor test bed has many redundant paths and the resulting asymmetric routes. For this test, block those routes to force a symmetric route between the test switches.
As the result of those interfaces being shut, all traffic is switched across module 3 on SH1-99.
Step 2
SH1-99#sho mls statistics | begin Module 3Statistics for Earl in Module 3Expected Results
We expect that IP unicast traffic will be hardware-switched.
Results
Table 39 shows the Cisco express forwarding packet-switching test results.
Cisco Express Forwarding Table Entries
This test verified that correct CEF table entries were used to forward IP unicast traffic passing through a switch on a WS-X6816 module with Distributed Forwarding Card (DFC).
The correct MSFC2 CEF table entries were created from the routing information obtained using the OSPF routing protocol. The proper CEF table entries were created for connected routes and remote routes.
Test Plan
The procedure used to perform the Layer 3 Cisco Express Forwarding Table Entries test follows.
Step 1
Step 2
Expected Results
We expect that correct CEF table entries were used to forward IP unicast traffic passing through a switch on a WS-X6816 module with DFC.
Results
Table 40 shows the CEF table entries test results.
CEF Load Balance
These tests verified that HW shortcuts and CEF distribution functioned properly with IP unicast traffic. Two tests were performed that monitored unicast traffic streams of "many-to-one" with 20 incremented IP addresses sending traffic to a single destination IP address and "many-to-many" with 100 source and 100 destination address pairs.
Test One
The first test, many-to-one, confirmed that traffic sourced from multiple source addresses to a single used multiple paths if they were available. Traffic was shown to be hardware-switched on both the supervisor 1 and supervisor 2 modules.
Test Two
The second test, many-to-many, confirmed that traffic sourced from multiple source IP addresses to multiple destination IP addresses was switched in hardware and used multiple paths. Depending on the network configuration, the supervisor2/MSFC2 will fail to use all shared paths (polarization) because the hash algorithm will always group the traffic using the ipSrc, ipDst, and pathCount values in the same group.
The polarization problem was not present when SUP1 and SUP2 are mixed because they use different hash algorithms.
Test Plan
The procedure used to perform the Layer 3 CEF load-balance test follows.
Step 1
The first traffic topology, many-to-one, used 20 incrementing source IP addresses destined to a single IP address. The traffic source was IXIA-1 port Ix8/2 connected to switch Dista-1. The destination IP address was IXIA-1 port Ix-10/2 connected to switch Dista-2. Router SH1-108 received the traffic from Dista-1 and distributed it into the test network.
Step 2
Look at the MLS entries on the routers to "prove" that CEF is working and that the traffic is being hardware-switched. Also look at the CPU utilization by the devices during this portion of the test. A full 100 MB of traffic will be sent, and little if any impact on the CPU should be seen.
Step 3
In the second test, many-to-many, send IXIA unicast traffic from Dista-2 (Ix-10/2) to Dista-1 (Ix-8/2). The traffic consists of destination and source IP address pairs unicast traffic. The traffic rate is 170,000 74-byte packets per second. Use the observance of zero-impact on the CPU to confirm that traffic is being hardware-switched. Examine interface counters to follow the path of the stream from source to destination.
Traffic Source Connections
IXIA_10/2 ---- 2/6_DISTA2_(1/2,4/3,4/12-13) ----
(gi7/3,gi8/5,gi7/5,gi8/3-Port-channel20)_SH1-110
Test Traffic
Source Addresses -172.31.26.102-201 (172.31.26.0)Destination Addresses - 172.31.16.82-181 (172.31.16.0)Polarization
The Sup2/MSFC2 uses the ipSrc, ipDst and pathcount to make frame distribution decisions. Under certain network configurations traffic may not always use all paths available in the CEF table. In the test configuration switches 110, 103, and 104, all have the same pathcount.
Expected Results
We expect HW shortcuts and CEF distribution to function properly with IP unicast traffic.
Results
Table 41 shows the CEF load balance test results.
Open Shortest Path First
Open Shortest Path First (OSPF) is an Interior Gateway Protocol (IGP) developed by the OSPF working group of the Internet Engineering Task Force (IETF). Designed expressly for IP networks, OSPF supports IP subnetting and tagging of externally derived routing information. OSPF also allows packet authentication and uses IP multicast when sending and receiving packets.
The following tests were performed:
•
Autocost
This test verified that the auto-cost reference-bandwidth command functioned correctly. OSPF used the interface cost to compute routing matrics. By default:
cost = 100/bandwidth (in Mbps)
The lowest cost is 1, which is for 100 Mbps interfaces. To let GE, GEC or 10 GE, and so on interfaces have a cost that will allow comparison of the higher speed connections, the autocost command was used to set up a higher reference bandwidth other than 100 Mbps. The default autocost reference bandwidth for the Native IOS Safe Harbor testing was 100,000.
Test Plan
The procedure used to perform the Layer 3 OSPF autocost test follows.
Step 1
Step 2
Commands
•
Step 3
Commands
•
•
Step 4
Commands
•
•
Step 5
Commands
•
•
Step 6
Expected Results
We expect the auto-cost reference-bandwidth command to function correctly.
Results
Table 42 shows the OSPF autocost test results.
Passive Interface
This test verified that the passive-interface command functioned correctly. Routers should not send routing updates out passive interfaces. In the case of OSPF, hello packets will not be sent out passive interfaces, so a neighbor will not be formed.
For this test, SH1-106 was an OSPF neighbor to devices SH1-99 and SH1-100 in OSPF area 2. SH1-100 and SH1-99 were sent OSPF routes by Pagent. SH1-100 and SH1-106 were connected by a port-channel, interface port-channel 67 on SH1-100 and interface port-channel 167 on SH1-106. SH1-99 and SH1-106 were connected by a port-channel, interface port-channel 67 on SH1-100 and interface port-channel 67 on SH1-106. The passive-interface command was configured on port-channel 67 on SH1-100 and on port-channel 67 on SH1-99. The neighbor tables on SH1-100 and SH1-99 were checked to verify that the command worked (SH1-106 should be removed). SH1-106 lost about 20,000 OSPF routes out of its routing table. The passive-interface commands were removed and the neighbor relationships and route table updates were verified.
Test Plan
The procedure used to perform the Layer 3 OSPF Passive Interface test follows.
Step 1
Step 2
Commands
•
•
Step 3
Commands
•
Step 4
Commands
•
Step 5
Commands
•
Step 6
Commands
•
•
Step 7
Commands
•
Step 8
Commands
•
•
Step 9
Expected Results
We expect the passive-interface command to function correctly and routers to not send routing updates out passive interfaces.
Results
Table 43 shows the OSPF passive interface test results.
Filtering
This test verified the capability of OSPF to filter out routes using the distribute-list command. SH1-97, SH1-100, and SH1-106 were connected as such: SH1-97, SH1-100, and SH1-106. These connections were Layer 3 links (channels). The link between SH1-100 and SH1-106 (port-channel 13) was network 172.31.1.96/30. SH1-97 knows, through OSPF, that this network via port-channel 13. In this test, SH1-97 was configured with an access list and the distribute-list command, so that SH1-97 no longer knew this route; it was filtered out.
Test Plan
The procedure used to perform the Layer 3 OSPF filtering test follows:
Step 1
Step 2
Commands
•
Step 3
Commands
•
Step 4
Commands
•
Step 5
Commands
•
Step 6
Note
Commands
•
Step 7
Commands
•
Step 8
Commands
•
Step 9
Expected Results
We expect OSPF to filter out routes using the distribute-list command.
Results
Table 44 shows the OSPF filtering test results.
OSPF Redistribution
This test verified that redistribution of EIGRP into OSPF functioned properly.
Test Plan
The procedure used to perform the Layer 3 OSPF redistribution test follows.
Step 1
Step 2
Commands
•
•
Step 3
Commands
•
Step 4
Commands
•
Step 5
Commands
•
•
•
Step 6
Commands
•
Step 7
Expected Results
We expect redistribution of EIGRP into OSPF to function properly.
Results
Table 45 shows the OSPF redistribution test results.
OSPF Topology Database
This test verified that the OSPF topology database functioned correctly.
Test Plan
The procedure used to perform the Layer 3 OSPF topology database test follows.
Step 1
Note
Results Summary
Note
Area 0
Area 1
Area 2
Note
Expected Results
We expect the OSPF topology database to function correctly.
Results
Table 49 shows the OSPF topology database test results.
Border Gateway Protocol
Border Gateway Protocol (BGP) is an exterior gateway protocol designed to exchange network reachability information with other BGP systems in other autonomous systems. BGP exchanges routing information in the form of routing updates. An update includes a network number, a list of autonomous systems that the routing information has passed through (the autonomous system path), and a list of other path attributes.
The following tests were performed:
•
Scale to Ten BGP Neighbors in Core
This test verified that no memory leaks or unexpected CPU load occurred with eight BGP neighbors in the core (four core routers and four Pagent neighbors) and a total of 100K BGP routes, 20K OSPF routes, and 10K EIGRP routes.
Test Plan
The procedure used to perform the Layer 3 scale to ten BGP neighbors in core test follows.
Step 1
Step 2
Expected Results
We expect no memory leaks or unexpected CPU load to occur with 8 BGP neighbors in the core.
Results
Table 50 shows scale to ten BGP neighbors in core test results.
Route Redistribution
This test verified that route redistribution worked correctly between BGP and both OSPF and EIGRP.
Test Plan
The procedure used to perform the Layer 3 BGP route redistribution test follows.
Step 1
Add the redistribute ospf 1 metric 100 command to SH1-100.
Step 2
Step 3
Step 4
Step 5
Step 6
Expected Results
We expect route redistribution to function correctly between BGP and both OSPF and EIGRP.
Results
Table 51 shows BGP route redistribution test results.
BGP Neighbor Flap
This test verified that a flapping nondampened BGP peer did not cause any memory leaks or prolonged high CPU utilization, and that the device under test (DUT) functioned properly after the peer stopped flapping. With BGP routes being fed into devices SH1-97 and SH1-98, this procedure simulated constant flapping of those BGP neighbors. Specifically, the Pagent device rtp-wbu-te-p4 was feeding 35,000 BGP routes into SH1-97 from interface fa1/0. The Pagent configuration on this interface was modified to enable flapping and the test was run for a period of 8 hours.
Test Plan
The procedure used to perform the Layer 3 BGP neighbor flap test follows.
Step 1
Commands
•
Step 2
Commands
•
Step 3
Commands
•
Step 4
Commands
•
•
•
Expected Results
We expect no memory or CPU issues.
Results
Table 52 shows BGP neighbor flap test results.
Hot Standby Routing Protocol
For IP, the Hot Standby Router Protocol (HSRP) allows one router to automatically assume the function of the second router if the second router fails. HSRP is particularly useful when the users on one subnet require continuous access to resources in the network.
The following tests were performed:
•
Basic HSRP
This test verified the basic functionality of HSRP. SH1-109 and SH1-110 were configured as HSRP routers for VLANs 10 to 20, peered to each other through Layer 2 switch Dista-2. This test verified that the configuration on each Layer 3 switch produced the desired results. The unicast traffic stream that was running in the background from Dista-2 to SH1-105 was used to prove that traffic chose the active HSRP router.
Test Plan
The procedure used to perform the Layer 3 Basic HSRP test follows.
Step 1
Commands
•
Step 2
Commands
•
Step 3
Commands
•
Expected Results
We expect basic HSRP functionality to function according to specifications.
Results
Table 53 shows the basic HSRP test results.
HSRP Failover
This test verified HSRP failover when a link was down. This test also verified that the HSRP preempt command worked when the link returned to an up/up state, if the interface was configured with a higher priority than the currently active router interface in the same HSRP group.
Test Plan
The procedure used to perform the Layer 3 HSRP failover test follows.
Step 1
Step 2
Commands
•
Step 3
Step 4
Commands
•
•
Step 5
Commands
•
Step 6
Commands
•
Step 7
Step 8
Expected Results
We expect HSRP failover when a link is down.
Results
Table 54 shows the HSRP failover test results.
HSRP Failover Using Fast Timers
This test verified HSRP failover when a link is down, using fast timers. This test also verified that the HSRP preempt command worked when the link returned to an up/up state, if the interface was configured with a higher priority than the currently active router interface in the same HSRP group.
This test is similar to the HSRP failover test with standard timers. However, the hello timer and hold timer for VLAN45 on SH1-102 and SH1-102 were reduced to 1 and 3 seconds, respectively. By default, they are 3 and 10 seconds.
Test Plan
The procedure used to perform the Layer 3 HSRP failover (using fast timers) test follows.
Step 1
Step 2
Commands
•
Step 3
Step 4
Commands
•
•
Step 5
Commands
•
•
Step 6
Commands
•
Step 7
Commands
•
Step 8
Step 9
Expected Results
We expect HSRP failover when a link is down.
Results
Table 55 shows the HSRP failover using fast timers test results.
Enhanced Interior Gateway Routing Protocol
The Enhanced Interior Gateway Routing Protocol (EIGRP) is an enhanced version of the IGRP protocol developed by Cisco Systems. Enhanced IGRP uses the same distance vector algorithm and distance information as IGRP. However, the convergence properties and the operating efficiency of Enhanced IGRP have improved significantly over IGRP.
The convergence technology is based on research conducted at SRI International and employs an algorithm referred to as the Diffusing Update Algorithm (DUAL). This algorithm guarantees loop-free operation at every instant throughout a route computation and allows all devices involved in a topology change to synchronize at the same time. Routers that are not affected by topology changes are not involved in recomputations.
The following tests were performed:
EIGRP Summarization
This test verified manual EIGRP summarization by using the ip summary-address eigrp as-number interface configuration command.
There are a few /24 networks directly connected to SH1-101 and SH1-102 that can be summarized as /22 or /21 on the port-channels of SH1-100 (port channels 14 and 15).
•
•
The procedure used to perform the Layer 3 EIGRP summarization test follows.
Test Plan
Step 1
Step 2
•
Step 3
Expected Results
We expect EIGRP summarization to function according to specifications.
Results
Table 56 shows the EIGRP summarization test results.
EIGRP Redistribution
This test verified that EIGRP route redistribution worked correctly, with and without access lists and route map filtering.
Five /24 loop backs were directly connected to SH1-97. These loop backs were to be redistributed into EIGRP. After loop backs were redistributed into the EIGRP domain, the loopback addresses were filtered to allow only the odd subnets.
Test Plan
The procedure used to perform the Layer 3 EIGRP redistribution test follows.
Step 1
Step 2
Step 3
Step 4
•
•
Expected Results
We expect EIGRP redistribution to function according to specifications.
Results
Table 57 shows the EIGRP redistribution test results.
Network Management Features
Network management feature testing for Safe Harbor involves the following sections:
•
•
Simple Network Management Protocol
The Simple Network Management Protocol (SNMP) system consists of an SNMP manager, an SNMP agent, and a Management Information Base (MIB).
SNMP is an application-layer protocol that provides a message format for communication between SNMP managers and agents.
The following tests were performed:
•
Basic Functionality Shut/No Shut Interface
This test verified that basic SNMP functionality on the DUT functioned according to specification.
Test Plan
The procedure used to perform the SNMP Basic Functionality Shut/No Shut Interface test follows.
Step 1
Commands
•
Step 2
Step 3
Step 4
Expected Results
We expect basic functionality shut/no Shut interface to function according to specifications.
Results
Table 58 shows the basic functionality shut/no Shut interface test results.
Protos Request Application
PROTOS is an technology industry project standard that researches different approaches of testing implementations of protocols using functional testing methods. The goal is to support proactive elimination of faults with information security implications.
Protos testing involves sending erroneous SNMP packets to the DUT and running these tests on all permutations of supervisor and MSFC. This is a negative test, so the only verification is that the DUT was unaffected.
This test verified that there were no SNMP vulnerabilities in the Native Cisco IOS code from the perspective of malformed SNMP packets or intentional hacks. This test did not check for existing MIBs and did not verify the results from polling every possible MIB.
Test Plan
The procedure used to perform the SNMP Protos request application test follows.
Step 1
Step 2
Note
Step 3
Step 4
Expected Results
We expect the Protos request application to function according to specifications.
Results
Table 59 shows the Protos request application test results.
TACACS
Login authentication increases the security of the system by keeping unauthorized users from guessing the password. The user is limited to a specific number of attempts to successfully log in to the switch. If the user fails to authorize the password, the system delays accesses and captures the user ID and the IP address of the station in the syslog and in the SNMP trap.
The following test was performed:
Verify User Authentication
This test verified that the Terminal Access Controller Access Control System (TACACS) login authentication worked correctly and identified TACACS server for the DUT to peer with. The DUT was configured to point to that server for authentication information. Telnet was used to reach the DUT and verify the authentication function.
Test Plan
The procedure used to perform the TACACS user authorization test follows.
Step 1
Commands
•
•
•
•
•
Step 2
Commands
•
Step 3
Step 4
Commands
•
Expected Results
We expect TACACS login authentication to function correctly.
Results
Table 60 shows the verify user authorization test results.
Miscellaneous Features
Miscellaneous features tested for Safe Harbor are described in the following sections:
•
NTP Basic Functionality
Network Time Protocol (NTP) synchronizes timekeeping among a set of distributed time servers and clients. This synchronization allows events to be correlated when system logs are created and other time-specific events occur.
An NTP server must be accessible by the client switch. NTP runs over User Datagram Protocol (UDP), which runs over IP. NTP is extremely efficient; no more than one packet per minute is necessary to synchronize two machines to within a millisecond of one another.
This test verified basic functionality. It used a local Sun server (IP address: 172.18.177.132) as the NTP server. SH1-104 was configured as the NTP client.
Test Plan
The procedure used to perform the NTP functionality test follows.
Step 1
Commands
•
Step 2
Commands
•
Step 3
Commands
•
•
•
Expected Results
We expect synchronized timekeeping among a set of distributed time servers and clients.
Results
Table 61 shows the basic NTP functionality test results.
Syslog Basic Functionality
The System Log (syslog) protocol provides a transport to allow a machine to send event notification messages across IP networks to event message collectors, which are also known as syslog servers.
This test verified Syslog functionality.
Test Plan
The procedure used to perform the basic syslog functionality test follows.
Step 1
Commands
•
Step 2
Commands
•
•
Step 3
Commands
•
Step 4
Commands
•
Expected Results
We expect an established transport to send event notification messages across IP networks to event message collectors.
Results
Table 62 shows the basic syslog functionality test results.
User Datagram Protocol Broadcast Flooding
A broadcast is a data packet that is destined for multiple hosts. Broadcasts can occur at the data link layer and the network layer. Data-link broadcasts are sent to all hosts attached to a particular physical network. Network layer broadcasts are sent to all hosts attached to a particular logical network. TCP/IP supports the following types of broadcast packets:
•
•
•
Because broadcasts are recognized by all hosts, a significant goal of router configuration is to control unnecessary proliferation of broadcast packets. Cisco routers support two kinds of broadcasts: directed and flooded. A directed broadcast is a packet sent to a specific network or series of networks, whereas a flooded broadcast is a packet sent to every network. In IP internetworks, most broadcasts take the form of User Datagram Protocol (UDP) broadcasts.
The following test was performed:
UDP Broadcast Flooding
This test verified many functional aspects of UDP broadcast flooding. An IXIA broadcast stream was used for each aspect of the procedure. First, the broadcast stream was sent into the network at a single device. It was verified that this device forwarded the broadcast out all physical interfaces. Next the device was configured to use an IP helper address, which caused the IP destination portion of the header, originally a broadcast address, to be replaced by a unicast address, destined for the IP helper address.
The IXIA streams were configured with UDP port 53 (DNS). The next step of the test verified the functionality of the no ip forward-protocol command, which should halt the forwarding of any broadcasts using the protocol specified (in this case DNS).
Test Plan
The procedure used to perform the UDP broadcast flooding test follows.
Step 1
Step 2
Commands
•
Step 3
a.
b.
c.
Step 4
Step 5
Step 6
Step 7
Step 8
Step 9
Step 10
Step 11
Step 12
Expected Results
We expect devices to forward and halt all appropriate broadcasts.
Results
Table 63 shows the UDP broadcast flooding test results.
System Upgrade
This test measured the basic ability of the code to boot correctly. The boot process was followed in each case from the console and screened for any errors, and so on. The output shows three separate sections, one for each supervisor and MSFC combination: Sup11, Sup12, and Sup22.
This test verified that the Cisco IOS upgrade process worked correctly.
Test Plan
The procedure used to perform the system upgrade test follows.
Step 1
Commands
•
Step 2
Commands
•
•
Step 3
Commands
•
•
Step 4
Commands
•
•
Step 5
Commands
•
•
Step 6
Commands
•
Step 7
Commands
•
•
Step 8
Commands
•
•
Step 9
Commands
•
•
Step 10
Commands
•
•
Step 11
Commands
•
Step 12
Commands
•
•
Step 13
Commands
•
•
Step 14
Commands
•
•
Step 15
Commands
•
•
Expected Results
We expect the Cisco IOS system upgrade process to work properly and the code to boot correctly.
Results
Table 64 shows the system upgrade test results.
![]()
![]()
![]()
![]()
![]()
![]()
![]()
![]()
Posted: Wed Aug 3 23:20:41 PDT 2005
All contents are Copyright © 1992--2005 Cisco Systems, Inc. All rights reserved.
Important Notices and Privacy Statement.