|
|

This chapter briefly describes the Cache Engine's reporting and statistical controls. The following topics are discussed:
The Cache Engine generates reports (Figure 4-1) from the statistical information it gathers about Cache Engine operations on your network. Each report is available from the different the Reporting options:

To display the network event logs, click Reporting and select the Events option (Figure 4-2).
This display shows activity for one Cache Engine. To view activity for other caches, select the other cache's IP address from the IP address selection box (see Figure 3-6).

Step 1 Enter the total number of events you want to view in the Total field. The default display shows 10 events. (Click REFRESH to display additional messages.)
Step 2 Check the type of events you want logged:
Step 3 Click REFRESH.
To configure and view transaction logging, click Reporting and select the Logging option (Figure 4-3).
This display shows activity for one Cache Engine. To view activity for other caches, select the other cache's IP address from the IP address selection box (see Figure 3-6).
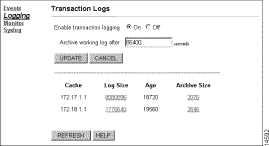
To enable transaction logging, perform these steps:
Step 1 Click On.
Step 2 Enter a number (of seconds) in the Archive Working Log after field to tell the Cache Engine how frequently you want the transaction log file (working.log) to be written to the archive log file (archive.log). These two files are stored in /ata0/LOGS/. If you wish to save the existing archive log file, you have the amount of time entered in the Archive Working Log after field to save the file before it is overwritten by the working log file.
The log file size grows rapidly so you may want to check the sizes in the Log Size and Archive Size fields frequently. We suggest that each file size not exceed 375 megabytes.
Step 3 Click UPDATE.
To retrieve transaction and archive log files, click on the hypertext link under the Log Size column and/or the Archive Size column. Your browser will offer you the option of 1) opening the file immediately, or 2) saving the log file. To view the .html file, select a web browser from the list of programs to use to open this file (see Figure 4-4.)
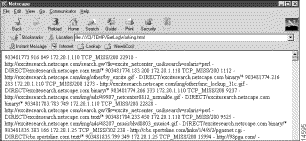
Each transaction log entry is formatted with ten (10) fields as shown in Figure 4-5. A dash ("-" ) is used if there is no entry for the field.)

1. Timestamp.
2. Elapsed milliseconds during the client connection.
3. Client IP address or host name.
4. HTTP code and status that indicates how the Cache Engine handled the request; for example:
(a) TCP_HIT means the object requested was returned to the client from the cache.
(b) TCP_MISS means the object requested was not in the cache and was retrieved from the Internet server.
(c) 200 is the HTTP status code for successful transactions.
(d) 304 is the HTTP status code for not modified.
(e) 404 is the HTTP status code for not found.
5. Number of bytes sent to the client.
6. HTTP request method (or ICP_QUERY for ICP requests).
7. Requested URL.
8. Ident if the ident_lookup flag is active.
9. Hierarchy code; for example:
(a) DIRECT (URL was fetched directly from the source).
(b) NONE (No hierarchy code).
10. Content type; for example binary or text.
To disable transaction logging, perform these steps:
Step 1 Click Off.
Step 2 Click UPDATE.
To monitor the Cache Engine's resources, click Reporting and select the Monitor option (Figure 4-6).
The graph displays activity for all Cache Engines. Scroll down to view the entire page.

Table 4-1 lists definitions for the Cache Engine's resource usage.
The display is updated in 10-second intervals.
| Term | Definition |
RUN TIME | Length of time the Cache Engine has been online. |
REQ/SEC | Number of requests the Cache Engine is serving per second. |
THREADS | Number of threads currently in use. |
% HITS | Percentage of requests the Cache Engine served from its cache. |
CPU LOAD | Percent utilization of the Cache Engine's CPU. |
DISK LOAD | Percent utilization of the Cache Engine's disk controller. |
NET LOAD | Percent utilization of the Cache Engine's network interface card. |
To configure your Cache Engine to send message data to a Syslog server on your network, click Reporting and select the Syslog option (Figure 4-7).
This display shows the configuration for one Cache Engine. To view another cache's configuration, select the other cache's IP address from the IP address selection box (see Figure 3-6).

Your network's Syslog host logs messages it receives from your Cache Engine based on the message's priority (Figure 4-8). The priority is a combination of the message's facility and a message's level (Figure 4-9).

Message facility, or service type, definitions are listed in Table 4-2.
Message level, or problem, descriptions are listed in Table 4-3.
| Facility | Description |
|---|---|
Kernel messages | Kernel messages |
User-Level messages | General user messages |
Mail system messages | |
Security daemon | Security messages |
Security authorization | Authorization system messages |
Syslog | System messages |
Line printer | Line printer spooling messages |
Netnews | Network news messages |
UUCP | UNIX-to-UNIX copy protocol messages |
Cron/at | Cron facility messages |
User-defined 0-7 | Reserved for up to 8 local user-defined messages. |

| Level | Description |
|---|---|
Emergency | System unusable |
Alert | Immediate action needed |
Critical | Critical conditions |
Error | Error conditions |
Warning | Warning conditions |
Notice | Normal but significant condition |
Information | Information only |
Debug | Useful information for debugging |
To configure the Cache Engine to forward messages to your network's Syslog server, perform the following steps:
Step 1 Enter your Syslog server's IP address in the Syslog Server field.
Step 1 Decide which messages you want the Cache Engine to forward to your Syslog server, and check one of the three check boxes: Critical, Warning, or Notice.
Step 2 Select the detail level from the Level pull-down menu.
Step 3 Select a service type from the Facility pull-down menu.
Step 4 Press UPDATE.
If URL tracking is enabled, the Cache Engine creates a URL tracking message each time it completes a request. A sample message will be displayed as follows:
<189> <hit> 171.67.97.117 --> http://www.domain.org/red.gif
To configure the Cache Engine to forward URL tracking messages to your network's Syslog server, perform the following steps:
Step 1 Check the URL Tracking check box.
Step 2 Select the detail level from the Level pull-down menu.
Step 3 Select a service type from the Facility pull-down menu.
Step 4 Press UPDATE.
Cache Engine programs gather statistical data about the Cache Engine operations. The Statistics section (Figure 4-10) divides each group of information into several options:

To view statistical information, click Statistics and select the DiagDump option (Figure 4-11). Statistics are divided into three categories:
Click REFRESH to view updated information.
This display shows activity for one Cache Engine. To view activity for other caches, select the other cache's IP address from the IP address selection box (see Figure 3-6).
Refer to Table 4-4 through Table 4-6 for descriptions of each field.
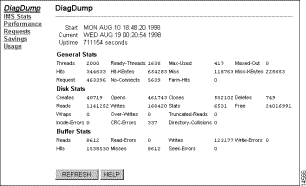
Table 4-4 describes the general statistics fields shown in the display.
| Term | Definition |
|---|---|
Threads | Number of current connections. |
Ready-Threads | Number of total available connections (2000). |
Max-Used | Peak number of concurrent connections since the system's last reboot. |
Maxed-Out | Number of times that the system has had zero (0) ready connections. |
Hits | Number of Cache hits. |
Hits-KBytes | Number of kilobytes delivered from the Cache Engine hard drives. |
Miss | Number of Cache misses. |
Miss-KBytes | Number of kilobytes retrieved from the Internet. |
Request | Number of requests serviced by the Cache Engine. |
NoConnects | Number of times the Cache Engine is cannot reach the server. |
Farm-Hits | Number of objects retrieved from another Cache Engine in the same farm. |
Table 4-5 describes the disk statistics fields shown in the display.
| Term | Definition |
Creates | Number of new files created. |
Opens | Number of existing files opened. |
Closes | Number of files closed. |
Deletes | Number of files deleted. |
Reads | Number of file system reads. |
Writes | Number of file system writes. |
Stats | Number of returns for system information from a file. |
Free | Amount of free disk space. |
Wraps | Number of times a partition has wrapped. |
Over-Writes | Number of files without a defined content length that exceeded the default of 48 kilobytes. |
Truncated-Reads | Number of end of the files prematurely reached. |
Inode-Errors | Number of file system corruption. |
CRC-Errors | Number of server connections that are prematurely terminated. |
Directory-Collisions | Number of directory lookup failures. |
Table 4-6 describes the buffer fields statistics shown in the display.
| Term | Definition |
Reads | Number of physical disk reads. |
Read-Errors | Number of failures to read from disk. |
Writes | Number of physical disk writes. |
Write-Errors | Number of failures to write to a drive. |
Hits | Number of objects retrieved from buffer. |
Misses | Number of objects retrieved from physical drive. |
Seek-Errors | Number of failures to position the disk head. |
To view Cache Engine IMS statistics, click Statistics and select the IMS Stats option (Figure 4-12).
The Cache Engine receives IMS requests for objects from browser clients and returns IMS requests as described in these sections:
The Fresh and Stale columns record whether a requested object was either "fresh" (304-Not Modified) or "stale" (expired). New objects were requested from the originating server if the object was expired. Click REFRESH to view updated information. Refer to Table 4-7 through Table 4-8 for descriptions of each field.
This display shows activity for one Cache Engine. To view activity for other caches, select the other cache's IP address from the IP address selection box (see Figure 3-6).
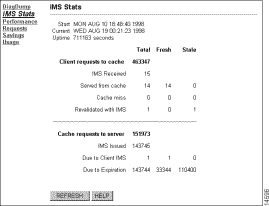
Table 4-7 describes the fields shown in the display.
| Term | Definition |
Client requests to cache | Number of total requests (IMS and non-IMS) the Cache Engine received from clients. |
IMS Received | Number of IMS requests the Cache Engine received from clients. |
Served from cache | Number of IMS requests served to the client from cache without validation. The objects are considered "fresh" objects. |
Cache miss | Number of IMS requests from the client that were not found in cache (number of cache misses). |
Revalidated with IMS | Number of IMS requests the Cache Engine revalidated. The objects are considered "expired" objects. |
Table 4-8 describes the fields shown in the display.
| Term | Definition |
Cache requests to server | Number of total requests (IMS and non-IMS) the Cache Engine sent to remote servers. |
IMS issued | Number of total IMS requests sent to remote servers from the Cache Engine. |
Due to client IMS | Number of IMS requests the Cache Engine sent due to a client IMS. |
Due to expiration | Number of IMS requests the Cache Engine sent to remote servers because the cached data requested by the clients had expired. |
To view Cache Engine performance statistics, click Statistics and select the Performance option (Figure 4-13).
This display shows activity for one Cache Engine. To view activity for other caches, select the other cache's IP address from the IP address selection box (see Figure 3-6).
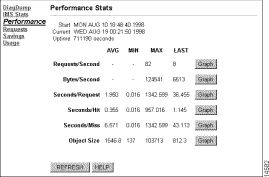
Start shows the day and time the Cache Engine was first operational.
Current shows the existing day and time.
Uptime shows how long the Cache Engine has been online.
AVG, MIN, MAX, and LAST report information about the Cache Engines' performance. To view performance for the past 60 minutes, 24 hours, and 30 days, click GRAPH. Click REFRESH to view updated information.
Table 4-9 describes the resource monitor fields shown in the display.
| Term | Definition |
Requests/Second | Average number of requests the Cache Engine serves per second. |
Bytes/Second | Average number of bytes the Cache Engine serves per second. |
Seconds/Request | Average number of seconds each Cache Engine connection lasts. |
Seconds/Hit | Average number of seconds required for each Cache Engine hit. |
Seconds/Miss | Average number of seconds required for each Cache Engine miss. |
Object Size | Average size of objects downloaded from the web hosts. |
To view statistics on miscellaneous HTTP request data, click Statistics and select the Requests option (Figure 4-14).
Click REFRESH to view updated information.
This display shows activity for one Cache Engine. To view activity for other caches, select the other cache's IP address from the IP address selection box (see Figure 3-6).

Table 4-10 describes the HTTP request fields shown in the display.
| Term | Definition |
|---|---|
Forced Reloads | Number of times a client browser requested a fresh copy of an object regardless of its freshness. |
Near Hits | Number of times a Cache Engine did not find the requested object in its cache, but retrieved the object from a Cache Engine in the farm. |
Server Errors | Number of times the Cache Engine failed to fill a request due to either a web host or network problem. The result includes a logged error and a network problem. |
URL Blocked | Number of times a client browser attempted to access an administratively blocked URL via the Cache Engine. |
ICP Client Hits | Number of times the Cache Engine satisfied a client request by getting an object from an ICP server. |
ICP Server Hits | Number of times the Cache Engine told an ICP client that an object is in the cache. |
To view the number of requests that have been served by the Cache Engine, click Statistics and select the Savings option (Figure 4-15).
To update the statistics on this display, click REFRESH.
To view graphical output, click GRAPH.
This display shows activity for one Cache Engine. To view activity for other caches, select the other cache's IP address from the IP address selection box (see Figure 3-6).
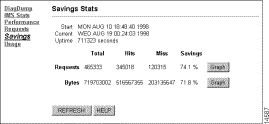
Table 4-11 describes the bandwidth savings fields shown in the display.
| Term | Definition |
|---|---|
Requests | Number of objects requested since the Cache Engine's last reboot. |
Bytes | Number of bytes the Cache Engine served since its last reboot. |
Total | Number of requests (or bytes) the Cache Engine served since it has been online (regardless of hits or misses). |
Hits | Number of requests (or bytes) the Cache Engine served since its last reboot. |
Miss | Number of requests (or bytes) the Cache Engine did not serve from its populated cache. |
Savings | Percentage of the total requests (or bytes) that the Cache Engine served from its populated cache. |
To view Cache Engine resource utilization statistics, click Statistics and select the Usage option (Figure 4-16).
To update the statistics on this display, click REFRESH.
To view performance for the past 60 minutes, 24 hours, or 30 days, click GRAPH.
This display shows activity for one Cache Engine. To view activity for other caches, select the other cache's IP address from the IP address selection box (see Figure 3-6).
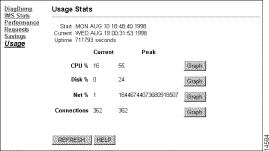
The Current column provides a snapshot of the Cache Engine's resource utilization, while the Peak column displays the maximum load since it was brought online.
Table 4-12 describes the usage statistics fields shown in the display.
| Term | Definition |
CPU % | Percentage of the Cache Engine's CPU usage. |
Disk % | Percentage of the Cache Engine's disk controller usage. |
Net % | Percentage of the network interface card usage. |
Connections | Number of connections the Cache Engine is servicing. |
![]()
![]()
![]()
![]()
![]()
![]()
![]()
![]()
Posted: Sat Sep 28 02:25:46 PDT 2002
All contents are Copyright © 1992--2002 Cisco Systems, Inc. All rights reserved.
Important Notices and Privacy Statement.