|
|

Table Of Contents
Configuring RMON Alarms and Events
Collecting Group History Statistics on an Interface
Configuring ML-Series Card RMON for CRC Errors
Configuration Guidelines for CRC Thresholds on the ML-Series Card
Accessing CRC Errors Through SNMP
Configuring an SNMP Trap for the CRC Error Threshold Using Cisco IOS
Determining the ifIndex Number for an ML-Series Card
Manually Checking CRC Errors on the ML-Series Card
Configuring RMON
This chapter describes how to configure remote network monitoring (RMON) on the ML-Series card for the ONS 15454 SONET/SDH.
RMON is a standard monitoring specification that defines a set of statistics and functions that can be exchanged between RMON-compliant console systems and network probes. RMON provides you with comprehensive network-fault diagnosis, planning, and performance-tuning information. The ML-Series card features RMON and is designed to work with a network management system (NMS).
Note
For complete syntax and usage information for the commands used in this chapter, see the "System Management Commands" section in the Cisco IOS Configuration Fundamentals Command Reference, Release 12.2.
Note
This chapter consists of these sections:
Understanding RMON
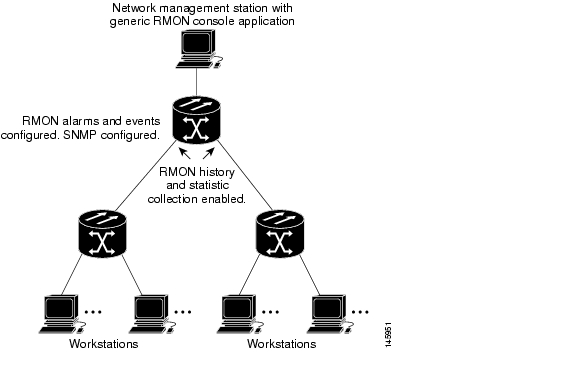
RMON is an Internet Engineering Task Force (IETF) standard monitoring specification that allows various network agents and console systems to exchange network monitoring data. You can use the RMON feature with the Simple Network Management Protocol (SNMP) agent to monitor all the traffic flowing among ML-Series card and other switches on all connected LAN segments.
For information on the MIBs supported by the ML-Series card, see the "Supported MIBs" section.
Figure 21-1 Remote Monitoring Example
Configuring RMON
These sections describe how to configure RMON on your ML-Series card:
•
•
•
Default RMON Configuration
RMON is disabled by default; no alarms or events are configured.
Configuring RMON Alarms and Events
You can configure your ML-Series card for RMON by using the command-line interface (CLI) or an SNMP-compatible network management station. We recommend that you use a generic RMON console application on the NMS to take advantage of RMON's network management capabilities. You must also configure SNMP on the ML-Series card to access RMON MIB objects. For more information about configuring SNMP, see "Configuring SNMP."
Beginning in privileged EXEC mode, follow these steps to enable RMON alarms and events. This procedure is required.
To disable an alarm, use the no rmon alarm number global configuration command on each alarm you configured. You cannot disable all the alarms that you configured by not specifying a specific number. You must disable each alarm separately. To disable an event, use the no rmon event number global configuration command. To learn more about alarms and events and how they interact with each other, see RFC 1757.
You can set an alarm on any MIB object. The following example configures RMON alarm number 10 by using the rmon alarm command. The alarm monitors the MIB variable ifEntry.20.1 once every 20 seconds to check the change in the variable's rise or fall until the alarm is disabled. If the ifEntry.20.1 value shows a MIB counter increase of 15 or more, such as from 100000 to 100015, the alarm is triggered. The alarm in turn triggers event number 1, which is configured with the rmon event command. Possible events can include a log entry or an SNMP trap. If the ifEntry.20.1 value changes by 0, the alarm is reset and can be triggered again.
ML_Series(config)# rmon alarm 10 ifInErrors.65539 20 delta rising 15 1 fall 0
Note
Where 65539 is the SNMP IfIndex for interface POS 0. You can get the SNMP ifIndex for a given port with an SNMP get. In the example output, you can see that the SNMP ifIndex for POS0 is 65539:
tuvoks-view:128> getmany -v2c 10.92.56.97 tcc@1 ifDescrifDescr.65536 = GigabitEthernet0ifDescr.65537 = GigabitEthernet1ifDescr.65538 = Null0ifDescr.65539 = POS0ifDescr.65540 = POS1ifDescr.65541 = SPR1tuvoks-view:129>The following example creates RMON event number 1 by using the rmon event command. The event is defined as High ifOutErrors and generates a log entry when the event is triggered by the alarm. The user jjones owns the row that is created in the event table by this command. This example also generates an SNMP trap when the event is triggered.
ML_Series(config)# rmon event 1 log trap eventtrap description "High ifOutErrors" owner
jjones
Collecting Group History Statistics on an Interface
You must first configure RMON alarms and events to display collection information.
Beginning in privileged EXEC mode, follow these steps to collect group history statistics on an interface. This procedure is optional.
To disable history collection, use the no rmon collection history index interface configuration command.
This example shows how to collect and show RMON history for the owner root:
ML_Series(config)# interface gigabitethernet1ML_Series(config-if)# rmon collection history 2 owner rootML_Series(config-if)# endML_Series# show rmon historyEntry 2 is active, and owned by rootMonitors ifIndex.393217 every 1800 second(s)Requested # of time intervals, ie buckets, is 50,Configuring ML-Series Card RMON for CRC Errors
The ML-Series card supports using an NMS for SNMP performance monitoring (PM), including monitoring cyclic redundancy check (CRC) errors. If the NMS supports periodic polling and programmed threshold values to monitor interface index errors (ifInErrors) for all the ML-Series card interfaces, you can manage and monitor CRC errors by relying on the NMS.
If the NMS does not support polling or if the desired polling frequency uses too much bandwidth, you can configure SNMP traps on the ML-Series card through the Cisco IOS CLI. This method is only for ML-Series cards on the ONS 15454 SONET/SDH. RMON capabilities for ML-Series cards on the ONS 15310-CL and ONS 15310-MA are best managed through Cisco Transport Controller (CTC), Transaction Language One (TL1), or Cisco Transport Manager (CTM) in the standard manner for the node.
Configuration Guidelines for CRC Thresholds on the ML-Series Card
These are the guidelines for determining the interface CRC errors (ifInErrors) threshold values for generating an NMS PM alert:
•
•
•
Accessing CRC Errors Through SNMP
CRC errors for each interface are reported in the IF-MIB object ifInErrors (OID 1.3.6.1.2.1.2.2.1.14). Users can check the current value of ifInErrors through SNMP get requests. Each ML-Series card runs a separate instance of SNMP. SNMP requests are relayed to the individual ML-Series card based on the community string. The community string uses the following format:
com_str_configured_from_CTC@ml_slot_numberConfiguring an SNMP Trap for the CRC Error Threshold Using Cisco IOS
The ML-Series card supports RMON trap functionality in Cisco IOS. You must use the Cisco IOS CLI to configure RMON to monitor ifInErrors and generate a trap to an NMS when a threshold is crossed. The ML-Series card on the ONS 15454 SONET/SDH does not support the configuration of RMON traps through an SNMP set request, which typically initiates an action on a network device.
Beginning in privileged EXEC mode, follow these steps to configure RMON to monitor ifInErrors and generate a trap for an NMS when a threshold is crossed:
Step 1
configure terminal
Enter global configuration mode.
Step 2
rmon event number [log] [trap community] [description string] [owner string]
Add an event in the RMON event table that is associated with an RMON event number.
•
•
•
•
•
Step 3
rmon alarm number ifInErrors.ifIndex-number interval {absolute | delta} rising-threshold value [event-number]
falling-threshold value [event-number]
[owner string]Set an alarm on the MIB object.
•
•
•
•
•
•
•
Step 4
end
Return to privileged EXEC mode.
Step 5
show running-config
Verify your entries.
Step 6
copy running-config startup-config
(Optional) Save your entries in the configuration file.
Below is an example of configuring an SNMP trap for the CRC error threshold.
ML_Series # configure terminalML_Series(config)# rmon event 10 log trap slot15 owner configML_Series(config)# rmon alarm 9 ifInErrors.983043 300 delta rising-threshold 1000 10 falling-threshold 1000 10 owner configML_Series(config)# endML_Series # show running-configML_Series # copy running-config startup-configThe ifIndex number of an ML-Series card interface in decimal form used for the rmon alarm command in the example is ifInErrors.983043. This variable is the MIB object to monitor combined with the ifIndex number of an ML-Series card interface. For information on determining the ifIndex number for an ML-Series card, see "Determining the ifIndex Number for an ML-Series Card" section.
Below is an example of a rising-threshold trap generated by 1002 ifInErrors crossing a threshold of 1000 in a 5-minute period.
2005-03-22 16:25:38 ptlm9-454e56-97.cisco.com [10.92.56.97]:SNMPv2-MIB:sysUpTime.0 = Wrong Type (should be Timeticks): 43026500SNMPv2-MIB:snmpTrapOID.0 = OID: RMON-MIB:risingAlarmRFC1271-MIB:alarmIndex.9 = 9RFC1271-MIB:alarmVariable.9 = OID: IF-MIB:ifInErrors.983043RFC1271-MIB:alarmSampleType.9 = deltaValue(2)RFC1271-MIB:alarmValue.9 = 1002RFC1271-MIB:alarmRisingThreshold.9 = 1000SNMPv2-SMI:snmpModules.18.1.3.0 = IpAddress: 10.92.56.97Determining the ifIndex Number for an ML-Series Card
When an NMS polls an ML-Series card for performance data, the NMS uses ifIndex numbers internally to consolidate interface data from multiple MIBs and associate this data with an interface name. The user can rely on the interface name and does not need to know the actual ifIndex number.
When you use the Cisco IOS CLI to configure the ML-Series card to generate traps directly, you do not have this associated name to use. You must use the actual ifIndex number for each interface being configured with a trap. To determine the actual ifIndex number, you can use an NMS to retrieve the ifIndex number of each ML-Series card interface and VLAN subinterface, or you can calculate the ifIndex number for the interface.
The user can also use a MIB browser (SNMP MIB definition lookup service) to examine the ifDescr for the appropriate ifIndex number. The ifIndex number from the ifDescr must be the ifIndex number for the desired port.
On an ML-Series card, the ifIndex number of Ethernet and POS interfaces is compiled from two pieces of information:
•
•
The slot and port are combined to form the ifIndex using the following formula:
ifIndex = (slot * 10000h) + (port)
10000h is the hexadecimal equivalent number of 65536. The resulting ifIndex is a meaningful two-part number in hexadecimal, but seems confusing and arbitrary in decimal. For example, ifIndex E0002h is Slot 14, Port 2. This same number in decimal notation is 917506. The rmon alarm command requires the ifindex number in decimal form.
As an additional reference for calculating the correct ifindex value to use with the rmon alarm command, Table 21-1 lists the base ifindex number for Slots 1 to 17. The desired port number can be added to the slot base number to quickly determine the correct ifIndex number.
Manually Checking CRC Errors on the ML-Series Card
Users can also check the current count of ML-Series card CRC errors on an interface by using the show interface command. The example shows six total input errors, which are all CRC errors, in the last line of the output.
ML_Series(config)# show interface pos 0
POS0 is up, line protocol is upHardware is Packet/Ethernet over Sonet, address is 0005.9a39.713e (bia 0005.9a39.713e)MTU 1500 bytes, BW 48384 Kbit, DLY 100 usec,reliability 255/255, txload 1/255, rxload 182/255Encapsulation: Cisco-EoS-LEX, crc 32, loopback not setKeepalive set (10 sec)Scramble enabledARP type: ARPA, ARP Timeout 04:00:00Last input never, output never, output hang neverLast clearing of "show interface" counters neverInput queue: 0/75/0/0 (size/max/drops/flushes); Total output drops: 0Queueing strategy: fifoOutput queue: 0/40 (size/max)5 minute input rate 34621000 bits/sec, 60083 packets/sec5 minute output rate 0 bits/sec, 0 packets/sec311190527 packets input, 931220183 bytesReceived 0 broadcasts (0 IP multicast)6 runts, 0 giants, 0 throttles0 parity6 input errors, 6 CRC, 0 frame, 0 overrun, 0 ignoredDisplaying RMON Status
Note
To display the RMON status, use one or more of the privileged EXEC commands in Table 21-3.
Example 21-1 shows examples of the commands in Table 21-3.
Example 21-1 CRC Errors Displayed with show rmon Commands
ML_Series# show rmon alarms
Alarm 9 is active, owned by config
Monitors ifInErrors.983043 every 300 second(s)
Taking delta samples, last value was 0
Rising threshold is 1000, assigned to event 10
Falling threshold is 1000, assigned to event 10
On startup enable rising or falling alarm
ML_Series# show rmon events
Event 10 is active, owned by config
Description is
Event firing causes log and trap to community slot15,
last event fired at 0y3w2d,00:32:39,
Current uptime 0y3w6d,03:03:12
Current log entries:
index uptime description
1 0y3w2d,00:32:39
![]()
![]()
![]()
![]()
![]()
![]()
![]()
![]()
Posted: Tue Sep 11 07:10:53 PDT 2007
All contents are Copyright © 1992--2007 Cisco Systems, Inc. All rights reserved.
Important Notices and Privacy Statement.