This preface describes who should read the Cisco SCA BB SNMP Real-Time Monitoring User Guide, how it is organized, and its document conventions.
|
Cisco Service Center Release |
Part Number |
Publication Date |
|---|---|---|
|
Release 3.0.5 |
OL-12491-01 |
November, 2006 |
Description of Changes
Created the Cisco SCA BB SNMP Real-Time Monitoring User Guide.
This guide is for experienced network administrators who are using Cisco Service Control and the SCA BB application to monitor and control their network.
The major sections of this guide are as follows:
|
Chapter |
Title |
Description |
|---|---|---|
|
Chapter 1 |
Provides an overview of MRTG and RRDTool, and how they are used to monitor a Cisco Service Control network. | |
|
Chapter 2 |
Explains the general procedure for real-time SNMP monitoring and also the general procedure for using the Cisco SCA BB real-time monitoring configuration utility. | |
|
Chapter 3 |
Explains specific procedures for using the Cisco SCA BB real-time monitoring configuration utility, | |
|
Chapter 4 |
Presents error messages and possible causes of the error. |
The following publications are available for the Cisco Service Control Application for Broadband:
Cisco Service Control Application for Broadband User Guide
Cisco Service Control Application for Broadband Reference Guide
Cisco Service Control Application for Broadband Service Configuration API Programmer Guide
This document uses the following conventions:
|
Convention |
Description |
|---|---|
|
boldface font |
Commands and keywords are in boldface. |
|
italic font |
Arguments for which you supply values are in italics. |
|
[ ] |
Elements in square brackets are optional. |
|
{x | y | z} |
Alternative keywords are grouped in braces and separated by vertical bars. |
|
[x | y | z] |
Optional alternative keywords are grouped in brackets and separated by vertical bars. |
|
string |
A nonquoted set of characters. Do not use quotation marks around the string, or the string will include the quotation marks. |
|
|
Terminal sessions and information that the system displays are in |
|
|
Information you must enter is in |
|
|
Arguments for which you supply values are in |
|
< > |
Nonprinting characters, such as passwords, are in angle brackets. |
|
[ ] |
Default responses to system prompts are in square brackets. |
|
!, # |
An exclamation point (!) or a pound sign (#) at the beginning of a line of code indicates a comment line. |
Note
Means reader take note. Notes contain helpful suggestions or references to materials not covered in this manual.
Caution
Means reader be careful. In this situation, you might do something that could result in loss of data.
The following sections provide sources for obtaining documentation from Cisco Systems.
You can access the most current Cisco documentation on the World Wide Web at the following sites:
Cisco documentation and additional literature are available in a CD-ROM package that ships with your product. The Documentation CD-ROM is updated monthly and may be more current than printed documentation. The CD-ROM package is available as a single unit or as an annual subscription.
Cisco documentation is available in the following ways:
Registered Cisco Direct Customers can order Cisco Product documentation from the networking Products MarketPlace:
Registered Cisco.com users can order the Documentation CD-ROM through the online Subscription Store:
Nonregistered Cisco.com users can order documentation through a local account representative by calling Cisco corporate headquarters (California, USA) at 408 526-7208 or, in North America, by calling 800 553-NETS(6387).
If you are reading Cisco product documentation on the World Wide Web, you can submit technical comments electronically. Click Feedback in the toolbar and select Documentation. After you complete the form, click Submit to send it to Cisco.
You can e-mail your comments to bug-doc@cisco.com.
To submit your comments by mail, use the response card behind the front cover of your document, or write to the following address:
Attn Document Resource Connection Cisco Systems, Inc. 170 West Tasman Drive San Jose, CA 95134-9883
We appreciate your comments.
Cisco provides Cisco.com as a starting point for all technical assistance. Customers and partners can obtain documentation, troubleshooting tips, and sample configurations from online tools. For Cisco.com registered users, additional troubleshooting tools are available from the TAC website.
Cisco.com is the foundation of a suite of interactive, networked services that provides immediate, open access to Cisco information and resources at any time, from anywhere in the world. This highly integrated Internet application is a powerful, easy-to-use tool for doing business with Cisco.
Cisco.com provides a broad range of features and services to help customers and partners streamline business processes and improve productivity. Through Cisco.com, you can find information about Cisco and our networking solutions, services, and programs. In addition, you can resolve technical issues with online technical support, download and test software packages, and order Cisco learning materials and merchandise. Valuable online skill assessment, training, and certification programs are also available.
Customers and partners can self-register on Cisco.com to obtain additional personalized information and services. Registered users can order products, check on the status of an order, access technical support, and view benefits specific to their relationships with Cisco.
To access Cisco.com, go to http://www.cisco.com.
The Cisco Technical Assistance Center (TAC) website is available to all customers who need technical assistance with a Cisco product or technology that is under warranty or covered by a maintenance contract.
If you have a priority level 3 (P3) or priority level 4 (P4) problem, contact TAC by going to the TAC website http://www.cisco.com/tac.
P3 and P4 level problems are defined as follows:
P3—Your network is degraded. Network functionality is noticeably impaired, but most business operations continue.
P4—You need information or assistance on Cisco product capabilities, product installation, or basic product configuration.
In each of the above cases, use the Cisco TAC website to quickly find answers to your questions.
To register for Cisco.com, go to http://tools.cisco.com/RPF/register/register.do.
If you cannot resolve your technical issue by using the TAC online resources, Cisco.com registered users can open a case online by using the TAC Case Open tool at http://www.cisco.com/tac/caseopen.
If you have a priority level 1 (P1) or priority level 2 (P2) problem, contact TAC by telephone and immediately open a case. To obtain a directory of toll-free numbers for your country, go to http://www.cisco.com/warp/public/687/Directory/DirTAC.shtml.
P1 and P2 level problems are defined as follows:
P1—Your production network is down, causing a critical impact to business operations if service is not restored quickly. No workaround is available.
P2—Your production network is severely degraded, affecting significant aspects of your business operations. No workaround is available.
SNMP-based monitoring tools, such as MRTG, allow network administrators to monitor the activity and health of network devices in real time. Cisco SCA BB includes an SNMP-based real-time monitoring solution, which is implemented using MRTG and a Round Robin Database (RRDTool).
The SCA BB Real-Time Monitoring Configuration Utility (rtmcmd) is a command-line utility (CLU) for automating the production of the files required by the MRTG tool.
The Multi Router Traffic Grapher (MRTG) is a tool that monitors the traffic load on network links by monitoring specified SNMP counters. It generates HTML pages containing images that provide real-time visual representation of this traffic, allowing the user to see traffic load on a network over time in graphical form. The SCE platform running the SCA BB application provides numerous SNMP counters that can be used to produce reports.
Round Robin Database Tool (RRDTool) stores and displays time-series data. The data is stored in a round-robin database so that the system storage footprint remains constant over time. This tool is used in conjunction with MRTG to produce higher-quality graphics.
Refer to the following links for MRTG and RRDTool documentation and download:
MRTG web page: http://www.mrtg.org/
RRDTool web page: http://www.rrdtool.org/
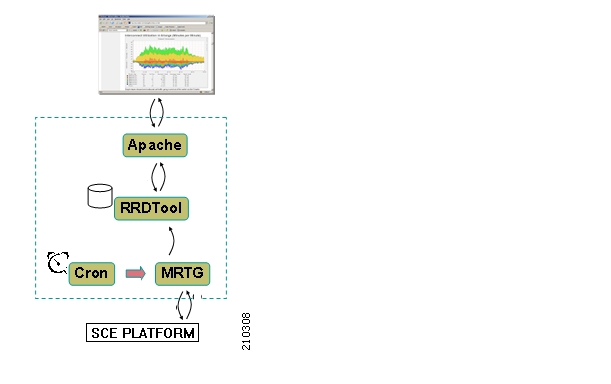
Following are the components of an MRTG / RRDTool monitoring system:
MRTG is a script that collects SNMP data from monitored devices. It monitors SNMP network devices and stores the retrieved data in a database. It is written in Perl and works on Unix/Linux and Windows.
MRTG is free software licensed under the Gnu GPL. It requires the following:
Perl
RRDTool to persist data and to generate high quality graphs
The MRTG CFG file lists the SNMP OIDs of the SNMP counters that MRTG should poll.
RRDTool stores data and generates charts. RRDTool uses Round Robin Database to store time-series data, and generates charts using this data.
RRDTool is a free software licensed under the Gnu GPL. It requires the following:
A web server to delegate user requests to the RRDTool's CGI interpreter
RRDTool CGI files implement the report web pages. These files are executable scripts residing on the web server. When you request a report web page, RRDTool executes the script and dynamically creates the updated chart.
Cron (or any other scheduling service) periodically invokes MRTG to poll SNMP counters from monitored devices.
Apache (or any other web server) serves the charts to the user web browser.
Cisco Service Control platforms support MIBs counters that are monitored by MRTG.
The following diagram illustrates the components of a real-time SNMP monitoring system in action:
Refer to the following links for RTM software components documentation and download:
PyCron (for windows setups): http://www.kalab.com/freeware/pycron/pycron.htm
ActivePerl (for running MRTG): http://www.activestate.com/Products/ActivePerl/
Apache Web-Server: http://httpd.apache.org/download.cgi
MRTG and RRDTool each require configuration files containing the information necessary for creating the reports, such as the OIDs of the relevant SNMP counters. To simplify the process of creating and maintaining MRTG configuration files and RRDTool CGI report files, Cisco SCA BB provides the following:
A set of templates for creating MRTG CFG files and RRDTool CGI files that implement pre-defined reports based on SCE and SCA BB MIBs. These templates cannot be used as is, and must first be processed to reflect the specific Service Configuration to be monitored.
A software tool,
rtmcmd, that processes the templates into CFG and CGI files, according to the specified SCA BB Service Configuration and SCE platform hostname or IP address.
The following table lists the available Cisco Service Control pre-defined SNMP based reports.
Table 1.1. Pre-defined SCA BB Real-Time Monitoring Reports
|
# |
Report Title |
|---|---|
|
SCA BB Reports | |
|
1 |
Link 1 Global Downstream BW per Service |
|
2 |
Link 1 Global Upstream BW per Service |
|
3 |
Link 2 Global Downstream BW per Service |
|
4 |
Link 2 Global Upstream BW per Service |
|
5 |
Total Global Downstream BW per Service |
|
6 |
Total Global Upstream BW per Service |
|
7 |
Global Active Subscribers per Service |
|
8 |
Global Concurrent Sessions per Service |
|
9 |
Global Concurrent Voice Calls |
|
SCE Operational Reports | |
|
10 |
Log Counters |
|
11 |
Active Flows per Traffic Processor |
|
12 |
Traffic Processors Average Utilization |
|
13 |
Flow Open Rate per Traffic Processor |
|
14 |
Packets Rate per Traffic Processor |
|
15 |
Subscriber Counters |
|
16 |
RDR Counters |
|
17 |
Downstream Bandwidth per TX Queue |
|
18 |
Upstream Bandwidth per TX Queue |
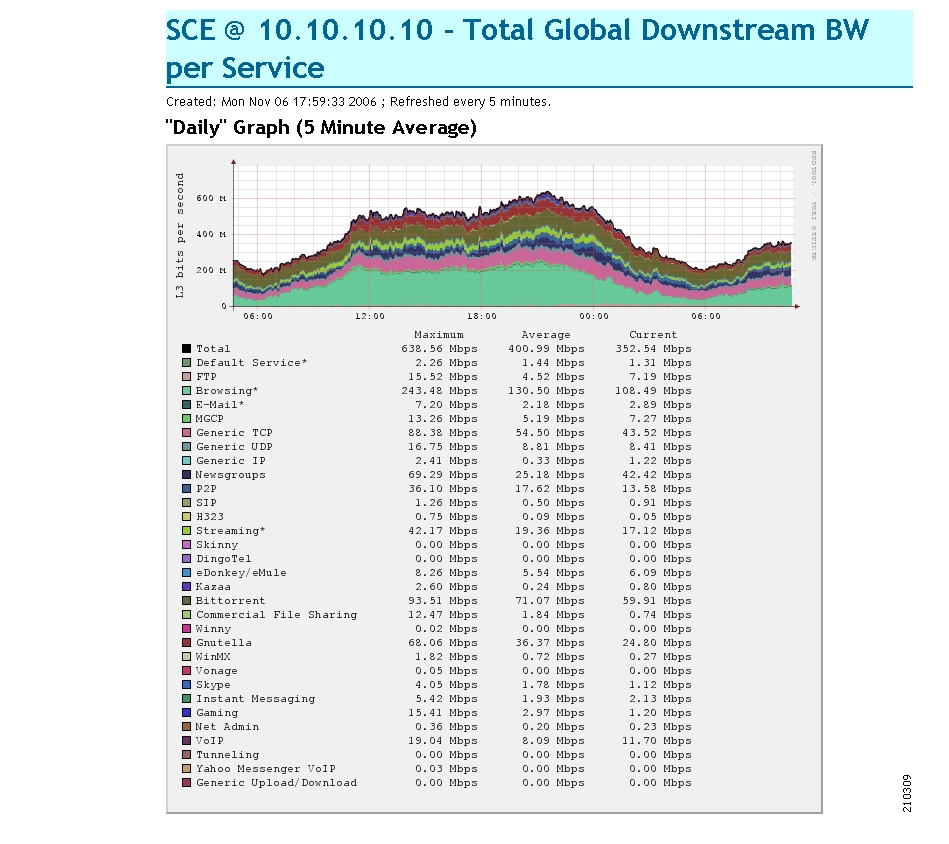
Note the following general information regarding charts:
Each report is actually made of the following four charts, representing different time scales. These charts are based on the round robin archives for each SNMP counter (the archives are created by MRTG).
Daily (5-minute average)
Weekly (30-minute average)
Monthly (2-hour average)
Yearly (1-day average)
The legend items for each graph item (including the total item) include the following information for each item:
Average value
Maximum value
Current value
The data in each chart is a series of average values (a series of 5-minute-average values for the daily chart, 30-minute-average for the weekly chart, and so on)
Maximum value items do not show the actual highest value of the monitored counter in each period, but rather the highest average value in the series, which is likely to be lower than the actual maximum value.
The colors of the chart items are taken from a pre-defined, non-configurable set of colors.
The following diagram shows a report example.
An RTM setup requires the installation of the components described in Components of SNMP RTM with MRTG and RRDTool and can be set up on either Windows or Unix/Linux servers.
The Getting Started section provides a step by step description how to set up a SCA BB RTM system.
SCA BB RTM system requires MRTG version 2.14 and RRDTool version 1.2. Consult the MRTG web site for the exact required Perl version.
Cisco has tested SCA BB RTM systems on the following setups:
Windows 2000/XP using Apache v2.2 and PyCron v0.5
Linux Red-Hat 3 and Red-Hat 4.
To view a report, RTM users browse to a URL mapped to a designated directory on their web server. This designated directory is referred to as the RTM directory. Users are required to create the RTM directory under the web server web documents directory tree; for example, when using an Apache web server on a Windows system, the RTM directory might be located at C:/PROGRA~1/APACHE~1/Apache2.2/htdocs/rtm. Upon completion of an RTM setup installation (see Getting Started), the SCA BB RTM directory contains the following sub-directories and files:
An
mrtg-cfgfolder containing an MRTG CFG file for each monitored SCE platform. The CFG file names have the following pattern <SCE IP/Host-name>_scabb_mrtg.cfg.A directory for each SCE named
sce_<SCE IP/Host-name>. These directories contain the Report CGI files and the RRDTool archives after the first invocation of MRTG.A static folder containing common, invariant files such as CSS and image files.
A
.htaccessfile (Apache web server only). This file is used to exclude files or folders from the automatic listings of the RTM directory.
To produce graphics to monitor your network in real time using MRTG and RRDTool, follow these general steps:
Install MRTG (requires Perl installation) and RRDTool
Install Cron or any other scheduling service
Install a web server. Configure the web server to allow CGI script execution and directories automatic listings. See Web Server Configuration.
Create the RTM directory under the web server web documents directory tree. See The RTM Directory.
For each SCE device that you want to monitor, create the necessary CFG and CGI files. The CFG and CGI files reflect the service configuration applied to the monitored SCE devices. Cisco Service Control provides a utility to automatically create the files necessary to produce a range of pre-defined reports (see Using the SCA BB Real-Time Monitoring Configuration Utility and The Real-Time Monitoring Configuration Utility).
Install the MRTG CFG and Report CGI files on the RTM setup.
Configure the cron job to periodically invoke MRTG on the MRTG CFG files created for each SCE device.
Monitor the reports using a web browser.
Browse to the root of the RTM directory and select an SCE device.
Select a report from the available reports listed on the left. The following figure is a screenshot taken after selecting an SCE device.

This guide focuses on Step 5, creating the CFG and CGI files for MRTG and RRDTool. The SCA BB Real-Time Monitoring Configuration utility creates the necessary files from the specified PQB file or Service Configuration.
The other steps in this process are explained in detail in the relevant MRTG and RRDTool documentation (see References).
The web server configuration should be such that it enables the following two common web server features:
Execution of CGI scripts—Reports are created on demand by browsing to a CGI script file that dynamically creates the report HTML page.
Enable automatic listings of directories when there is no directory index (e.g. index.html)—Enabling this feature enables listing of the SCE platforms for which MRTG CFG file and report CGI files have been prepared.
Note that these features can be selectively enabled for the RTM directory only.
The following configuration instructions for the Apache Web Server reflect the general guidelines provided in the Web Server Configuration section.
Add a directory section for the RTM directory to the Apache configuration file
httpd.conf. Use the following example as a template for the newly created section:<Directory "<Apache installation directory>/htdocs/<rtm directory>"> Options Indexes FollowSymLinks ExecCGI AllowOverride Indexes Order allow,deny Allow from all </Directory>Restart the Apache Web Server
To use rtmcmd to produce the files for MRTG and RRDTood, follow this procedure:
If using
rtmcmdfor the first time, do the following:Install it (see Installing the Real-Time Monitoring Configuration Utility)
Extract the templates distribution to a directory (see Installing the Real-Time Monitoring Configuration Utility)
Prepare a destination directory where the utility will save the CFG and CGI files. It is recommended that this directory will be different to the RTM folder where the CFG and CGI files will be installed.
Edit the user configuration file according to your setup (see The User Configuration File). A sample configuration file (
rtmcmf.cfg) is located in the bin directory under the utility installation directory.(This step may not be required each time you run the utility if the directory locations have not been changed.)
Run
rtmcmd,using the appropriate options and point it to the directories and configuration file you have prepared (see The rtmcmd Utility).rtmcmdwrites the files to the specified destination directory. The destination directory contains:A sub-directory for each SCE platform containing CGI report files, the index HTML file, and the reports index HTML file.
A sub-directory for MRTG CFG files containing an MRTG CFG file for each SCE device.
Sample files for the configuration of the Cron application. There is one sample file for Windows and one sample file for Unix/Linux.
A static directory containing CSS and image files.
A
.htaccessfile—When using the Apache web server, this file is used to exclude files or folders from the automatic listings of a directory.
The resulting CFG files are compatible with the SCA BB and SCE MIBs of releases 3.0.5 and above.
If
rtmcmdfails, an error log is available at the following locations:Linux: "<USERPROFILE>/.p-cube/servconf.log"
Windows: "<user folder>\.p-cube\servconf.log".
Install these CFG and CGI files into your RTM setup (see Installing the CFG and CGI Files for Use by MRTG and RRD).
To install the SCA BB rtmcmd utility and RTM report templates, complete the following steps:
Locate the file
scas_bb_util.tgz(located in the SCA BB distribution zip file), and copy it to a Windows or Linux workstation.Unpack the file to a new folder.
The SCA BB Real-Time Monitoring Configuration Utility,
rtmcmd, is located under the bin folder.Locate the file
scasbb_rtm_templates.zip(located in the SCA BB distribution zip file), and copy it to a Windows or Linux workstation.Unpack the file to a new folder.
rtmcmd requires Java Runtime Environment (JRE) version 1.4 or 1.5.
The JRE can be downloaded from the Sun™ website, at: http://java.sun.com/j2se/1.4.2/download.html
To verify that the JRE is installed, run java -version from the command prompt; the Java version should start with 1.4 or 1.5.
If a different version of JRE is also installed on the workstation, you may need to tell servconf where to find the appropriate JRE by setting the JAVA_HOME environment variable to point to the JRE 1.4 installation directory. For example:
JAVA_HOME=C:\Program Files\Java\j2re1.4.2_08The Real-Time Monitoring Configuration Utility (rtmcmd) is a Cisco Service Control software tool for processing the SCA BB report templates into the appropriate CFG and CGI files.
rtmcmd is
A Java command-line utility
Based on the SCA BB Service Configuration Java API
Can be used on both Windows and Linux platforms (provided with appropriate shell scripts)
Compatible with SCA BB release 3.0.5 and above. The resulting CFG files are compatible with the SCA BB and SCE MIBs of releases 3.0.5 and above.
The utility expects the following arguments:
The current Service Configuration from either of these sources:
A specified PQB file
A specified SCE platform from which to retrieve the Service Configuration. Using this option requires you to specify a username and password.
The IP address or host name of the SCE platform from which SNMP data is collected
The directory location of the report templates
The target directory where the resulting CFG and CGI files should be saved. This is a temporary target location.
The location of the user configuration file containing the information required for processing the report templates.
The utility compiles the templates and the PQB file into the actual CFG and CGI files required by MRTG and RRDTool, and stores the results in the specified target directory.
The command-line syntax of the SCA BB Real-Time Monitoring Configuration Utility is:
rtmcmd --sce<SCE addresses>{--file<PQB filename>| (--pqb-sce<SCE address> --username<username>--password<password>)}--source-dir<dir>--dest-dir<dir>--config-file<file>
The following table lists the rtmcmd options.
Table 3.1. rtmcmd Options
|
Option |
Abbreviation (if applicable) |
Description |
|---|---|---|
|
--sce <SCE IP addresses> |
-S |
(Required) IP addresses of one or more SCE platforms from which SNMP data is collected. Each IP address must be a valid SCE platform IP address or SCE hostname. Enclose multiple addresses in quotation marks, separated by a semicolon. For example: --sce "10.1.2.3;10.1.2.4;10.1.2.5" |
|
--file <PQB filename> |
-f |
(Required if an SCE to retrieve from is not specified) The PQB file to use. |
|
--pqb-sce <SCE address> |
-q |
(Required if a PQB file is not specified) Hostname or IP addresses of the SCE platform from which the Service Configuration should be retrieved. |
|
--username <username> |
-U |
(Required if an SCE to retrieve from is specified) Username for connecting to the SCE platform to retrieve the Service Configuration. |
|
--password <password> |
-P |
(Required if username is specified) Password for connecting to the SCE platform to retrieve the Service Configuration. |
|
--source-dir <dir> |
-s |
(Required) Template files location. |
|
--dest-dir <dir> |
-d |
(Required) Target directory where the processed templates should be stored. |
|
--config-file <file> |
-c |
(Required) The user configuration file (see The User Configuration File). |
Additional operations can be invoked to display information about the Real-Time Monitoring Configuration Utility using the following syntax:
rtmcmd <operation>The following table lists these additional rtmcmd operations.
Table 3.2. rtmcmd Operations
|
Operation |
Description |
|---|---|
|
--version |
Display RTMCMD version |
|
--help |
Display RTMCMD help |
Create report and configuration files for the specified SCE platforms. Load the Service Configuration file from a local file:
rtmcmd --sce="63.111.106.7;63.111.106.12" --file=servicecfg.pqb
         --source-dir=/rtm-templates --dest-dir=/rtm-output
         -c ./rtmcmd.cfg
Create report and configuration files for the specified SCE platforms. Retrieve a Service Configuration file from the specified SCE.
rtmcmd -S "63.111.106.7;63.111.106.12" -U user123 -P ****
         --pqb-sce=63.111.106.7 --source-dir=/rtm-templates
         --dest-dir=/rtm-output -c ./rtmcmd.cfg
The user configuration file contains user-specific information required by the rtmcmd utility. The SCA BB utilities distribution package contains a sample configuration file, named "rtmcmd.cfg". You should edit this file according to the details of your setup.
The following table lists the configuration parameters that should be present in the user configuration file:
Table 3.3. User Configuration File Parameters
|
Parameter |
Description |
Default Value |
Required/ Optional |
|---|---|---|---|
|
rrdtool_bin_dir |
An absolute path to the directory where rrdtool and rrdcgi binary files are installed |
|
Required |
|
rtm_dir |
An absolute path to the directory where RRD archives and CGI files are stored. This is under the web server web directory. |
|
Required |
|
mrtg_bin_dir |
An absolute path to the directory where MRTG binary files are installed. This location will be used to create MRTG invocation commands in the crontab sample file. |
|
Required |
|
snmpCommunityString |
The SNMP community string to use when accessing the SCE platforms. |
Public |
Required |
The following is an example rtmcmd user configuration file:
#The absolute path to the RRD tool's execution files folder
#Use '\\' or '/' as path separator
rrdtool_bin_dir=C:/rrdtool-1.2.15/rrdtool/Release

#The absolute path where RTM files will be placed.
#This path will be used by MRTG to create and update the RRD files
#Note: path must not contain white spaces!
rtm_dir=C:/PROGRA~1/APACHE~1/Apache2.2/htdocs

#The absolute path to the MRTG bin folder.
#This path will be used to create file crontab.txt
mrtg_bin_dir=C:/mrtg-2.14.5/bin

#The SCE's community string
snmpCommunityString=publicThe configuration text file is a listing of key-value pairs, where the key is one of the parameters listed in the User Configuration File section, in the following format:
Each key-value pair is on a separate line.
A key-value pair may be extended across several adjacent lines by putting a backslash character, "\", at the end of each line.
To use an actual backslash in the value (as in directory names on Windows), the backslash should be escaped with another backslash, like this: "\\", or a slash "/" can be used instead.
To comment a line, add '#' or '!' at the beginning of the line.
For example:
# This is a comment line.
# Directory names should uses escape backslashes:
rtm_dir=D:\\PROGRA~1\\APACHE~1\\Apache2.2\\htdocsThe real-time monitoring process requires that you specify a number of files and directories. Following is a brief summary of all relevant files and directories and where you must specify them:
User configuration file:
rrdtool_bin_dir—Directory where MRTG and the web server will find the RRDTool binary files
rtm_dir—The RTM directory is where MRTG will create and update the RRDTool archive files. It is recommended that the target directory provided to the
rtmcmdwill be different to the RTM directory. Afterrtmcmdcompletes the templates processing, you will be required to copy the CFG and CGI files to the RTM directory (see Installing the CFG and CGI Files for Use by MRTG and RRD). See also SCA BB Real Time Monitoring Setup.mrtg_bin_dir—The location where MRTG binary files are installed. This location is used to create the MRTG invocation commands written to the crontab sample file.
rtmcmd:source directory—The location where
rtmcmdwill find the report templatesdestination directory—The location where
rtmcmdwill save the CFG and CGI files that it creates.After you run
rtmcmd,you must move the generated files from this location to the appropriate MRTG and RRDTool directories.config-file—The location and filename of the user configuration file referred to above.
Service Configuration—The location and name of the PQB file. The Service Configuration may alternatively be retrieved from a specified SCE platform.
After the CFG and CGI files have been created by the rtmcmd utility, you must install them into your RTM setup.
If this is a fresh installation of an RTM setup complete the following steps:
Copy the entire contents of the target directory created by
rtmcmd, including all sub-directories, to the RTM directory. The RTM directory is specified by the rtm_dir property in the rtmcmd user configuration file. The two crontab.txt sample files should be excluded from the copy operation.Add a Cron task that invokes MRTG periodically (every 5 minutes) on these CFG files, by adding a task line to the crontab file. On Windows workstations the line should look something like this:
*/5 * * * * <Full path to the Perl bin directory>\wperl.exe <Full path to the MRTG bin directory>\mrtg <RTM directory>\mrtg-cfg\<SCE address>_scabb_mrtg.cfg(The exact details of working with Cron are outside the scope of this document.)
rtmcmdcreates two crontab.txt sample files for Windows and for Linux/Unix setups in the destination directory. Use these files to configure Cron.Note that for Unix/Linux systems, the periodic MRTG invocation command must be followed by an update permission command (chmod) for RRD files providing reading permissions to the web server. For the command details, see the crontab sample file created by the
rtmcmdutility.
Note
When using SELinux (which is a standard feature of Redhat Enterprise 4), several extra steps might be needed to ensure correct operation of the Apache server. A full discussion of this issue is beyond the scope of this document, but note the following command which would be useful in case SELinux is activated and the system log indicates that httpd encounters permission problems: chcon -R -h -t httpd_sys_content_t <RTM directory>
Note that the polling done by MRTG creates a CPU load on both the workstation where MRTG is running, and on the SCE platform. Therefore, the following is recommend:
Polling period of once every 5 minutes
Maximum number of SCE platforms polled by a single workstation (assuming a Win2K machine, with Pentium 4, 3.2GHz CPU, and 1GB memory) is 10 SCE platforms
The rtmcmd utility is used to create an updated set of MRTG configuration files and report CGI files when:
Adding a new SCE device to the RTM setup.
A change in the Service Configuration applied to some SCE devices should be reflected in the reports.
To update your RTM directory perform the following steps:
Copy the newly created MRTG CFG files from the mrtg-cfg directory in the rtmcmd target directory to the mrtg-cfg directory within the RTM directory. The RTM directory is the same location as specified by the rtm_dir property in the user configuration file.
Add a Cron task that invokes MRTG periodically (every 5 minutes) on these CFG files, by adding a task line to the crontab file. This operation is described in detail in Step 2 of the First Installation section.
Update the report CGI files—Copy the updated CGI files from the SCE folder created in the rtmcmd target directory to the appropriate directory in the RTM directory. You can copy the entire SCE folder if this SCE device has not been monitored before.
Problem
Apparent Error Message: viewing a report returns with an error message Error opening <RRD archive name>.rrd: No such file or directory.
Cause and Solution
MRTG did not create RRD DB files. Verify that your <RTM Folder>/sce_<SCE IP> does not contain *.rrd files.
There are two possible reasons that MRTG did not create the RRD DB files:
MRTG execution failed and you should check the following settings are correct:
Verify the SCE is accessible, e.g. ping.
Verify the SCE SNMP agent is enabled.
Verify the SCE community string is configured correctly in the RTM user configuration file.
Verify the RTM directory is configured correctly in the user configuration file. The path cannot contain white space.
NoteUse slash or '\\' as the path delimiter.Verify the RRDTool bin directory is configured correctly in the user configuration file.
NoteUse slash or '\\' as the path delimiter.Run MRTG from a command prompt and verify that it completes with no errors:
perl<MRTG bin folder>/mrtg <RTM folder>/mrtg-cfg/<SCEaddress>_scabb_mrtg.cfg
Cron did not invoke MRTG
Verify Cron is configured correctly—Check the MRTG invocation command for the specific SCE platform is correct.
If using PyCron, try running MRTG from PyCron GUI and verify it completes with return code 0
Problem
Apparent Error Message: viewing a report returns with an error message The server encountered an internal error or misconfiguration and was unable to complete your request.
Cause
This error message appears on Unix/Linux systems if the web server user does not have execution permissions on the SCE platform's report CGI files.
Solution
Add execution permissions to all users to all .cgi files.
Problem
Apparent Error Message: viewing a report returns with an error message ERROR: Opening '<report image filename>.png' for write: Permission denied.
Cause
This error message appears on Unix/Linux systems if the web server user does not have writing permissions on the SCE platform's directory in the RTM directory.
Solution
Add write permissions to all users to all SCE directories in the RTM directory.
Problem
Cause
This error message appears on Unix/Linux systems if the web server user does not have reading permissions on RRD archive files in the SCE platform's directory.
Apparent Error Message: viewing a report returns with an error message ERROR: opening '<RRD archive name>.rrd': Permission denied.
Solution
Add read permissions to all users to all RRD archive files. Note that the example crontab.txt file created by the rtmcmd for Unix/Linux systems contains a permissions change command for each monitored SCE. The permissions change command follows the MRTG invocation.
Problem
Reports missing data. There is a sheer drop in reported traffic.
Cause and Solution
Cron has stopped invoking MRTG
Verify the *.rrd files in the folder sce_<SCE IP> haven’t been modified during the past 5 minutes.
Verify Cron is configured as a service and that the service active.
Run MRTG from a command line and verify that it completes with no errors.
perl <MRTG bin folder>/mrtg <RTM folder>/mrtg-cfg/<SCE address>_scabb_mrtg.cfg
Check that Cron settings are correct, see Error Message when Viewing a Report.