- Preface
- 1. General Overview
- 2. System Overview
- 3. Using the SCA Reporter
- 4. Defining Reports
- 5. Working with Reports
- 6. The SCA Reporter Command-Line Interface
- A. Installing and Upgrading SCA Reporter Templates
- B. Troubleshooting
- C. The SCA Reporter as a Tool in the SCA BB Console
- D. SCA Reporter Templates
This preface describes who should read the Cisco Service Control Application Reporter User Guide, how it is organized, and its document conventions.
|
Cisco Service Control Release |
Part Number |
Publication Date |
|---|---|---|
|
Release 3.0.5 |
OL-8411-03 |
November, 2006 |
Description of Changes
Editorial changes only
|
Cisco Service Control Release |
Part Number |
Publication Date |
|---|---|---|
|
Release 3.0.3 |
OL-8411-02 |
May, 2006 |
Description of Changes
Updated Online Help
Added Troubleshooting Section
Added Glossary
|
Release 3.0.0 |
OL-8411-01 |
December, 2005 |
This guide is intended for experienced network administrators who are responsible for generating reports of the daily operation using the Cisco Service Control Application Reporter (SCA Reporter).
This guide is organized as follows:
|
Chapter |
Title |
Description |
|---|---|---|
|
Chapter 1 |
Provides a brief overview of the Cisco Service Control solution and describes the components of the system. | |
|
Chapter 2 |
Provides an introduction to the Cisco Service Control Application Reporter, explains some basic concepts, and provides instructions on how to install and launch the SCA Reporter. It also provides Basic terminology and a Quick Start section. | |
|
Chapter 3 |
Describes basic and advanced configuration of the SCA Reporter. It also describes how to navigate in the GUI. | |
|
Chapter 4 |
Describes the features of the SCA Reporter, including creating a new report, generating a report, modifying an existing report, and deleting a report. | |
|
Chapter 5 |
Describes the available actions for the SCA Reporter, including viewing and adjusting the chart display. | |
|
Chapter 6 |
Explains how to use the SCA Reporter Command-Line Interface to generate reports. | |
|
Appendix A |
Describes how to install and upgrade SCA Reporter templates. | |
|
Appendix B |
Describes SCA Reporter error messages, and their probable causes and solutions. | |
|
Appendix C |
Describes the SCA Reporter as a tool in the SCA BB Console. | |
|
Appendix D |
Describes the report parameters of the SCA Reporter templates, organized by template groups. |
The following publications are available for the Cisco Service Control Application Reporter:
Cisco Service Control Application for Broadband User Guide
Cisco Service Control Application for Broadband Reference Guide
Cisco Service Control Management Suite Collection Manager User Guide
The following publications may also be useful:
The SCE platform installation and configuration guides:
Cisco SCE 1000 2xGBE Installation and Configuration Guide
Cisco SCE 2000 4xGBE Installation and Configuration Guide
Cisco SCE 2000 4/8xFE Installation and Configuration Guide
Cisco Service Control Engine (SCE) CLI Command Reference
This document uses the following conventions:
|
Convention |
Description |
|---|---|
|
boldface font |
Commands and keywords are in boldface. |
|
italic font |
Arguments for which you supply values are in italics. |
|
[ ] |
Elements in square brackets are optional. |
|
{x | y | z} |
Alternative keywords are grouped in braces and separated by vertical bars. |
|
[x | y | z] |
Optional alternative keywords are grouped in brackets and separated by vertical bars. |
|
string |
A nonquoted set of characters. Do not use quotation marks around the string, or the string will include the quotation marks. |
|
|
Terminal sessions and information that the system displays are in |
|
|
Information you must enter is in |
|
|
Arguments for which you supply values are in |
|
< > |
Nonprinting characters, such as passwords, are in angle brackets. |
|
[ ] |
Default responses to system prompts are in square brackets. |
|
!, # |
An exclamation point (!) or a pound sign (#) at the beginning of a line of code indicates a comment line. |
Note
Means reader take note. Notes contain helpful suggestions or references to materials not covered in this manual.
Caution
Means reader be careful. In this situation, you might do something that could result in loss of data.
The following sections provide sources for obtaining documentation from Cisco Systems.
You can access the most current Cisco documentation on the World Wide Web at the following sites:
Cisco documentation and additional literature are available in a CD-ROM package that ships with your product. The Documentation CD-ROM is updated monthly and may be more current than printed documentation. The CD-ROM package is available as a single unit or as an annual subscription.
Cisco documentation is available in the following ways:
Registered Cisco Direct Customers can order Cisco Product documentation from the networking Products MarketPlace:
Registered Cisco.com users can order the Documentation CD-ROM through the online Subscription Store:
Nonregistered Cisco.com users can order documentation through a local account representative by calling Cisco corporate headquarters (California, USA) at 408 526-7208 or, in North America, by calling 800 553-NETS(6387).
If you are reading Cisco product documentation on the World Wide Web, you can submit technical comments electronically. Click Feedback in the toolbar and select Documentation. After you complete the form, click Submit to send it to Cisco.
You can e-mail your comments to bug-doc@cisco.com.
To submit your comments by mail, use the response card behind the front cover of your document, or write to the following address:
Attn Document Resource Connection Cisco Systems, Inc. 170 West Tasman Drive San Jose, CA 95134-9883
We appreciate your comments.
Cisco provides Cisco.com as a starting point for all technical assistance. Customers and partners can obtain documentation, troubleshooting tips, and sample configurations from online tools. For Cisco.com registered users, additional troubleshooting tools are available from the TAC website.
Cisco.com is the foundation of a suite of interactive, networked services that provides immediate, open access to Cisco information and resources at any time, from anywhere in the world. This highly integrated Internet application is a powerful, easy-to-use tool for doing business with Cisco.
Cisco.com provides a broad range of features and services to help customers and partners streamline business processes and improve productivity. Through Cisco.com, you can find information about Cisco and our networking solutions, services, and programs. In addition, you can resolve technical issues with online technical support, download and test software packages, and order Cisco learning materials and merchandise. Valuable online skill assessment, training, and certification programs are also available.
Customers and partners can self-register on Cisco.com to obtain additional personalized information and services. Registered users can order products, check on the status of an order, access technical support, and view benefits specific to their relationships with Cisco.
To access Cisco.com, go to http://www.cisco.com.
The Cisco Technical Assistance Center (TAC) website is available to all customers who need technical assistance with a Cisco product or technology that is under warranty or covered by a maintenance contract.
If you have a priority level 3 (P3) or priority level 4 (P4) problem, contact TAC by going to the TAC website http://www.cisco.com/tac.
P3 and P4 level problems are defined as follows:
P3—Your network is degraded. Network functionality is noticeably impaired, but most business operations continue.
P4—You need information or assistance on Cisco product capabilities, product installation, or basic product configuration.
In each of the above cases, use the Cisco TAC website to quickly find answers to your questions.
To register for Cisco.com, go to http://tools.cisco.com/RPF/register/register.do.
If you cannot resolve your technical issue by using the TAC online resources, Cisco.com registered users can open a case online by using the TAC Case Open tool at http://www.cisco.com/tac/caseopen.
If you have a priority level 1 (P1) or priority level 2 (P2) problem, contact TAC by telephone and immediately open a case. To obtain a directory of toll-free numbers for your country, go to http://www.cisco.com/warp/public/687/Directory/DirTAC.shtml.
P1 and P2 level problems are defined as follows:
P1—Your production network is down, causing a critical impact to business operations if service is not restored quickly. No workaround is available.
P2—Your production network is severely degraded, affecting significant aspects of your business operations. No workaround is available.
This chapter provides a general overview of the Cisco Service Control solution. It introduces the Cisco Service Control concept and the Service Control capabilities. It also briefly describes the hardware capabilities of the Service Control Engine (SCE) platform and the Cisco specific applications that together compose the total Cisco Service Control solution.
The Cisco Service Control solution is delivered through a combination of purpose-built hardware and specific software solutions that address various service control challenges faced by service providers. The SCE platform is designed to support classification, analysis, and control of Internet/IP traffic.
Service Control enables service providers to create profitable new revenue streams while capitalizing on their existing infrastructure. With the power of Service Control, service providers have the ability to analyze, charge for, and control IP network traffic at multigigabit wire line speeds. The Cisco Service Control solution also gives service providers the tools they need to identify and target high-margin content-based services and to enable their delivery.
As the downturn in the telecommunications industry has shown, IP service providers’ business models need to be reworked to make them profitable. Having spent billions of dollars to build ever larger data links, providers have incurred massive debts and faced rising costs. At the same time, access and bandwidth have become commodities where prices continually fall and profits disappear. Service providers have realized that they must offer value-added services to derive more revenue from the traffic and services running on their networks. However, capturing real profits from IP services requires more than simply running those services over data links; it requires detailed monitoring and precise, real-time control and awareness of services as they are delivered. Cisco provides Service Control solutions that allow the service provider to bridge this gap.
Service providers of any access technology (DSL, cable, mobile, and so on) targeting residential and business consumers must find new ways to get maximum leverage from their existing infrastructure, while differentiating their offerings with enhanced IP services.
The Cisco Service Control Application for Broadband adds a new layer of service intelligence and control to existing networks that can:
Report and analyze network traffic at subscriber and aggregate level for capacity planning
Provide customer-intuitive tiered application services and guarantee application SLAs
Implement different service levels for different types of customers, content, or applications
Identify network abusers who are violating the Acceptable Use Policy
Identify and manage peer-to-peer, NNTP (news) traffic, and spam abusers
Enforce the Acceptable Use Policy (AUP)
Integrate Service Control solutions easily with existing network elements and BSS/OSS systems
The core of the Cisco Service Control solution is the purpose-built network hardware device: the Service Control Engine (SCE). The core capabilities of the SCE platform, which support a wide range of applications for delivering Service Control solutions, include:
Subscriber and application awareness—Application-level drilling into IP traffic for real-time understanding and controlling of usage and content at the granularity of a specific subscriber.
Subscriber awareness—The ability to map between IP flows and a specific subscriber in order to maintain the state of each subscriber transmitting traffic through the SCE platform and to enforce the appropriate policy on this subscriber’s traffic.
Subscriber awareness is achieved either through dedicated integrations with subscriber management repositories, such as a DHCP or a Radius server, or via sniffing of Radius or DHCP traffic.
Application awareness—The ability to understand and analyze traffic up to the application protocol layer (Layer 7).
For application protocols implemented using bundled flows (such as FTP, which is implemented using Control and Data flows), the SCE platform understands the bundling connection between the flows and treats them accordingly.
Application-layer, stateful, real-time traffic control—The ability to perform advanced control functions, including granular BW metering and shaping, quota management, and redirection, using application-layer stateful real-time traffic transaction processing. This requires highly adaptive protocol and application-level intelligence.
Programmability—The ability to quickly add new protocols and easily adapt to new services and applications in the ever-changing service provider environment. Programmability is achieved using the Cisco Service Modeling Language (SML).
Programmability allows new services to be deployed quickly and provides an easy upgrade path for network, application, or service growth.
Robust and flexible back-office integration—The ability to integrate with existing third-party systems at the Service Provider, including provisioning systems, subscriber repositories, billing systems, and OSS systems. The SCE provides a set of open and well-documented APIs that allows a quick and robust integration process.
Scalable high-performance service engines—The ability to perform all these operations at wire speed.
The SCE family of programmable network devices is capable of performing application-layer stateful-flow inspection of IP traffic, and controlling that traffic based on configurable rules. The SCE platform is a purpose-built network device that uses ASIC components and RISC processors to go beyond packet counting and delve deeper into the contents of network traffic. Providing programmable, stateful inspection of bidirectional traffic flows and mapping these flows with user ownership, the SCE platforms provide real-time classification of network usage. This information provides the basis of the SCE platform advanced traffic-control and bandwidth-shaping functionality. Where most bandwidth shaper functionality ends, the SCE platform provides more control and shaping options, including:
Layer 7 stateful wire-speed packet inspection and classification
Robust support for over 600 protocols and applications, including:
General—HTTP, HTTPS, FTP, TELNET, NNTP, SMTP, POP3, IMAP, WAP, and others
P2P file sharing—FastTrack-KazaA, Gnutella, BitTorrent, Winny, Hotline, eDonkey, DirectConnect, Piolet, and others
P2P VoIP—Skype, Skinny, DingoTel, and others
Streaming and Multimedia—RTSP, SIP, HTTP streaming, RTP/RTCP, and others
Programmable system core for flexible reporting and bandwidth control
Transparent network and BSS/OSS integration into existing networks
Subscriber awareness that relates traffic and usage to specific customers
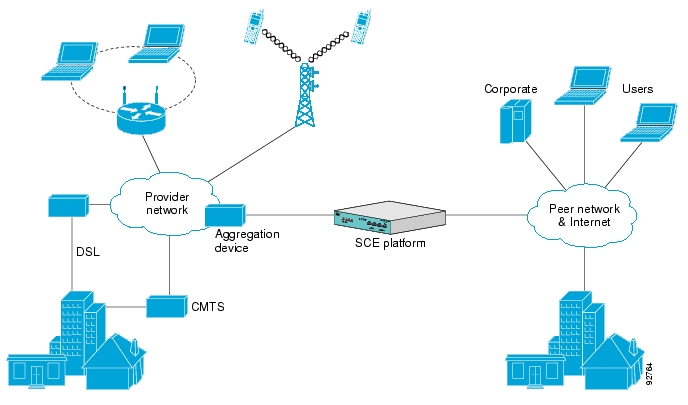
The following diagram illustrates a common deployment of an SCE platform in a network.
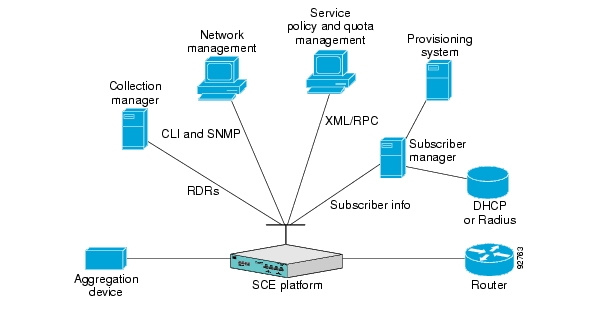
The Cisco Service Control solution includes a complete management infrastructure that provides the following management components to manage all aspects of the solution:
Network management
Subscriber management
Service Control management
These management interfaces are designed to comply with common management standards and to integrate easily with existing OSS infrastructure.
Cisco provides complete network FCAPS (Fault, Configuration, Accounting, Performance, Security) Management.
Two interfaces are provided for network management:
Command-line interface (CLI)—Accessible through the Console port or through a Telnet connection, the CLI is used for configuration and security functions.
SNMP—Provides fault management (via SNMP traps) and performance monitoring functionality.
Where the Cisco Service Control Application for Broadband (SCA BB) enforces different policies on different subscribers and tracks usage on an individual subscriber basis, the Cisco Service Control Management Suite (SCMS) Subscriber Manager (SM) may be used as middleware software for bridging between the OSS and the SCE platforms. Subscriber information is stored in the SM database and can be distributed between multiple platforms according to actual subscriber placement.
The SM provides subscriber awareness by mapping network IDs to subscriber IDs. It can obtain subscriber information using dedicated integration modules that integrate with AAA devices, such as Radius or DHCP servers.
Subscriber information may be obtained in one of two ways:
Push Mode—The SM pushes subscriber information to the SCE platform automatically upon logon of a subscriber.
Pull Mode—The SM sends subscriber information to the SCE platform in response to a query from the SCE platform.
Service configuration management is the ability to configure the general service definitions of a service control application. A service configuration file containing settings for traffic classification, accounting and reporting, and control is created and applied to an SCE platform. SCA BB provides tools to automate the distribution of these configuration files to SCE platforms. This simple, standards-based approach makes it easy to manage multiple devices in a large network.
Service Control provides an easy-to-use GUI to edit and create these files and a complete set of APIs to automate their creation.
The Cisco Service Control solution generates usage data and statistics from the SCE platform and forwards them as Raw Data Records (RDRs), using a simple TCP-based protocol (RDR-Protocol). The Cisco Service Control Management Suite (SCMS) Collection Manager (CM) software implements the collection system, listening in on RDRs from one or more SCE platforms and processing them on the local machine. The data is then stored for analysis and reporting functions, and for the collection and presentation of data to additional OSS systems such as billing.
The SCA Reporter is the Cisco Service Control Application tool that allows you to produce reports based on the traffic analysis performed by the Service Control Engine (SCE) platform. The information is sent from the SCE platform and is stored in a database. The SCA Reporter can query and retrieve information from the database and present the results in a comprehensive range of reports, including global monitoring, subscriber monitoring, P2P, and traffic discovery statistics reports.
The SCA Reporter is a valuable tool for understanding the habits and resource consumption of the applications and subscribers that use your network. It can also be used to judge the efficacy of various rules and the possible impact of their implementation on the network.
The SCA Reporter is available only in a deployment with a database. You can generate reports using any of the following methods:
Standalone application
Command-line interface (CLI)—See The SCA Reporter Command-Line Interface
Tool of the SCA BB Console—See The SCA Reporter as a Tool in the SCA BB Console
The available reports can be presented in a variety of charts (for example, stacked-bar or area) or in tabular form. You can adjust the chart display for various presentation options (for example, 3D). You can export both tabular and chart reports to files. You can also modify the reports by changing the values assigned to the parameters (for example, time boundaries). You can duplicate, export, and save reports.
After generating an initial report, you can generate reports using the SCA Reporter Command-Line Interface (CLI) without using the GUI.
SCA Reporter consists of visual components (known as views). The following are the views and the tasks that are completed in each view:
Templates View—Used to select a template, create a new report instance, and generate a report.
Properties View—Used to view parameters and values of the object in focus, which can be template groups, templates, report instances, and chart display parameters. You can also configure report instance and chart display parameters.
Report View—Used to view the appearance of the report when chart tab is selected and to view the data when the table tab is selected. When a report is selected, you can navigate to the report instance that generated it.
Progress View—Used to monitor reports executed or exported. You can view progress details in this view, and also choose to generate reports in the background so that you can continue working on other reports.
Generating a report can be divided into three broad steps:
Create a report instance and execute the report from the Templates View.
Configure the parameters of the report in the Properties View.
Adjust the chart display and view reports in tabular or graphic form, using the Report View.
You can generate multiple reports simultaneously and later export them. While the reports are executing, you can monitor them and put them in the background by using the Progress View.
You can install the SCA Reporter GUI front end on any computer running Windows 98, Windows 2000, Windows NT, or Windows XP.
The computer should have a minimum of 512 MB of memory; 1024 MB of memory is recommended.
To install the SCA Reporter:
Navigate to the SCA Reporter installation file,
SCAS Reporter 3.0.5 Setup.exe, and double-click it.The Welcome screen of the SCAS Reporter 3.0.5 Setup Wizard appears.

Click Next.
The Install Location screen of the Setup Wizard opens.

(Optional) Click Browse to choose a different destination folder.
Click Next.
The Start Menu Folder screen of the Setup Wizard opens.

(Optional) Enter a different Start Menu folder in the Start Menu Folder field.
Click Install.
The Installing screen of the Setup Wizard opens.

Wait until installation is complete.
The Next button is enabled.
Click Next.
The Installation Complete screen of the Setup Wizard opens.

Click Finish.
The SCAS Reporter 3.0.5 Setup Wizard closes
The SCA Reporter is now installed on the machine.


You can access the SCA Reporter from the Start menu.

This section defines terms and concepts that are necessary for understanding the SCA Reporter configuration and operation.
The part of the SCA Reporter configuration that is associated with a particular Cisco application. It consists of template groups and repository preferences.
For example, “SCA BB 3.0”.
A specification of a particular report, consisting of parameters and SQL code (which is not visible to the user).
For example, “Global Bandwidth per Service”.
An instance of a template in which some or all parameters have set values.
An item of a template whose value determines some aspect of the report instance.
If a report has undefined mandatory parameters, you cannot execute it. Some parameters have a default value, which is used if the user has not supplied a different value.
When you first use the SCA Reporter, you must set up and generate your first report, and then you can work with the report.
To generate your first report:
Add and configure a database for the SCA Reporter (see Configuring a Database Connection).
Set the IP address of the SCE (see Setting the IP Address of the SCE).
Confirm that there is an active database and that the system is configured correctly (see Checking System Conditions).
Open the Templates View and select a template. From the drop-down menu in the tab, select New (see Creating a New Report Instance).

Fill in values for mandatory and other report parameters (see Configuring Parameters of a Report Instance).

Click
 (Execute) to generate the report.
View your Report.
The Chart display parameters are in the Properties View.

To work with your first report:
In the Report View, from the drop-down menu in the tab, select Go To Report.
The Report parameters are in the Properties View.
Click the Select Services to View parameter, and check E-Mail Services, Generic IP Services, and News Services.
Click
(Execute) to regenerate the report.
Click the Chart Rendering parameter, and change its value from STACKED_BAR to STAIR (see Configuring Parameters of a Chart Display).

Click the Settings parameter, change the Ambient Light sliding scale, and click OK.
To export the report to a file, from the main menu, choose File > Export (see Exporting Single or Multiple Reports).
To duplicate the report, from the drop-down menu in the tab, select Duplicate.

Exit the SCA Reporter (see Exiting the SCA Reporter).
This chapter explains how to use the GUI, which includes navigating and configuring.
You must create a basic configuration for the SCA Reporter, which includes selecting a database type, connecting to a database, activating the database, and setting the IP of the SCE platform for policy data.
In bundled mode, the Cisco Service Control Management Suite (SCMS) Collection Manager (CM) is used with the Sybase Adaptive Server Enterprise (Sybase ASE). The Sybase data management platform supports transaction-intensive enterprise applications. It enables you to store and retrieve information online and can warehouse information as needed. (For more information, see the Cisco Service Control Management Suite Collection Manager User Guide.) The CM can also be configured to work with Oracle and MySQL databases.
After a database is activated, you must select one IP address of an SCE device in the database. The choice is made for each repository, represented by a tab in the Preferences dialog box. All options presented in the Templates View of the SCA Reporter (available packages, services, etc.) are determined by the service configuration currently applied to the configured SCE platform. Each report is generated according to the SCE device to which it is configured. In the sample configuration, there is one SCE device connected to the database and one repository preference.
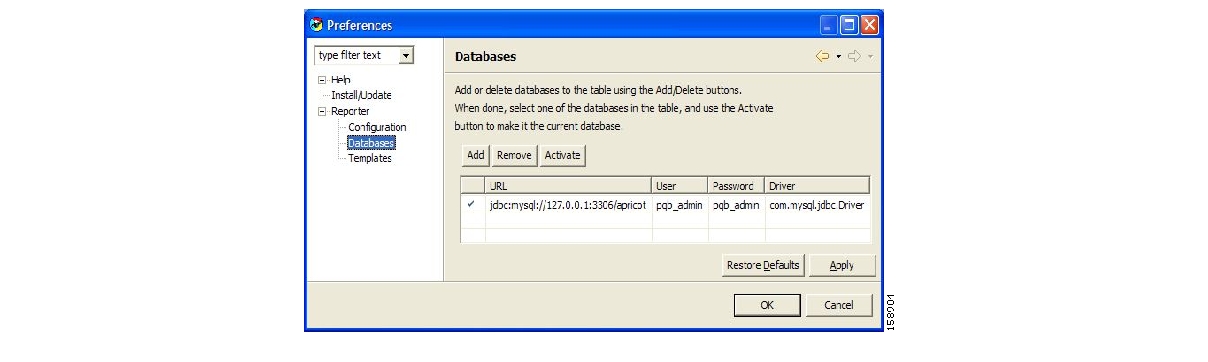
To activate a database connection:
From the main menu, choose Window > Preferences.
The Preferences dialog box appears.

From the Preferences tree, select Reporter > Databases.
In the Databases pane, click Add.
The Add Database wizard appears, open to the Database connection definition mode screen.

Select one of the Choose definition mode radio buttons:
Simple
Advanced
Click Next.
The Define new database connection screen of the Add Database wizard opens. The actual screen depends on the definition mode you selected in step 4:
The simple screen:

The advanced screen:

Fill in all the fields.
Check the activate this database check box.
Click Finish.
The Add Database wizard closes.
The definition of the database is added to the list in the Preferences dialog box.
Click Apply.
The system activates the database.
Note
Clicking Apply is necessary to set the IP of SCE for policy data parameter (see Setting the IP Address of the SCE).
To set the IP address of an SCE platform:
From the main menu, choose Window > Preferences.
The Preferences dialog box appears.

In the Preferences tree, select Reporter > Templates
In the Templates pane, from the IP of SCE for policy data drop-down list, select the IP of SCE for the SCA BB templates repository.
Click Apply.
The IP address of the SCE platform is set for policy data.
Note
There may be more than one SCE platform, but you choose only one, when they all have the same policy data.
Note
If more than one repository (set of templates) is available in the Reporter, two tabs are displayed in the Preferences dialog box. In each, you choose one SCE platform. In this case, there will be two sets of template groups in the Templates View.
You can also create an advanced configuration that allows you to configure some functions of the SCA Reporter.
For example, you can set the following:
Whether to log debug messages
The number of seconds to wait for a database connection
To send debug messages to log:
From the main menu, choose Window > Preferences.

In the Preferences tree, select Reporter > Configuration.
In the Configuration pane, check the Send debug messages to log check box.
Click Apply.
The system applies the preferences to the session.
NoteCaution: Logging debug messages can cause the log file to grow rapidly.
To configure seconds to wait for a database connection:
From the main menu, choose Window > Preferences.
In the Preferences tree, select Reporter > Configuration.
In the Configuration pane, enter the number of seconds to wait for a database connection. This parameter dictates how long the SCA Reporter tries to connect to a database if the database does not respond immediately.
Click Apply.
The system applies the preferences to the session.
You can navigate to template groups, templates, and report instances in the Templates View. When you select an item, it is in focus and the Properties View shows its properties.
The Report View opens when a report is generated. You can navigate to the report instance that generated the report by choosing the drop-down menu item Go to report.
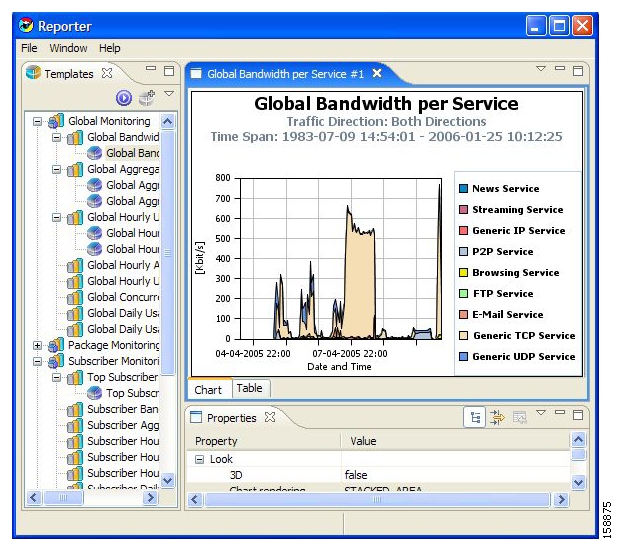
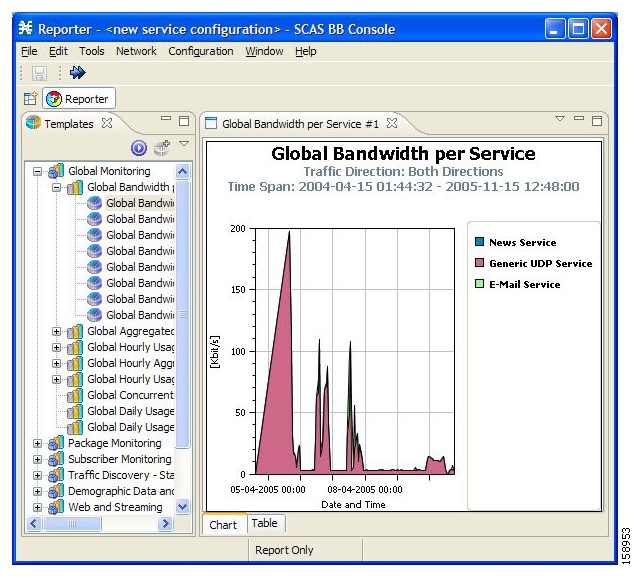
The Templates View tab is labeled Templates; the Properties View tab is labeled Properties; the Report View contains reports with the name of each open report on a separate tab. For example, the upper tab of a report may be labeled Global Bandwidth per Service. In the following figure, the report chart is displayed (the Chart tab is selected—indicated by an orange band on top of the tab’s label).
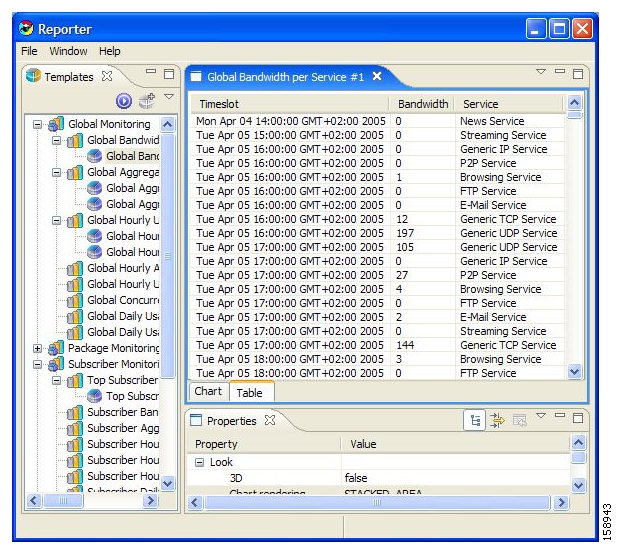
To view the raw data, select the tab labeled Table:
The following table lists and describes the menus and options of the SCA Reporter menu bar.
Table 3.1. SCA Reporter Menu
|
Menu |
Option |
Description |
Comments |
|---|---|---|---|
|
File |
New Window |
|
|
|
|
Export |
Saves the report to a file |
Opens the Export wizard. See Exporting Single or Multiple Reports. |
|
|
Exit |
Closes the SCA Reporter |
|
|
Window |
Show View |
|
|
|
|
Preferences |
Install/Update Templates | |
|
|
|
Databases |
Allows you to add, remove, or activate databases. See Configuring a Database Connection. |
|
|
|
Templates |
Allows you to create settings for installed templates. See Setting the IP Address of the SCE. |
|
|
|
Configuration |
Allows you to set the database connection timeout and select whether to log debug messages. See Configuring Seconds to Wait for Database Connection and Sending Debug Messages to Log. |
|
Help |
Welcome |
Welcome View |
Links to databases and templates preferences. |
|
|
|
Create a basic configuration | |
|
|
Help Contents |
Opens a separate Help window to search for information | |
|
|
Search Help |
Opens Help View in the SCA Reporter window to search for information | |
|
|
Manage Configuration |
Opens the Product Configuration dialog box |
Allows you to scan for updates, view installed history, show activities, and add an extension location for browser. |
|
|
Find and Install |
Opens the Install/Update wizard for new/current features | |
|
|
Check Conditions |
|
|
|
|
About SCA Reporter |
Current Version of SCA Reporter, license, plug-in details, confirmation details, and confirmation details with system summary and error log |
The GUI has a drop-down menu for each view. When the menu is selected, all the available actions for that view appear. You can select menu items from the menu of each view, but there are icons on the tab of the view for frequently used actions.
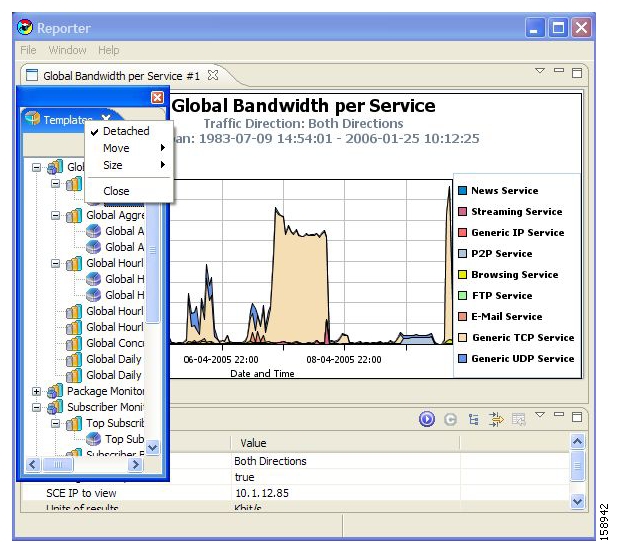
The GUI also has a popup menu for each view. Right-click the tab of a view, and select an option to personalize the layout of the SCA Reporter window. Some of the available actions are:
Detached—Detach a view and move it over the SCA Reporter window
Move—Move a view or a tab group
Size—Change the size of a pane
The following figure shows the Templates View after it is detached from the SCA Reporter.
The Help menu accesses a number of options:
Welcome (see Creating a Basic Configuration for the SCA Reporter)
Help Contents (see Accessing Online Help)
Search (see Accessing Online Help)
Manage Configuration, Provides a description of the current configuration
Find and Install (see Installing and Upgrading SCA Reporter Templates)
Check Conditions (see Checking System Conditions)
About SCAS Reporter Details (see Installing the Reporter Templates and Viewing the Error Log)
The Properties View always shows the properties of the item that is selected in the view in focus. You can control how the properties are presented by clicking on one of the following buttons:
 (Show Categories)—To view the parameters with or without their categories
 (Show Advanced Properties)—To view all parameters or only mandatory ones
 (Restore Default Value)—To reset a selected parameter to its default value:
When a parameter is not mandatory, it is unset.
When a parameter is mandatory and has a default value, it is reset to the default value.
When a parameter is mandatory and does not have a default value, the parameter is not changed.
To change the value of a parameter, select the parameter and reconfigure it (see Configuring Parameters of a Report Instance and Configuring Parameters of a Chart Display). Then re-execute the report so that the new report will appear with the new configuration.
In the following example, notice the actions and how they affect displayed parameters in the Properties View.
To shift the displayed parameters in the Properties View:
Generate a report from the Global Bandwidth per Service template.
The parameters in the Properties View are chart display parameters (because a chart is displayed in the Report View).
NoteThe default value of the Units of Results parameter is Mbps. The chart below is shown with kbps. To change the value, select the report instance so that the report parameters are shown in the Properties View, set Units of Results to kbps and, from the drop-down menu in the tab, select Execute.
In the Report View, from the drop-down menu in the tab, select Go to report.
In the Properties View, the display shifts from chart display parameters to report instance parameters. The report instance used to generate the report is selected, and the view in focus shifts from the Report View to the Templates View. The mandatory parameters are displayed.

In the Properties View, from the drop-down menu in the tab, select Show Advanced Properties.
All the parameters are displayed.

Click
(Show Categories) to toggle viewing parameters with or without displaying categories.Category names are removed from the Properties View.

Click Services to View, and uncheck Generic TCP Service.
Click
 (Check) to select the new choices.
The Services to View parameter is updated.

Click
(Execute) in the Properties View.Generic TCP Service is removed from the legend and from the graph.

When working with reports, you may want to assign values to report instance parameters. You would use a similar method to assign values to chart display parameters. How the field is applied to the value of the parameter depends on the type of parameter. In report parameters, the new value is applied the next time the report is generated. In chart display parameters, the value is applied as soon as the field is applied.
Types of parameters include:
No Value—When no value is assigned, (not set) is displayed.
Free Text—Any text string can be entered.
Boolean—The value toggles between True and False.
Date—Click the
 icon to open a Choose Date and Time dialog box.
Single Choice—Click the
 icon to open a drop-down menu.
 Multiple Choice—Click the
icon to open a dialog box where more than one value can be checked.The icons of the Multiple Choice dialog box are described in the following table.
Table 3.2. Parameter Option Icons
|
Icon |
Option |
Description |
|---|---|---|
|
|
Select All |
Select all values. |
|
|
Invert Selection |
Uncheck the checked boxes and check the unchecked. |
|
|
Select None |
Uncheck all boxes. |
|
|
Cancel |
Exit the Parameter Option dialog box without saving. |
|
|
OK |
Save and exit the Parameter Option dialog box. |


Note
Some parameters are mutually exclusive. From the last number of hours and Starting after date and time cannot both be implemented, even if both are selected.
Thus, if you want to define the time frame to begin at a specified time, select Starting after date. Even if From the last number of hours is also chosen, the report time frame will be according to the date and time values.
The following is an example of assigning values to report instance parameters.
To assign values to report instance parameters:
In the Templates View, choose (or create) a report instance.
The report instance is selected in the Templates View, and the report parameters are displayed in the Properties View.
NoteIf the parameter that you are modifying is not displayed, click (Show Advanced Properties).Click in the Traffic Direction parameter row, and click the
icon that appears.A drop-down menu of parameter values opens.

Select a value.
Click in the Services to View parameter row, and click the
icon that appears.A checklist of parameter values appears.

Check the services you want to view.
Click
(OK).Click in the Ending Before Date parameter row, and click the
icon that appears.A choose date and time dialog box appears.
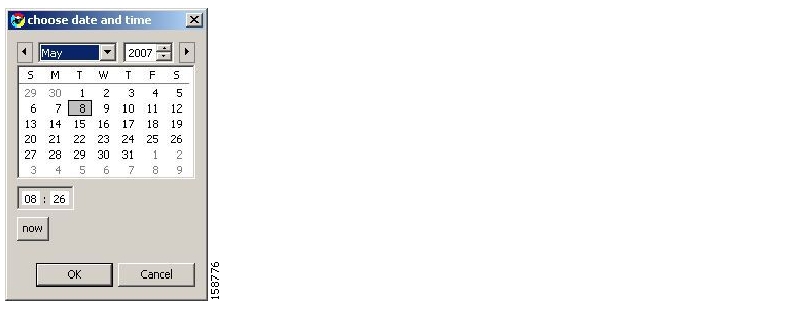
Select a date and time, and click OK.
Click
(Execute).The report is generated with the configured values.
You can configure chart display parameters, which are those in the Look category of the Properties View. When you commit the changes, the chart display is updated. There are also adjustments that are made directly in the Report View (see Adjusting Chart Display).
The following is a table displays the Chart Display parameters and their descriptions:
Table 3.3. Chart Display Parameters
|
Parameter |
Type |
Default |
Values |
Comments |
|---|---|---|---|---|
|
3D |
Boolean |
False |
True, False |
If True, the chart is three-dimensional. |
|
Chart Rendering |
Single choice |
Stacked Area |
See list following table |
The chart can be displayed in many graphical formats. |
|
Legend Visibility |
Boolean |
True |
True, False |
If True, the legend is displayed in the chart. |
|
Oblique |
Boolean |
True |
True, False |
Only displayed when 3D is True. If True, there is always 90 degrees between the x and y axes when the graph is rotated. |
|
Settings |
Sliding scale |
See following table |
See following table |
Only displayed when 3D is True. Sliding scales of eight characteristics (see following table). |
Possible values for the Chart Rendering parameter:
|
|
|
Table 3.4. Chart properties set by the Settings parameter:
|
Property |
Values |
Default |
|---|---|---|
|
Rotation |
-90 ... 90 |
35 |
|
Elevation |
-90 ... 90 |
45 |
|
Depth |
0 ... 100 |
20 |
|
Depth Gap |
0 ... 100 |
0 |
|
Zoom |
0 ... 200 |
1.0 |
|
Ambient Light |
0 ... 100 |
0.1 |
|
Light Latitude |
-90 ... 90 |
0.0 |
|
Light Longitude |
-90 ... 90 |
0.0 |
The following is an example of assigning values to chart display parameters.
To assign values to chart display parameters:
In the Templates View, choose (or create) a report instance.
The report instance is selected in the Templates View, and the report instance parameters are displayed in the Properties View.
Click
(Execute).The report is selected in the Report View and the chart display parameters are displayed in the Properties View.
Select the Chart Rendering row. From the drop-down list, choose the type of chart you want to display.

The report is updated.
To display the chart in three dimensions, click the 3D parameter.
The value changes from False to True and the Oblique and Settings parameters appear.
Select the Settings parameter and set the three-dimensional properties using the sliding scales.
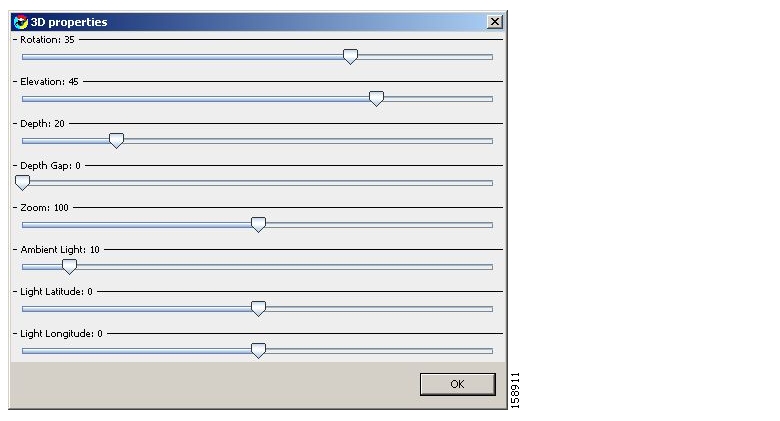
Click OK.
The new values are assigned to the Settings parameter. Changes can be viewed in the Report View.


The following is an example of configuring parameters.
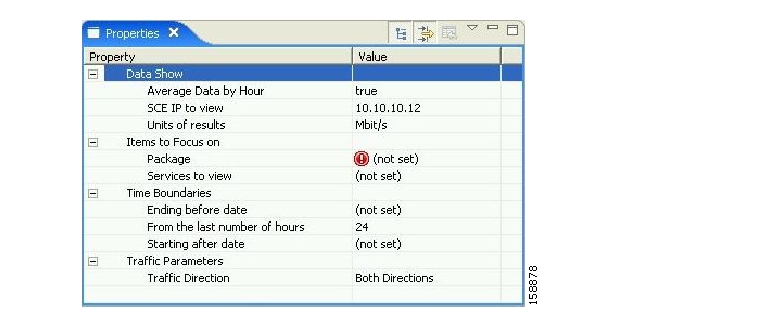
To configure average data by hour:
Select a report instance.
Mandatory parameters are visible in the Properties View. In this example, the mandatory parameters are Average Data by Hour, SCE IP to View and Traffic Direction. When any of the parameters are not set, the report cannot be generated.

Set the Configure Average Data by Hour parameter to False.
From the drop-down menu in the tab, select Execute.

You can access relevant parts of this user guide from the SCA Reporter.
To access online help:
From the Help menu, choose Help Contents.
Online help opens in a separate window.
You can also search online help from the current tool.
To search online help:
From the Help menu, choose Search.
A new area containing a Help tab is added next to the current tool.

Enter a word, phrase, or more complex search expression in the Search expression field.
The Go button is enabled.
NoteClick >> (Expand) for an explanation of how to construct search expressions.Click Go.
Help topics containing your search expression are listed under Local Help.
Click a help topic to view its contents.
NoteYou can bookmark topics for later reference.By clicking the appropriate link at the bottom of the Help tab, you can switch to:
All topics
Related topics
Bookmarks
The SCA Reporter supplies templates for a wide variety of reports, such as:
Global or package hourly or daily usage volume per service
Top server/clients/protocols/web hosts/e-mail senders/newsgroups
Subscriber hourly or daily usage volume per service
Top P2P consumers/uploaders/downloaders/protocols
Global, package, or subscriber bandwidth per service
The Properties View presents all the parameters of the report, both mandatory and non-mandatory, so that you can select the desired values. For example, if you want to see global bandwidth per service, create a new report from the Templates View of the SCA Reporter. The Properties View allows you to specify the desired service(s), traffic direction, and time frame (either start/end time or previous number of hours). For a complete description of all templates see SCA Reporter Templates.
The report is defined in the Templates View. When the report is generated, it is displayed in the Report View. The Properties View displays the chart display parameters. To view the report instance parameters, go to report instance in the Templates View. This shifts the parameters that appear in the Properties View. You can duplicate the existing report instance. After that, modify the report instance by adjusting the chart display and report instance parameters. Renaming the original or duplicated report instance helps manage the reports. You can delete the report instance when you no longer require it (see Properties View).
When you create a report, you select the desired report template and then specify values for the various report parameters.
The procedure for defining a report depends on the report selected and the number of changes made to the basic report description. Also, the exact steps in selecting specific values for parameters may vary. Therefore, the following example is intended only as a general guide to the process of creating a new report instance.
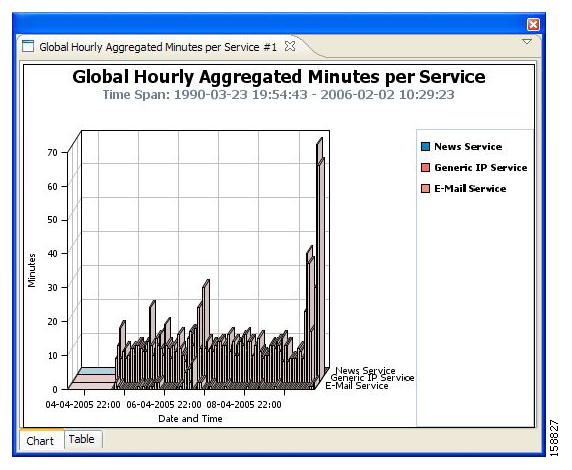
The following example illustrates defining the Global Hourly Aggregated Minutes per Service report.
To create a new report:
Select a template from the Templates View (for example, Global Monitoring > Global Hourly Aggregated Minutes per Service). Right-click the template, and, from the popup menu that appears, choose New.
A new report instance is displayed and the report parameters appear in the Properties View.
Click
(Execute).The report is generated with default values. The Report View and the Properties View appear. When mandatory parameters are set, the Chart Display parameters (Look category) appear in the Properties View. An error may appear when the mandatory parameters are not all defined.
Duplicating an existing report instance is a useful way to create a new report that is similar to an existing report. It is faster to duplicate a report and then make changes than to define the report from scratch.
You can locate and then modify an existing report instance.
To modify an existing report instance:
Do one of the following:
Select an existing report from the Report View and, from the drop-down menu in the tab, select Go to report.
Select a report instance from the Templates View.
The existing report instance is selected in the Templates View and the report instance parameters are displayed in the Properties View.
If only mandatory parameters are displayed in the Properties View, click
(Show Advanced Properties).All parameters are displayed in the Properties View.

Click
(Show Categories) when Categories are displayed in the Properties View.The Categories are not displayed in the Properties View.
Edit the parameters by clicking on the row of the parameter, making changes, and then committing the changes.
Change the Services to view—Uncheck Generic UDP Service and P2P Service.
The changes are saved for the next time the report is executed.
Click
(Execute).The report is regenerated without Generic UDP Service and P2P Service. The Report View opens. The Chart Display Parameters are displayed in the Properties View.
You can rename an existing report instance. This is useful when the same report is generated on a regular basis. The date or other identifying information can be included in the name of the report.
To rename a report instance:
In the Templates View, choose a report instance.
Right-click the report instance and, from the popup menu that appears, choose Rename.
The report instance is highlighted and you can edit its name.

Type in a new name and press Enter.
The report instance is listed with the new name.

You can delete report instances.
You use the Templates View of the SCA Reporter to define and generate a report, and the generated report is displayed in the Report View. You can display the report in chart or tabular form. You can adjust a chart display, save it, and export it to a file.
The views found on the SCA Reporter display menu items. Some commonly used actions have icons for easy navigation.
The actions and their icons are described in the following table.
Table 5.1. Actions
|
Action |
Icon |
Description |
Comments |
|---|---|---|---|
|
Home |
|
Opens the Welcome View. |
|
|
Menu |
|
Displays all the available actions for the view. |
Common to all views. Has different actions depending on the view. |
|
Execute |
|
Generates the selected report. |
In Properties View and Templates View. |
|
New or Report (From Legend) |
|
Creates a new report instance. |
In Templates View—When you select a report template, the icon is new. In Report View—When you right-click a legend item, the Subset of Template Groups and Templates View appear. Choose a template, and click OK. The report instance is created (modified). |
|
Refresh |
|
Refreshes the Templates View so that only the report groups are displayed. |
In Templates View. |
|
Show Cmd |
|
Opens a window displaying the CLI command for the report. |
In Templates View—The CLI commands are placed on the clipboard. You can paste them into a vanilla text editor, edit them, and then execute them from a command file shell or a command prompt. |
|
Delete |
|
Deletes the report. |
In Templates View. |
|
Duplicate |
|
Creates a copy of the report instance. |
In Templates View. |
|
Rename |
|
Highlights the report instance so that you can rename it. |
In Templates View. |
|
Show Categories |
|
Toggles between displaying parameters with and without categories. |
In Properties View. |
|
Show Advanced Properties |
|
Toggles between displaying mandatory parameters and all parameters. |
In Properties View. |
|
Restore Default Value |
|
Restores parameter default value. |
In Properties View—Default values can be a value or (not set). Mandatory parameters have a value. Default values of non-mandatory parameters may have the value (not set). |
|
Go to report |
— |
Navigates from the selected report in the Report View to the report instance in the Templates View. |
In Report View. |
|
Export raw data |
— |
Opens browsers to save the report data. |
In Report View. |
|
Show List |
|
Indicator the number of reports that have been executed. When you select this option, the reports are listed. |
In Report View—To display a report, choose from the bolded report names. The number in the icon indicates how many reports are not in view. |
|
Preferences |
— |
A dialog box appears for choosing preference for whether to show system tasks or not. Sleeping (waiting) tasks are shown in both cases. |
In Progress View The |
|
Remove All Finished Tasks |
|
Removes all completed tasks. |
In Progress View. |


 icon is displayed while system tasks are running.
You can generate a report that was defined previously. The reports are found in the Templates View. You can duplicate, modify, rename, or delete the reports (see Defining Reports). You can also generate multiple reports, put the process in the background, and continue working on other reports.
To generate a report when a report instance is selected:
In the Templates View, select a report instance.
The report instance parameters are displayed in the Properties View.
Click
(Execute).The report is regenerated and is displayed in the Report View.
To generate multiple reports:
From the Templates View, select the report instances while pressing Ctrl.
The selected report instances are highlighted.
Click
(Execute).A Progress dialog box appears while reports are being generated.
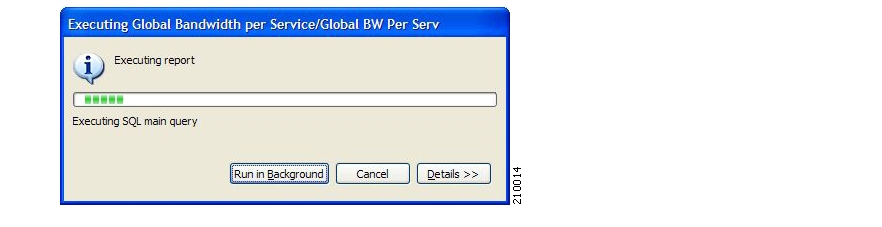
Do one of the following:
Wait until the system task status at the bottom right corner of the SCA Reporter indicates that report generation is complete.
(While the report is being generated, the system task status shows:
 )
)Click Details.
The status of all reports that are being generated is displayed.

Click Run in Background.
Report generation continues running in the background. When it finishes, the reports are displayed in the Report View.
Note
You can cancel a running report generation by clicking Cancel in its Progress View. It can take the Database Server a short time to acknowledge a cancel request, but you can move the cancelled report to the background and continue your work uninterrupted.
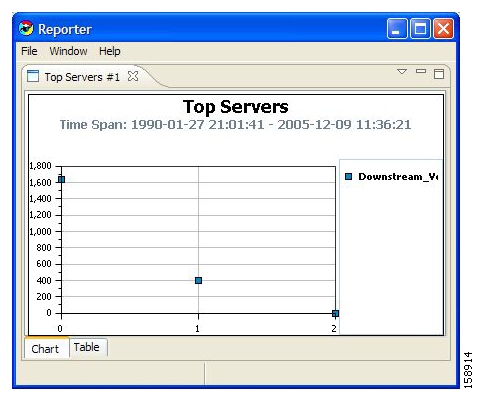
You can view reports in the Report View as charts or as tables. To select the desired view, click the appropriate tab located at the bottom-left of each report.
The table is useful for locating specific information.
You can change the appearance and type of any report chart by modifying chart display parameters, such as three-dimensional display settings and chart rendering. You can also change the appearance of a report in the following ways:
Drag the legend to a different spot in the report.
Hide the legend.
Hide items from the legend; the corresponding items in the graph will be removed from view.
Zoom in or out—drag the graph so that the desired section is in focus.
To adjust the chart display:
Select a report in the Report View.

In the Properties View, configure the chart display parameters by changing 3D to True.
The Look/3D category is added to the Properties View.
The report chart is now displayed in three dimensions.

In the Properties View, select the Settings parameter.
The 3D properties dialog box appears.
Move the Ambient Light sliding scale to the right, and click OK.
The graph is lightened.

To adjust the three-dimensional properties and view the outcome:
Generate a report.
In the Properties View, set 3D to True.

In the Properties View, set Oblique to False.
The display of the graph changes to match the new parameter setting.

In the Properties View, change Oblique back to True.
In the Properties View, select the Settings parameter, use the sliding scale to change the Rotation parameter from 35° to -50°, and click OK.
The graph is rotated.

Change the Elevation parameter from 45° to 90°, and click OK.

Change the Depth parameter from 20 to 60, and click OK.

Change the Depth Gap parameter from 0 to 90, and click OK.

To choose the type of chart:
Generate a report.
In the Properties View, set the Chart Rendering property to PIE CHART.

In the Properties View, set the Chart Rendering property to SCATTER.
You can zoom in or out of graphs. There is no difference between two- and three-dimensional graphs.
To zoom-in on a two-dimensional graph:
Mark off a rectangle by dragging the mouse over the chart.

A plus icon appears, and the view zooms in.

To zoom-out of a two-dimensional graph:
Mark off a rectangle by dragging the mouse over the chart while pressing the Shift key.

A minus icon appears, and the view zooms out.

To drag the graph:
Zoom in to the top part of a chart.

To move the chart down, right-click it while dragging the chart.
The graph moves up, and the bottom of the chart appears.

To hide services:
Generate a report.

Right-click Streaming Service in the legend.
A popup menu appears.

Choose Hide.
The service is dimmed out in the legend, and the service is removed from the chart.

To show hidden services:
Right-click Streaming Service in the legend.
A popup menu appears.

Choose Show.
The service is displayed in the chart and in the legend.
To move the legend:
Right-click the legend and drag it.
The legend moves to its new position in the chart.

Note
Particular legend items are displayed in the same color each time the SCA Reporter is run.
You can export charts to most graphic formats, and you can export tables to CSV or Quoted CSV formats, which you can open as spreadsheets. You can export multiple reports in one export operation.
To export a report:
After executing one or more reports, select File > Export.
The Export wizard appears.

Select Chart or Table.
Click Next.
The Tables and Destinations screen of the Export wizard opens.
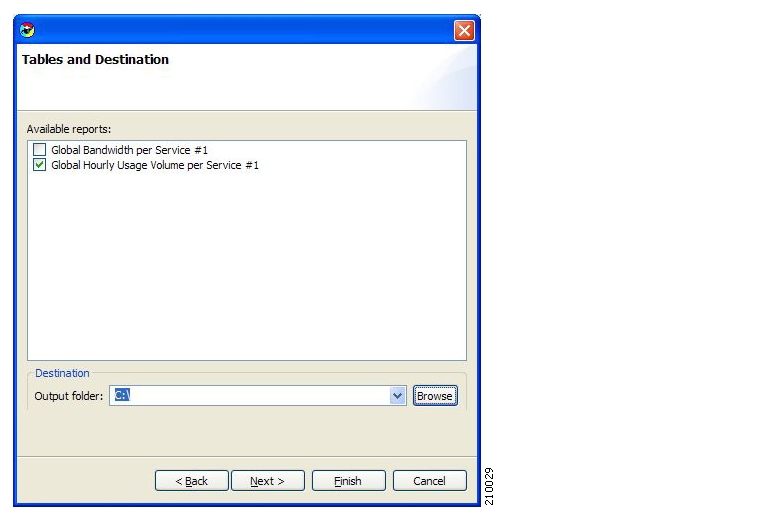
Check one or more of the Available reports.
To change the Output folder, click Browse.
Click Next.
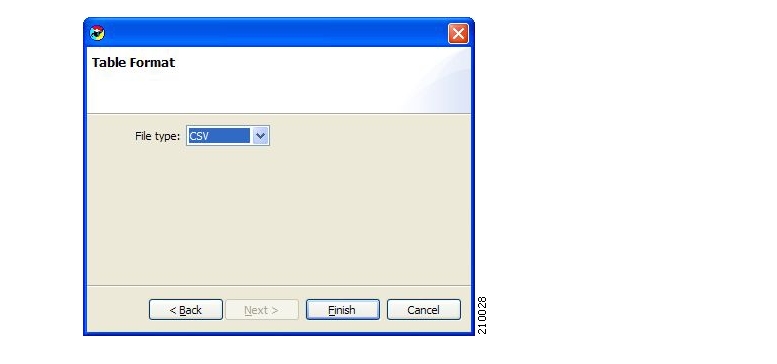
The Format screen of the Export wizard opens. (The screen that opens depends on whether you chose Chart or Table in step 2.)
Do one of the following:
(For Chart) From the File type drop-down list, choose a file type—In the Image width and Image height fields, enter values in pixels.

(For Table) From the File type drop-down list, choose a file type.
Click Finish.
Each report selected is saved in a separate file.
This chapter describes the various ways of using the Service Control Application Reporter Command-Line Interface (CLI) for executing the SCA Reporter features, including the syntax, switches, and options of the application.
The SCA Reporter Command-Line Interface (CLI) is a command-line application that complements the functionality of the SCA Reporter GUI. The CLI, which provides capabilities and flexibility beyond that of its SCA Reporter GUI counterpart, can be integrated into third-party applications to generate usage-based and statistics-based output.
Note
You must execute a report once using the GUI, since the CLI uses the generated name of the report instance. After you have verified that the report is satisfactory, you can change the CLI parameters without using the GUI.
You can execute the SCA Reporter as a command-line version that accepts input passed as parameters. After a report is generated, in the Templates View, from the drop-down menu in the tab, select Show Cmd, to create the initial CLI Command with the name of the report. The database information and the SCE platform IP parameters are included along with the configured parameters for the report instance.
The command is automatically copied to the clipboard so that you can paste it into a command file shell or a command prompt and then execute it with some minor changes. For automated reporting, other switches are added. For example, the filename to save the data and the format in which to save it are not included in the CLI for this report. (The format indicates if the report is in graphic (JPEG) or tabular (CSV) form.)
Not all parameters that exist in the original report are included in the params switch. When a parameter is not specifically listed in the CLI invocation, the value is taken from the report from which the command is based.
The following is an example of a command line for invoking the SCAS Reporter application:
reportercmd -report "Global Bandwidth per Service #1" -dbdriver
"com.mysql.jdbc.Driver" -dburl "jdbc:mysql://127.0.0.1:3306/apricot"
-dbuser "pqb_admin" -dbpassword "pqb_admin" -policysce "10.1.12.85" -params
"numhours=240000000;seip=10.1.12.85;avgdata=true;link=Link 0,Link
1;traficdir=Both Directions;services=Messaging Service,Generic UDP
Service,Generic TCP Service,News Service,FTP Service,Browsing Service,Default
Service" -o "myfile" -format "jpeg"
The following are the switches for the non-parameter arguments that must be added:
-o "filename" -format "jpeg or csv"
To generate Reporter commands:
Select a report instance and execute the report from the Templates View.
The report is generated.
(Optional) Reconfigure report instance and chart display parameters so you have a satisfactory report instance on which to base your CLI.

From the drop-down menu in the tab, select Show Cmd.

Click OK.
The command, with all the switches and parameters, is placed on the clipboard.
Do one of the following:
Open a file from which to execute the command from a shell and save the file in the Reporter directory.
Open a command prompt from which to execute the CLI command and change the directory to the Reporter directory.
Paste the clipboard contents.
The command is pasted in the file or in the command line.
Add the following mandatory flags:
-o"filename"-format"jpeg or csv"
(Optional) Change parameters. For example, you may want to change the
numhoursparameter.
Execute the command for automated reporting.
The exported file is saved in the defined directory with a time stamp appended to the name of the report.
The following are switches in the command line for invoking the SCA Reporter application:
-report-dbdriver-dburl-dbuser-dbpassword-policysce-params-o-format
The following table describes the options of the command line for invoking the SCA Reporter application:
Table 6.1. Command-Line Options for SCA Reporter Application
|
Option |
Action by SCA Reporter |
Comments |
|---|---|---|
|
-report |
Generates a report using report-name. |
Use this parameter when generating a report from one of the report instances. |
|
-dbdriver |
Driver for the database. |
Same database that is configured in the SCA Reporter. |
|
-dburl |
URL for the database. |
|
|
-dbuser |
User for the database. |
|
|
-dbpassword |
Password for the database. |
|
|
-policysce |
(Required) Configuration of IP of SCE for policy data of templates. |
Same IP of SCE for policy data that is configured in the SCA Reporter. |
|
-params |
Parameter from the Properties View. |
When a particular parameter is not listed, the default value is used. |
|
-o |
(Required) Name of file to which to direct output. |
If the filename already exists, the original file is overwritten. |
|
-format |
(Required) Generates report as a chart or table in the specified report-format. |
|
This appendix describes the how to install and upgrade SCA Reporter templates.
To install the Reporter templates:
From the main menu, choose Help > Find and Install.

Check the Search for new feature to install radio button, and click Next.

Click New archived site.
The Select Local Site Archive dialog box appears.
Browse to the archive file and select it.
The file is named
SCAS_bb_template_<version>B<build>.zip. For example, the file may be namedSCAS_bb_template_3.0.5B8.zip.
Click Open.
The Edit Local Site dialog box appears with the zip name and the URL with the content.

Click OK.

Click Finish.

Accept the agreement, and click Next.
The Updates dialog box appears with the installed features available for the site.
Select the required feature, which should be named
SCAS BB Templates<version>.<build>. For example, the file may be namedSCAS BB Template 3.0.5.8.
(Optional) To install the feature in a different location, click Change Location and browse to the required location.

Click Finish.

Click Install or Install All.

Click Yes, and wait for the application to come up.
The computer restarts.
The new Reporter templates are installed.
To verify installation of Reporter templates:
From the main menu, choose Help > About SCAS Reporter.
The About SCAS Reporter dialog box appears.
Click Plug-in Details.
The About SCAS Reporter Plug-ins dialog box appears.

Verify that the newly installed version is displayed in the Reporter plug-in list, and click OK.
The About SCAS Reporter Plug-ins dialog box closes.
To upgrade the SCA Reporter templates:
From the main menu, choose Help > Find and Install.
Check the Search for updates of the currently installed features radio button, and click Finish.
One of the following occurs:
There are no updates.

There are updates.
The wizard appears (see Installing the Reporter Templates).
The SCA Reporter went through extensive testing. However, if you encounter problems use the information in this appendix to help isolate the cause of the problems. The procedures in this appendix assume that you are troubleshooting the initial system startup, and that the GUI is in the original factory configuration. If you have changed any default settings, the recommendations in this appendix might not apply.
This appendix describes the subsystems for more efficient problem solving. If you are unable to solve your problem, contact a customer service representative for assistance and further instructions. Provide the representative with the following information:
Type of software and release number
Brief description of your problem
Brief explanation of the steps you have taken to isolate and resolve the problem
Maintenance agreement or warranty information
Searching the Help menu allows you to learn more about the SCA Reporter while you are working. You can get assistance with the following functions from the Help Menu (see The Help Menu):
Creating a Basic Configuration
Accessing Online Help
Checking System Conditions
Managing Configuration
Installing and Upgrading Templates
Viewing Plug-in Details
You can also access Online Help while working in the SCA Reporter (see Accessing Online Help).
Check the following if the GUI does not open:
Ensure you have enough memory.
Uninstall an old release before installing a new release.
The database is installed and populated.
The IP address of the computer is not connected to another device.
You can also select Help > Welcome, for guidance in creating a basic configuration. On the Welcome View are explanations, a shortcut to the Add Database wizard for activating a database, and another shortcut for setting IP of the SCE platform in the templates preference. There is also a shortcut for starting the SCA Reporter.
You can check that:
The database connection is defined correctly and that the connection is active
The system is configured correctly

To configure debug message logging, see Sending Debug Messages to Log. When this mode is activated, you can view the error log.
To assist you in using and troubleshooting the SCA Reporter Command-Line Interface (CLI), refer to the following sections of the Cisco Service Control Engine (SCE) CLI Command Reference:
CLI Help Features
Navigational and Shortcut Features
Managing Command Output
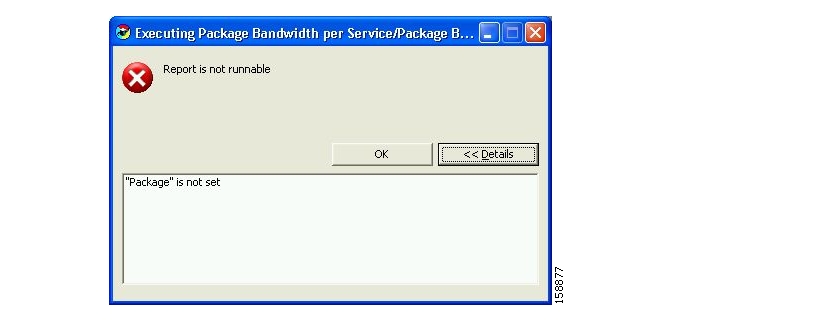
In this example, a mandatory parameter is not set.
When the report is executed, an error message appears.

Click Details to view more specifics on the error.
Where the database structure has changed, but the Repository was not updated, there may be errors (see Installing and Upgrading SCA Reporter Templates).
Note
The files used for installing and upgrading may need to be updated before the installation.
This appendix describes the SCA Reporter as a tool in the SCA BB Console. For more information about the SCA BB Console, see the Cisco Service Control Application for Broadband User Guide.
The SCA Reporter is a tool in the SCA BB Console and is accessed by opening a Perspective.
To access the SCA Reporter from the SCA BB Console:
Choose start > All Programs > Cisco SCAS > SCAS BB Console 3.0.5 > SCAS BB Console 3.0.5.
The SCA BB Console window appears.

From the Console main menu, choose Tools> Reporter.
The Reporter perspective opens.

The Reporter tool has a standard toolbar and menu bar. Underneath the menu bar is the perspective bar. When you open a tool, a button is added to the perspective bar. To switch between open tools, click the appropriate button on the perspective bar.
The default view for the Reporter tool is the Templates View. When a report is executed, the Report View and Properties View are also displayed.
The configuration and operation of the SCA Reporter as a tool in the SCA BB Console is identical to its configuration and operation as a standalone. This includes navigation (see Navigating in the Reporter: Views).
Note
The title of the Console window shows the active tool and the active service configuration.
This appendix describes the SCA Reporter templates.
The SCA Reporter provides groups of templates from which to generate reports. Each template allows you to create new report instances. Default filter values are assigned to the parameters, some of which are common to all the instances in a given group. You can impose additional constraints by configuring the parameters.
Note
The default filters are the values that are initially applied to the parameters. When generating reports, you reconfigure parameters. In order to reset parameters to their default values, select parameters and click (Restore Default Value). Mandatory parameters are always displayed in the Properties View and must be set. Nonmandatory parameters may be assigned a value of (not set). To view all parameters, click (Show Advanced Properties).
You generate a report instance by selecting a report template from the list of available groups in the Templates View. The figure below shows a selected report instance named Global Bandwidth per Service #1 that was generated from the Global Bandwidth per Service template in the Global Monitoring group. The Properties View displays the values of the mandatory parameters of the report instance Global Bandwidth per Service #1.
There are two main categories of reports:
Monitoring reports—Provide insight as to how network resources are utilized according to the configured services in the system at various granularities (global, package, subscriber).
Traffic Discovery reports—Provide statistical information on network activity and help identify the characteristics of the traffic traversing the network.
The following table lists parameters that appear in reports generated from more than one template group. (Parameters that are relevant to only one template group are listed with the description of the group.)
Table D.1. Common Parameters for Reports
|
Parameter |
Field Type |
Default |
Comments |
|---|---|---|---|
|
Items to Focus on | |||
|
One of the following is included in most templates: | |||
|
Multiple Choice |
(not set) |
When not set, all services are selected. |
|
Single Choice |
(not set) |
Mandatory parameter. |
|
Single Choice |
(not set) |
When not set, all services are selected. |
|
One of the following is included in many templates: | |||
|
Multiple Choice |
(not set) |
When not set, all packages are selected. |
|
Single Choice |
(not set) |
Mandatory parameter. |
|
Subscriber name |
Free Text |
(not set) |
Mandatory parameter for Subscriber reports. IP address (decimal format) or subscriber name. |
|
Time Frames to focus |
Multiple Choice |
(not set) |
When not set, all four time frames are selected. |
|
Time Boundaries | |||
|
Starting After Date |
Time/Date |
(not set) |
|
|
Ending Before Date |
Time/Date |
(not set) |
When not set, the report is bound to the current time. |
|
Free Text |
24 |
Ignored when the Starting After Date and Ending Before Date parameters are both set.
|
|
Free Text |
7 | |
|
Specific Time |
Date/Time |
(not set) |
Mandatory parameter. Appears in three report types instead of the other three time boundary parameters. The selected time is rounded to the nearest hour/day. |
|
Traffic Parameters | |||
|
Link to Focus |
Multiple Choice |
(not set) |
List of available links to focus. |
|
One of the following is included in many templates: | |||
|
Single Choice |
Depends on template |
Depends on template:
|
|
Single Choice |
Depends on template |
Depends on template:
|
|
Data Show | |||
|
SCE IP |
Single Choice |
(not set) |
Mandatory parameter. IP address of specific SCE platform. |
|
Units of Results |
Single Choice |
Depends on template |
|
|
Limit number of results |
Free Text |
10 |
|
|
Average data by hour |
Boolean |
True |
If this option is selected, a single value is used for each hour: Average of all samples. This option is recommended when generating the report for 24 or more hours. |
|
Show other Consumption |
Boolean |
False |
|
|
Aggregation Period |
Single Choice |
Hourly |
|
|
Subscriber Id |
Free Text |
(not set) |
Pattern that represent group of subscribers. |
SCE IP—All reports include a parameter that enables filtering to a specific SCE platform. This parameter is mandatory and set to be remembered. Remembered means that if this parameter is set, it is also set for all subsequent reports.
Time Boundaries Parameters—The following time boundaries parameters are included for all reports except for Top Subscribers, Top Talkers, and Relative Consumption of Top Subscribers.
Starting After Date
Ending Before Date
From the Last Number of Hours/Days
The parameter From the last number of hours/days is set to a default value in all the reports. When all three Time Boundaries parameters are set, the last number of hours is ignored. When the parameter Ending before date is not set, the report is bound to the current time.
The following subsections describe the mainstream reports in each category.
Monitoring reports provide information on the distribution and consumption of network resources. Reports in this category are useful for the understanding of how the network is used at different granularities (such as for the entire link, or for traffic generated by all subscribers in a particular package counter, or for traffic generated by a particular subscriber). These reports are critical for the tuning of the Service Control solution’s configuration according to the changing network patterns.
Monitoring reports are created from Link, Subscriber, and Package RDRs (that are generated by the SCE platform). These RDRs provide periodic usage information (at the various granularities) that is processed according to the selected report template to provide the final report.
Reports of this type typically show a specific metric for a set of service counters at a selected granularity. For example, bandwidth for P2P and Browsing service counters at a link granularity, or volume for the Streaming service counter for subscribers in the Gold package counter.
Selecting the service counters on which to report is done via the SCA Reporter. The available service counters are those defined in the service configuration of the SCE platform from which the reports are generated.
A report’s granularity controls what part of the traffic the selected report addresses. The following granularities are supported:
Global—Provides visibility into all traffic processed by the SCE platforms being reported on. Use this global granularity to view the global distribution of network resources (for example, total P2P bandwidth for the last 24 hours)
Package—Reports on traffic mapped to subscribers in a particular package counter. Use package granularity to monitor how network resources are used by subscribers assigned to a particular package counter (for example, the total volume of streaming traffic for all subscribers assigned to the Gold package counter in the last 10 days). See the “Using the Service Configuration Editor: Traffic Control” chapter of the Cisco Service Control Application for Broadband User Guide for a description of how to define different packages in the system.
To generate package counter reports, subscribers must be defined (in any of the subscriber modes) and assigned to a particular package. See the “Using the Subscriber Manager GUI Tool” chapter of the Cisco Service Control Application for Broadband User Guide for a description of how to manage subscribers.
Subscriber—Provides insight into the activity of a single subscriber as defined in the Service Control solution. Use subscriber granularity to view how a particular subscriber is utilizing network resources (for example, the number of P2P sessions generated by subscriber xyz for each hour during the last 12 hours). Subscriber reports are available for those subscribers flagged for real-time reporting. (For a description of managing real-time subscriber reporting, see the “Using the Service Configuration Editor: Traffic Accounting and Reporting” chapter of the Cisco Service Control Application for Broadband User Guide.)
Each report template generates a report in a specific granularity (global, package, or subscriber). Each type of report is accessible from the corresponding report template group:
Global reports are accessible from the Global Monitoring group.
Package reports are accessible from the Package Monitoring group.
Subscriber reports are accessible from the Subscriber Monitoring group.
A metric is the statistic that is being reported on. The following metrics are available:
Bandwidth—Represents the total kilobits per second (kbps) consumed by the selected services. By default, bandwidth graphs are presented as stacked-area (where each area/series indicates the bandwidth of a particular service).
When generating a bandwidth report, you can select the direction: upstream or downstream (to focus on a particular direction), or both (default). An additional option is to perform an hourly average of samples so as to create a single sample for each hour. This is recommended when generating a report for more than several hours, when a single sample per hour is usually sufficient and reduces the number of samples displayed (it also increases performance and improves the visualization of the data).
Volume—Represents the total volume (in kilobytes or megabytes) for a specific period of time, for the selected service counters. As opposed to the bandwidth metric (which provides normalized volume over time), volume reports provide the total volume consumed, grouped by specific time durations. By default, volume graphs are presented as stacked-bar charts (where each bar/series indicates the volume of a particular service counter).
Volume reports accumulated usage either for specific durations of time (hours or days), or for the entire duration of the report. An example of a report that groups volume by duration is Global Hourly Usage Volume, which generates a bar that accounts for the total volume consumed (by each service counter) during each hour of the selected time frame. As a different example, the Global Aggregated Usage Volume per Service report accounts for all volume of each service counter for the entire time frame of the report.
Sessions—Counts the number of sessions. A session is a single network transaction (for example, RTSP stream or P2P file download). By default, sessions graphs are generated as stacked-bar charts (where each bar/series indicates the total number of sessions of a particular service counter).
Like volume reports, sessions reports can be grouped into specific durations (hours or days), so as to account for the total number of sessions in a particular hour/day consumed by a particular service counter.
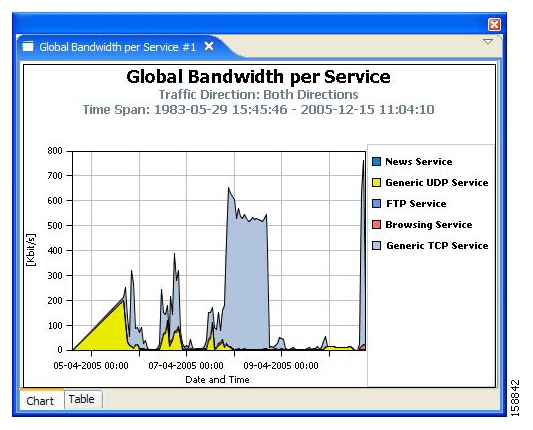
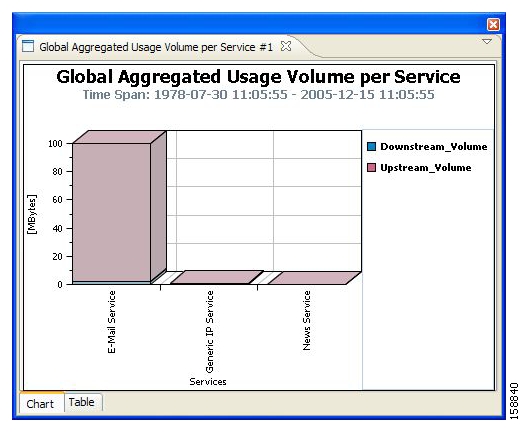
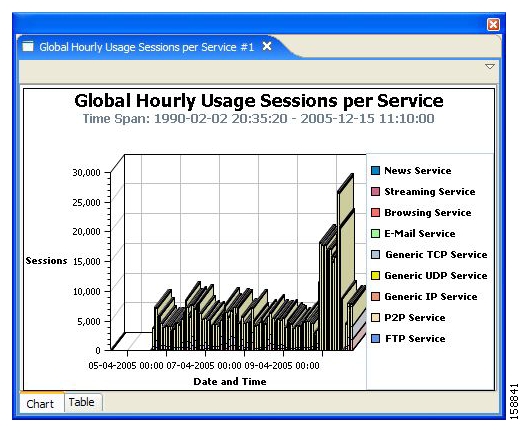
Traffic discovery reports provide raw statistics for analyzing network activities. They are useful for obtaining statistics on the general activity in the IP network, and are the key for the definition of the service configuration of the system.
The generation of traffic discovery reports is based on Transaction RDRs (generated by the SCE platform). These sampled RDRs provide the statistical information from which the various Traffic Discovery histograms and charts are created.
Traffic Discovery reports generate histograms and distribution charts that are grouped by the selected criteria and ordered by the selected order-parameter. For example: Top Protocols sorted by Total Volume, or Top Web-hosts sorted by Hit-Count.
Each report template focuses on a particular criterion based on Layers 3–7, such as:
Top Servers/Client IP addresses
Top Server/Client Port numbers
Top HTTP web-hosts
Top NNTP news-groups
Report templates focusing on statistics from Layers 3 and 4 (for example, IP addresses and port numbers) are found in Traffic Discovery - Statistics. Report templates focusing on application- and protocol-specific information are in Mail and News Reports.
The following is an example of a report on Top Servers that focuses on IP address.
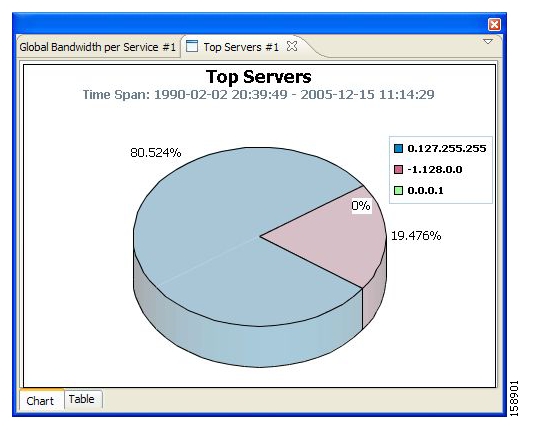
The order parameter indicates the parameter that the report will be sorted by. Available parameters are:
Total Volume—Extrapolated total volume (both upstream and downstream)
Upstream Volume—Extrapolated upstream volume
Downstream Volume—Extrapolated downstream volume
Hit-Counts—Extrapolated Number of transactions
You can limit each report to a specific number of results, which allows focusing on the top areas of activity (according to the selected order-parameter), as illustrated in the following two examples.
Top Newsgroups Ordered by Volume
Top Protocols Ordered by Volume
The Global Monitoring group of reports allows you to view statistics regarding the traffic bandwidth or volume that was consumed. The bandwidth/volume consumption can be presented per service for the entire link.
The Global Monitoring group includes the following report templates:
Global Bandwidth per Service—Shows the distribution of bandwidth among the different services defined in the system for all traffic, regardless of subscriber or package
Global Aggregated Usage Volume per Service—Shows the total volume of traffic (upstream and downstream) for each service counter (for all traffic, regardless of subscriber or package)
Global Hourly Usage Volume per Service—Shows the distribution of volume among the different service counters defined in the system, grouped by hour
Global Hourly Aggregated Minutes per Service—Shows the total number of minutes spent for service counters defined in the system, grouped by hour
Global Hourly Usage Sessions per Service—Shows the distribution of sessions among the different service counters defined in the system, grouped by hour
Global Concurrent Session per Service—Shows the distribution of concurrent sessions among the different service counters defined in the system
Global Daily Usage Sessions per Service—Shows the distribution of sessions among the different service counters defined in the system, grouped by day
Global Daily Usage Volume per Service—Shows the distribution of volume among the different service counters defined in the system, grouped by day
The Package Monitoring group of reports allows you to view statistics of bandwidth or volume of traffic used by a package. The reports are provided per service counter for the total volume used by the package. The volume consumption can be presented per service for the package.
The Package Monitoring group includes the following report templates:
Package Bandwidth per Service—Shows the distribution of bandwidth among the different service counters defined in the system for all subscribers belonging to a particular package
Package Aggregated Usage Volume per Service—Shows the total volume of traffic (upstream and downstream) for each service counter (for subscribers in a specific package)
Package Hourly Usage Volume per Service—Shows the distribution of volume among the different service counters defined in the system, for the traffic of subscribers in a specific package counter, grouped by hour
Package Hourly Aggregated Minutes per Service—Shows the total number of minutes spent for service counters for a specific package counter defined in the system, grouped by hour
Package Hourly Usage Sessions per Service—Shows the distribution of sessions among the different service counters defined in the system, for the traffic of subscribers in a specific package, grouped by hour
Package Concurrent Session per Service—Shows the distribution of concurrent sessions among the different Service Counters for a specific package counter defined in the system
Package Daily Usage Sessions per Service—Shows the distribution of sessions among the different service counters defined in the system, for the traffic of subscribers in a specific package counter, grouped by day
Package Daily Usage Volume per Service—Shows the distribution of volume among the different service counters defined in the system, for the traffic of subscribers in a specific package counter, grouped by day
The Subscriber Monitoring group of reports allows you to view statistics regarding the bandwidth or volume of traffic used by the subscriber. The reports are provided per service counter for the total volume consumed by the subscriber. The Top Subscribers report identifies the subscribers that consume the largest traffic volume. Subscriber bandwidth and volume reports are available for those subscribers configured for real-time monitoring. See “Selecting Subscribers for Real-Time Usage Monitoring” in the “Additional Management Tools and Interfaces” chapter of the Cisco Service Control Application for Broadband User Guide for a description of how to configure real-time subscribers.
The Subscriber Monitoring group includes the following report templates:
Top Subscribers—Shows a list of the top subscriber volume consumption in a specific hour/day
Subscriber Bandwidth per Service—Shows the distribution of bandwidth among the different service counters defined in the system for a particular subscriber
Subscriber Aggregated Usage Volume per Service—Shows the most popular Service counter for a particular subscriber
Subscriber Hourly Usage Volume per Service—Shows the hourly distribution of volume among the different service counters defined in the system for a particular subscriber
Subscriber Hourly Aggregated Minutes per Service—Shows the total number of minutes spent for service counters for a specific package counter defined in the system, grouped by hour
Subscriber Hourly Usage Sessions per Service—Shows the hourly distribution of sessions among the different service counters defined in the system for a particular subscriber
Subscriber Daily Usage Sessions per Service—Shows the daily distribution of sessions among the different service counters defined in the system for a particular subscriber
Subscriber Daily Usage Volume per Service—Shows the daily distribution of volume among the different service counters defined in the system for a particular subscriber
The Traffic Discovery - Statistics group of reports allows you to view statistics compiled from the source and destination IP addresses and ports of the system traffic.
Note
The reports in this group are not per subscriber; they supply general port and IP address information.
Table D.2. Parameter of the Traffic-Discovery Statistics Group only
|
Parameter |
Field Type |
Default |
Comments |
|---|---|---|---|
|
Traffic Parameters | |||
|
Transport Protocol |
Single choice |
TCP |
|
The Traffic Discovery - Statistics group includes the following report templates:
Top Servers—Shows the most popular servers for certain services
NoteServer refers to the IP address of the other side of the flow initiator. It may be located on the Subscriber side or on the Network side.Top Client—Shows the most popular client IP for certain services
NoteClient refers to the IP address of the flow initiator. It may be located on the Subscriber side or on the Network side.Top Server Ports—Shows the most popular server ports for certain services
Top Service Ports—Shows the most popular server ports of a certain service or services
Top Protocols—Shows the most popular protocol for certain services
Top IP Protocols—Shows the most popular IP protocol for certain services
Top Server IP to Server Port—Shows the most popular server IP to server port for certain services
Top Client IP to Server Port—Shows the most popular client IP to server port for certain services
Top Client IP to Server IP—Shows the most popular client IP to server IP for certain services
Top Client IP to Server IP and Server Port—Shows the most popular server IP and server port for certain services.
The Demographic Data and Service Popularity group of reports allows you to view statistics of the demographic data.
The Demographic Data and Service Popularity group includes the following report templates:
Global Active Subscriber per Service—Shows the distribution of subscribers among the different services defined in the system for all traffic, regardless of subscriber or package
Package Active Subscriber per Service—Shows the distribution of bandwidth among the different services defined in the system for specific subscriber package
Service Popularity among Subscribers—Shows the percentage of subscribers using a specific service defined in the system
Service Popularity among Subscribers of a Specific Package—Shows the percentage of subscribers using a specific service in a specific package defined in the system
Relative Consumption of Top Subscribers—Shows the relative consumption of a specific number of subscribers compared to “other”
Service Popularity among Subscribers (Average)—Shows the total number of subscribers using a specific service compared to subscribers using all other services
Service Popularity among Subscribers of a Specific Package (Average)—Shows the total number of subscribers using a specific service compared to subscribers using all other services in a specific package
The Web and Streaming group of reports allows you to compile statistics presenting the most popular servers or hosts for the various predefined system services (such as Browsing, Streaming, and Downloading) and for user-defined services.
Table D.3. Parameter of the Web and Streaming Group only
|
Parameter |
Field Type |
Default |
Comments |
|---|---|---|---|
|
Items to Focus on | |||
|
Where host contains |
Free Text |
(not set) |
Filter to hosts containing the given pattern. |
The Web and Streaming group includes the following report templates:
Top Web Hosts—Shows the most popular web servers
Top Rtsp Hosts—Shows the most popular real-time streaming protocol (RTSP) servers
Top FTP Servers—Shows the most popular FTP file hosts
Top MMS Servers—Shows the most popular MMS hosts
Top Service Servers—Shows the most popular servers of a certain service or services
Service Distribution by Subscriber Packages—Shows the most popular web servers, grouped by the package of the requesting subscriber
Rtsp Host Distribution by Subscriber Packages—Shows the most popular RTSP servers, grouped by the package of the requesting subscriber
FTP Server Distribution by Subscriber Packages—Shows the most popular FTP file servers, grouped by the package of the requesting subscriber
MMS Server Distribution by Subscriber Packages—Shows the most popular Microsoft Manager Server servers, grouped by the package of the requesting subscriber
Service Distribution by Subscriber Packages—Shows the distribution of service usage according to the subscriber packages
The Mail and News group of reports allows you to view statistics of the mail and news traffic.
The Mail and News group includes the following report templates:
Top SMTP Servers—Shows the most popular SMTP hosts
Top POP3 Servers—Shows the most popular POP3 hosts
Top NNTP Servers—Shows the most popular NNTP hosts
Top E-mail Sender—Shows the top e-mail sender
Top E-mail Recipients—Shows the top e-mail recipients
Top NNTP Consumers—Shows the top NNTP Consumers
Top Newsgroups—Shows the most popular newsgroups
SMTP Server Distribution by Subscriber Packages—Shows the most popular SMTP servers, grouped by the package of the requesting subscriber
POP3 Server Distribution by Subscriber Packages—Shows the most popular POP3 servers, grouped by the package of the requesting subscriber
NNTP Server Distribution by Subscriber Packages—Shows the most popular NNTP servers, grouped by the package of the requesting subscriber
Top Subscriber to Newsgroup—Shows the top subscriber to newsgroup for certain services
Top E-mail Account Owners—Shows the top e-mail account owners
The P2P group of reports allows you to view statistics of the P2P traffic.
The P2P group includes the following report templates:
Top P2P Protocols—Shows the most popular P2P protocol for certain services
Top P2P Consumers—Shows a list of the top P2P subscriber volume consumption
Top P2P Downloaders—Shows the top P2P download consumers
Top P2P Uploaders—Shows the most popular P2P upload consumers
Top P2P File Extensions—Shows the most popular P2P file extensions
The VoIP group of reports allows you to view statistics of the VoIP traffic.
The VoIP group includes the following report templates:
Global Bandwidth per VoIP Service—Shows the distribution of bandwidth among the different VoIP services defined in the system for all traffic, regardless of subscriber or package
Global Concurrent Calls per VoIP Service—Shows the distribution of concurrent sessions among the different VoIP service counters defined in the system, grouped by day
Global Hourly Call Minutes per VoIP Service—Shows the distribution of Call Minutes among the different VoIP service counters defined in the system, grouped by day
Package Bandwidth per VoIP Service—Shows the distribution of bandwidth among the different VoIP services defined in the system for the traffic of subscribers in a specific package
Packet Concurrent Calls per VoIP Service—Shows the distribution of concurrent sessions among the different VoIP service counters defined in the system, grouped by day
Package Hourly Call Minutes per VoIP Service—Shows the distribution of Call Minutes among the different VoIP service counters defined in the system, grouped by day
Subscriber Bandwidth per VoIP Service—Shows the distribution of bandwidth among the different VoIP services defined in the system for the traffic of subscribers in a specific package
Subscriber Hourly Call Minutes per VoIP Service—Shows the distribution of Call Minutes among the different VoIP service counters defined in the system, grouped by day
Top SIP Domains—Shows the most popular SIP Domains
Top Talkers—Shows a list of the top talker volume/session/minutes consumption in a specific hour/day for a specific/all VoIP services
The Malicious Traffic group of reports allows you to view statistics of the malicious events accrued in the system.
Table D.4. Parameters of the Malicious Traffic Group only
|
Parameter |
Field Type |
Default |
Comments |
|---|---|---|---|
|
Traffic Parameters | |||
|
IP protocol |
Single Choice |
(not set) |
|
|
Filter to port |
Free Text |
(not set) |
|
|
Detected IP side |
Single Choice |
(not set) |
|
The Malicious Traffic group includes the following report templates:
Global Scan or Attack Rate—Shows the rate (session/sec) of scan/attacks originating from the hosts (typically because of a worm or zombie)
Global DoS Rate—Shows the rate (sessions/sec) of DoS attacks on the targeted host
Top Scanning or Attacking Hosts—Shows the top hosts identified as DoS attacking
Top DoS Attacked Hosts—Shows the top DoS-attacked hosts
Infected Subscribers—Shows the distribution of infected subscribers over time among the different IP protocols in the system
DoS Attacked Subscribers—Shows the distribution of DoS-attacked subscribers over time among the different IP protocols defined in the system
Top DoS Attacked Subscribers—Shows the top DoS-attacked subscribers
Top Scanning or Attacking subscribers—Shows the top subscribers identified as DoS attacking
Top Scanned or Attacked Ports—Shows the top scanned or attacked ports