- Preface
- 1. General Overview
- 2. System Overview
- 3. Traffic Processing Overview
- 4. Getting Started
- 5. Using the Network Navigator
- 6. Using the Service Configuration Editor
- 7. Using the Service Configuration Editor: Traffic Classification
- 8. Using the Service Configuration Editor: Traffic Accounting and Reporting
- 9. Using the Service Configuration Editor: Traffic Control
- Managing Packages
- Unknown Subscriber Traffic
- Managing Rules
- Managing Bandwidth
- Managing Global Bandwidth
- Viewing Global Controller Settings
- Editing the Total Link Limits
- Adding Global Controllers
- Setting Maximum Bandwidth of Global Controllers
- Deleting Global Controllers
- Defining Global Controllers in a Dual-Link System
- Managing Subscriber Bandwidth
- Managing Bandwidth: a Practical Example
- Setting BW Management Prioritization Mode
- Managing Quotas
- 10. Using the Service Configuration Editor: Additional Options
- 11. Using the Subscriber Manager GUI Tool
- 12. Using the Signature Editor
- 13. Additional Management Tools and Interfaces
This preface describes who should read the Cisco Service Control Application for Broadband User Guide, how it is organized, its document conventions, and how to obtain documentation and technical assistance.
This guide assumes a basic familiarity with the concept of the Service Control solution, the Service Control Engine (SCE) platforms, and related components.
|
Cisco Service Control Release |
Part Number |
Publication Date |
|---|---|---|
|
Release 3.0.5 |
OL-7205-04 |
November, 2006 |
Description of Changes
Added the following new feature:
Added the following section to the document:
|
Cisco Service Control Release |
Part Number |
Publication Date |
|---|---|---|
|
Release 3.0.3 |
OL-7205-03 |
May, 2006 |
Description of Changes
Added the following new features:
Removed the following deprecated feature:
Attack Filtering and Subscriber Notification
Added the following section to the document:
Upgrading from Version 3.0.0 to Version 3.0.3
|
Cisco Service Control Release |
Part Number |
Publication Date |
|---|---|---|
|
Release 3.0.0 |
OL-7205-02 |
December, 2005 |
Description of Changes
Document name changed to Cisco Service Control Application for Broadband User Guide.
Both the look-and-feel and the functionality of the Cisco Service Control Application for Broadband (SCA BB) Console were redesigned for version 3.0. Consequently, this document underwent a major rewrite. The major changes in this document are listed below.
Appendixes B, C, D of the 2.5.5 release user guide were moved to a new document: the Cisco Service Control Application for Broadband Reference Guide.
Chapter 8 and Appendix A of the 2.5.5 release user guide were moved to a new document: the Cisco Service Control Application Suite Reporter User Guide.
The Cisco Service Control Application Suite for Broadband Installation Guide was deprecated; it forms the basis for part of the Getting Started chapter.
Chapter 5 of the 2.5.5 release user guide (Constructing Service Configurations) was completely rewritten and split into three chapters.
New chapters were added for the new tools included in the Console: the Network Navigator tool and the Signature Editor tool.
|
Release 2.5.5 |
OL-7205-01 |
February, 2005 |
Description of Changes
Created the Cisco Service Control Application Suite for Broadband User Guide.
This guide is intended for the administrator who is responsible for daily operation of the Cisco Service Control solution and who uses the many features of the Console to gain visibility into, and control over, the distribution of network resources.
This guide is organized as follows:
|
Chapter |
Title |
Description |
|---|---|---|
|
Chapter 1 |
Provides a general overview of the Cisco Service Control solution. | |
|
Chapter 2 |
Provides a functional overview of the Cisco Service Control solution. | |
|
Chapter 3 |
Provides a technical overview of the Cisco Service Control solution. | |
|
Chapter 4 |
Guides you through the process of installing or upgrading SCA BB and describes the concept of the Console as a collection of tools. | |
|
Chapter 5 |
Explains how to use the Network Navigator to create a model of all devices that are part of the Cisco Service Control solution and how to manage the devices remotely. | |
|
Chapter 6 |
Explains how to use the Service Configuration Editor to manage service configurations. | |
|
Chapter 7 |
Using the Service Configuration Editor: Traffic Classification |
Explains how to configure service configurations to perform traffic classification. |
|
Chapter 8 |
Using the Service Configuration Editor: Traffic Accounting and Reporting |
Explains how to configure service configurations to perform traffic reporting. |
|
Chapter 9 |
Explains how to configure service configurations to perform traffic control. | |
|
Chapter 10 |
Documents additional, advanced options available in the Service Configuration Editor. | |
|
Chapter 11 |
Explains how to use the SM GUI tool to configure subscribers on the SCMS-SM database. | |
|
Chapter 12 |
Documents the Signature Editor tool, which can create files for updating protocols in SCA BB. | |
|
Chapter 13 |
Documents and explains other tools that are available for use with SCA BB. |
The following publications are available for the Cisco Service Control Application for Broadband:
Cisco Service Control Application for Broadband Reference Guide
Cisco Service Control Application for Broadband Service Configuration API Programmer Guide
Cisco Service Control Management Suite Collection Manager User Guide
Cisco Service Control Management Suite Subscriber Manager User Guide
Cisco Service Control Application Reporter User Guide
The SCE platform installation and configuration guides:
Cisco SCE 1000 2xGBE Installation and Configuration Guide
Cisco SCE 2000 4xGBE Installation and Configuration Guide
Cisco SCE 2000 4/8xFE Installation and Configuration Guide
Cisco Service Control Engine (SCE) CLI Command Reference
Cisco Service Control Engine (SCE) Software Configuration Guide
This document uses the following conventions:
|
Convention |
Description |
|---|---|
|
boldface font |
Commands and keywords are in boldface. |
|
italic font |
Arguments for which you supply values are in italics. |
|
[ ] |
Elements in square brackets are optional. |
|
{x | y | z} |
Alternative keywords are grouped in braces and separated by vertical bars. |
|
[x | y | z] |
Optional alternative keywords are grouped in brackets and separated by vertical bars. |
|
string |
A nonquoted set of characters. Do not use quotation marks around the string, or the string will include the quotation marks. |
|
|
Terminal sessions and information that the system displays are in |
|
|
Information you must enter is in |
|
|
Arguments for which you supply values are in |
|
< > |
Nonprinting characters, such as passwords, are in angle brackets. |
|
[ ] |
Default responses to system prompts are in square brackets. |
|
!, # |
An exclamation point (!) or a pound sign (#) at the beginning of a line of code indicates a comment line. |
Note
Means reader take note. Notes contain helpful suggestions or references to materials not covered in this manual.
Caution
Means reader be careful. In this situation, you might do something that could result in loss of data.
The following sections provide sources for obtaining documentation from Cisco Systems.
You can access the most current Cisco documentation on the World Wide Web at the following sites:
Cisco documentation and additional literature are available in a CD-ROM package that ships with your product. The Documentation CD-ROM is updated monthly and may be more current than printed documentation. The CD-ROM package is available as a single unit or as an annual subscription.
Cisco documentation is available in the following ways:
Registered Cisco Direct Customers can order Cisco Product documentation from the networking Products MarketPlace:
Registered Cisco.com users can order the Documentation CD-ROM through the online Subscription Store:
Nonregistered Cisco.com users can order documentation through a local account representative by calling Cisco corporate headquarters (California, USA) at 408 526-7208 or, in North America, by calling 800 553-NETS(6387).
If you are reading Cisco product documentation on the World Wide Web, you can submit technical comments electronically. Click Feedback in the toolbar and select Documentation. After you complete the form, click Submit to send it to Cisco.
You can e-mail your comments to bug-doc@cisco.com.
To submit your comments by mail, use the response card behind the front cover of your document, or write to the following address:
Attn Document Resource Connection Cisco Systems, Inc. 170 West Tasman Drive San Jose, CA 95134-9883
We appreciate your comments.
Cisco provides Cisco.com as a starting point for all technical assistance. Customers and partners can obtain documentation, troubleshooting tips, and sample configurations from online tools. For Cisco.com registered users, additional troubleshooting tools are available from the TAC website.
Cisco.com is the foundation of a suite of interactive, networked services that provides immediate, open access to Cisco information and resources at any time, from anywhere in the world. This highly integrated Internet application is a powerful, easy-to-use tool for doing business with Cisco.
Cisco.com provides a broad range of features and services to help customers and partners streamline business processes and improve productivity. Through Cisco.com, you can find information about Cisco and our networking solutions, services, and programs. In addition, you can resolve technical issues with online technical support, download and test software packages, and order Cisco learning materials and merchandise. Valuable online skill assessment, training, and certification programs are also available.
Customers and partners can self-register on Cisco.com to obtain additional personalized information and services. Registered users can order products, check on the status of an order, access technical support, and view benefits specific to their relationships with Cisco.
To access Cisco.com, go to http://www.cisco.com.
The Cisco Technical Assistance Center (TAC) website is available to all customers who need technical assistance with a Cisco product or technology that is under warranty or covered by a maintenance contract.
If you have a priority level 3 (P3) or priority level 4 (P4) problem, contact TAC by going to the TAC website http://www.cisco.com/tac.
P3 and P4 level problems are defined as follows:
P3—Your network is degraded. Network functionality is noticeably impaired, but most business operations continue.
P4—You need information or assistance on Cisco product capabilities, product installation, or basic product configuration.
In each of the above cases, use the Cisco TAC website to quickly find answers to your questions.
To register for Cisco.com, go to http://tools.cisco.com/RPF/register/register.do.
If you cannot resolve your technical issue by using the TAC online resources, Cisco.com registered users can open a case online by using the TAC Case Open tool at http://www.cisco.com/tac/caseopen.
If you have a priority level 1 (P1) or priority level 2 (P2) problem, contact TAC by telephone and immediately open a case. To obtain a directory of toll-free numbers for your country, go to http://www.cisco.com/warp/public/687/Directory/DirTAC.shtml.
P1 and P2 level problems are defined as follows:
P1—Your production network is down, causing a critical impact to business operations if service is not restored quickly. No workaround is available.
P2—Your production network is severely degraded, affecting significant aspects of your business operations. No workaround is available.
This chapter provides a general overview of the Cisco Service Control solution. It introduces the Cisco Service Control concept and the Service Control capabilities. It also briefly describes the hardware capabilities of the Service Control Engine (SCE) platform and the Cisco specific applications that together compose the total Cisco Service Control solution.
The Cisco Service Control solution is delivered through a combination of purpose-built hardware and specific software solutions that address various service control challenges faced by service providers. The SCE platform is designed to support classification, analysis, and control of Internet/IP traffic.
Service Control enables service providers to create profitable new revenue streams while capitalizing on their existing infrastructure. With the power of Service Control, service providers have the ability to analyze, charge for, and control IP network traffic at multigigabit wire line speeds. The Cisco Service Control solution also gives service providers the tools they need to identify and target high-margin content-based services and to enable their delivery.
As the downturn in the telecommunications industry has shown, IP service providers’ business models need to be reworked to make them profitable. Having spent billions of dollars to build ever larger data links, providers have incurred massive debts and faced rising costs. At the same time, access and bandwidth have become commodities where prices continually fall and profits disappear. Service providers have realized that they must offer value-added services to derive more revenue from the traffic and services running on their networks. However, capturing real profits from IP services requires more than simply running those services over data links; it requires detailed monitoring and precise, real-time control and awareness of services as they are delivered. Cisco provides Service Control solutions that allow the service provider to bridge this gap.
Service providers of any access technology (DSL, cable, mobile, and so on) targeting residential and business consumers must find new ways to get maximum leverage from their existing infrastructure, while differentiating their offerings with enhanced IP services.
The Cisco Service Control Application for Broadband adds a new layer of service intelligence and control to existing networks that can:
Report and analyze network traffic at subscriber and aggregate level for capacity planning
Provide customer-intuitive tiered application services and guarantee application SLAs
Implement different service levels for different types of customers, content, or applications
Identify network abusers who are violating the Acceptable Use Policy
Identify and manage peer-to-peer, NNTP (news) traffic, and spam abusers
Enforce the Acceptable Use Policy (AUP)
Integrate Service Control solutions easily with existing network elements and BSS/OSS systems
The core of the Cisco Service Control solution is the purpose-built network hardware device: the Service Control Engine (SCE). The core capabilities of the SCE platform, which support a wide range of applications for delivering Service Control solutions, include:
Subscriber and application awareness—Application-level drilling into IP traffic for real-time understanding and controlling of usage and content at the granularity of a specific subscriber.
Subscriber awareness—The ability to map between IP flows and a specific subscriber in order to maintain the state of each subscriber transmitting traffic through the SCE platform and to enforce the appropriate policy on this subscriber’s traffic.
Subscriber awareness is achieved either through dedicated integrations with subscriber management repositories, such as a DHCP or a Radius server, or via sniffing of Radius or DHCP traffic.
Application awareness—The ability to understand and analyze traffic up to the application protocol layer (Layer 7).
For application protocols implemented using bundled flows (such as FTP, which is implemented using Control and Data flows), the SCE platform understands the bundling connection between the flows and treats them accordingly.
Application-layer, stateful, real-time traffic control—The ability to perform advanced control functions, including granular BW metering and shaping, quota management, and redirection, using application-layer stateful real-time traffic transaction processing. This requires highly adaptive protocol and application-level intelligence.
Programmability—The ability to quickly add new protocols and easily adapt to new services and applications in the ever-changing service provider environment. Programmability is achieved using the Cisco Service Modeling Language (SML).
Programmability allows new services to be deployed quickly and provides an easy upgrade path for network, application, or service growth.
Robust and flexible back-office integration—The ability to integrate with existing third-party systems at the Service Provider, including provisioning systems, subscriber repositories, billing systems, and OSS systems. The SCE provides a set of open and well-documented APIs that allows a quick and robust integration process.
Scalable high-performance service engines—The ability to perform all these operations at wire speed.
The SCE family of programmable network devices is capable of performing application-layer stateful-flow inspection of IP traffic, and controlling that traffic based on configurable rules. The SCE platform is a purpose-built network device that uses ASIC components and RISC processors to go beyond packet counting and delve deeper into the contents of network traffic. Providing programmable, stateful inspection of bidirectional traffic flows and mapping these flows with user ownership, the SCE platforms provide real-time classification of network usage. This information provides the basis of the SCE platform advanced traffic-control and bandwidth-shaping functionality. Where most bandwidth shaper functionality ends, the SCE platform provides more control and shaping options, including:
Layer 7 stateful wire-speed packet inspection and classification
Robust support for over 600 protocols and applications, including:
General—HTTP, HTTPS, FTP, TELNET, NNTP, SMTP, POP3, IMAP, WAP, and others
P2P file sharing—FastTrack-KazaA, Gnutella, BitTorrent, Winny, Hotline, eDonkey, DirectConnect, Piolet, and others
P2P VoIP—Skype, Skinny, DingoTel, and others
Streaming and Multimedia—RTSP, SIP, HTTP streaming, RTP/RTCP, and others
Programmable system core for flexible reporting and bandwidth control
Transparent network and BSS/OSS integration into existing networks
Subscriber awareness that relates traffic and usage to specific customers
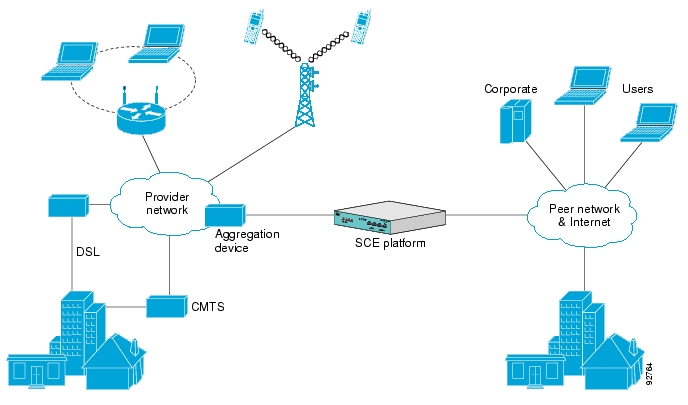
The following diagram illustrates a common deployment of an SCE platform in a network.
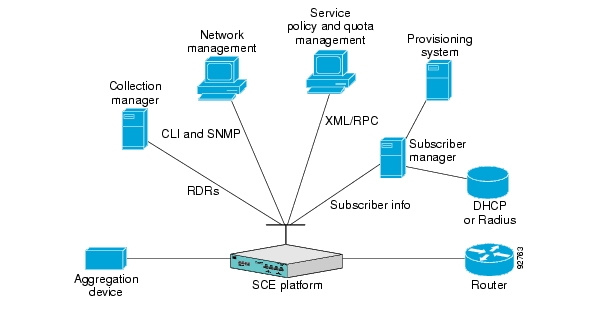
The Cisco Service Control solution includes a complete management infrastructure that provides the following management components to manage all aspects of the solution:
Network management
Subscriber management
Service Control management
These management interfaces are designed to comply with common management standards and to integrate easily with existing OSS infrastructure.
Cisco provides complete network FCAPS (Fault, Configuration, Accounting, Performance, Security) Management.
Two interfaces are provided for network management:
Command-line interface (CLI)—Accessible through the Console port or through a Telnet connection, the CLI is used for configuration and security functions.
SNMP—Provides fault management (via SNMP traps) and performance monitoring functionality.
Where the Cisco Service Control Application for Broadband (SCA BB) enforces different policies on different subscribers and tracks usage on an individual subscriber basis, the Cisco Service Control Management Suite (SCMS) Subscriber Manager (SM) may be used as middleware software for bridging between the OSS and the SCE platforms. Subscriber information is stored in the SM database and can be distributed between multiple platforms according to actual subscriber placement.
The SM provides subscriber awareness by mapping network IDs to subscriber IDs. It can obtain subscriber information using dedicated integration modules that integrate with AAA devices, such as Radius or DHCP servers.
Subscriber information may be obtained in one of two ways:
Push Mode—The SM pushes subscriber information to the SCE platform automatically upon logon of a subscriber.
Pull Mode—The SM sends subscriber information to the SCE platform in response to a query from the SCE platform.
Service configuration management is the ability to configure the general service definitions of a service control application. A service configuration file containing settings for traffic classification, accounting and reporting, and control is created and applied to an SCE platform. SCA BB provides tools to automate the distribution of these configuration files to SCE platforms. This simple, standards-based approach makes it easy to manage multiple devices in a large network.
Service Control provides an easy-to-use GUI to edit and create these files and a complete set of APIs to automate their creation.
The Cisco Service Control solution generates usage data and statistics from the SCE platform and forwards them as Raw Data Records (RDRs), using a simple TCP-based protocol (RDR-Protocol). The Cisco Service Control Management Suite (SCMS) Collection Manager (CM) software implements the collection system, listening in on RDRs from one or more SCE platforms and processing them on the local machine. The data is then stored for analysis and reporting functions, and for the collection and presentation of data to additional OSS systems such as billing.
The Cisco Service Control Application for Broadband (SCA BB) is the Cisco Service Control solution that allows broadband service providers to gain network-traffic visibility, to control the distribution of network resources, and thereby to optimize traffic in accordance with their business strategies. It enables service providers to reduce network costs, improve network performance and customer experience, and create new service offerings and packages.
The Cisco Service Control solution consists of four main components:
The Service Control Engine (SCE) platform—A flexible and powerful dedicated network-usage monitor that is purpose-built to analyze and report on network transactions at the application level.
For complete information regarding the installation and operation of the SCE platform, see the Cisco SCE Platform Installation and Configuration Guides.
The Service Control Management Suite (SCMS) Subscriber Manager (SM)—A middleware software component used where dynamic binding of subscriber information and policies is required. The SM manages subscriber information and provisions it in real time to multiple SCE platforms. The SM can store subscriber policy information internally, and act as a stateful bridge between the AAA system (such as Radius and DHCP) and the SCE platforms.
For complete information regarding the installation and operation of the SM, see the Cisco Service Control Management Suite Subscriber Manager User Guide.
The Quota Manager (QM) is an optional component of the Subscriber Manager. It enables Service Control solution providers to manage subscriber quota across subscriber sessions with a high degree of flexibility.
For complete information regarding the installation and operation of the QM, see the Cisco Service Control Management Suite Quota Manager Solution Guide.
The Service Control Management Suite (SCMS) Collection Manager (CM)—An implementation of a collection system that receives Raw Data Records (RDRs) from one or more SCE platforms. It collects usage information and statistics, and stores them in a database. The CM also converts subscriber usage information and statistics into simple text-based files for further processing and collection by external systems.
For complete information regarding the installation and operation of the CM, see the Cisco Service Control Management Suite Collection Manager User Guide.
The Service Control Application (SCA) Reporter—A software component that processes data stored by the CM and provides a set of insightful reports from this data. The SCA Reporter can run as a standalone or as an integrated part of the Console.
Together, the SCE platform, the SCMS-CM, the SCMS-SM, and the SCA Reporter are designed to support detailed classification, analysis, reporting, and control of IP network traffic. The SCMS-CM, the SCA Reporter, and the SCMS-SM are optional components; not all deployments of the Cisco Service Control solution require them. Sites that employ third-party collection and reporting applications, those that do not require dynamic subscriber-aware processing, and those that use a Radius or DHCP sniffing option may not require all of these components.
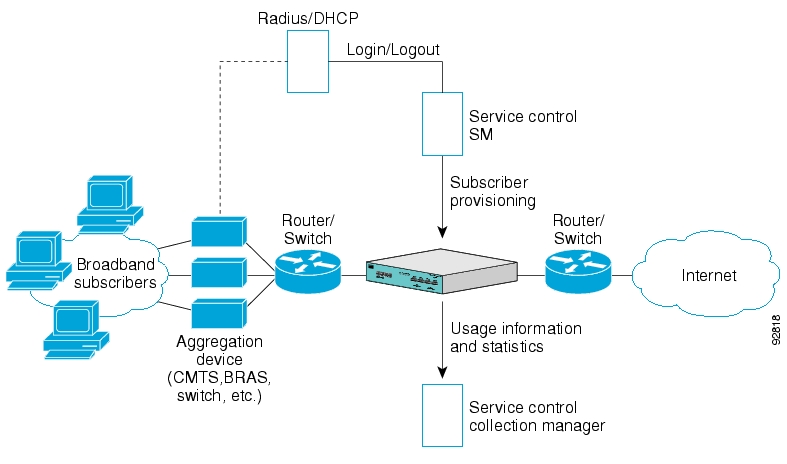
The following figure illustrates the flow of information in the Cisco Service Control solution.
Horizontal flow—Represents traffic between subscribers and an IP network.
The SCE platform monitors traffic flow.
Vertical flow—Represents transmission of the Raw Data Records (RDRs) from the SCE platform to the CM.
The SM may be added to the control flow to provide subscriber data. This allows SCA BB to conduct subscriber-level analysis and control.
One of the fundamental entities in the Cisco Service Control solution is a subscriber. A subscriber is the most granular entity on which SCA BB can individually monitor, account, and enforce a policy. In the most granular instance of the SCA BB system a subscriber, is an actual customer of the service provider on whom an individual policy is implemented. However, you can also to use SCA BB to monitor and control traffic at a higher granularity, such as when monitoring or controlling traffic by subnets or aggregation devices.
One of the most important decisions to be made when designing a service control solution is what subscribers in the system represent. This determines which subscriber mode will be used, which in turn determines what (if any) integrations are required and what policies to define. The following sections describe the different subscriber modes supported and, for each mode, the functions supported, any prerequisites, and the components needed.
SCA BB supports the following four subscriber modes:
Subscriberless mode—No subscribers are defined. Control and link-level analysis functions are provided at a global platform resolution.
Anonymous subscriber mode—IP addresses are controlled and monitored individually. The SCE platform automatically identifies IP addresses as they are used and assigns them to a package.
Static subscriber mode—Incoming IP addresses are bound and grouped statically into “subscribers” as configured by the system operator.
Subscriber-aware mode—Subscriber information is dynamically bound to the IP address currently in use by the subscriber. This can be achieved by integrating with the system (Radius, DHCP) that assigns IP addresses to subscribers, or by sniffing this information. Policy information is either administered to SCA BB directly or provisioned dynamically via an integration.
Subscriberless mode is the choice for sites where control and analysis functions are required only at a global platform resolution. It can be used, for example, to monitor and control the total P2P traffic over the link.
Subscriberless mode requires no integration; hence the SCMS-SM is not required.
Note
Subscriberless mode is not influenced by the number of subscribers or inbound IP addresses Thus the total number of subscribers using the monitored link is unlimited from the perspective of the SCE platform.
Anonymous subscriber mode provides the means to analyze and control network traffic at subscriber-inbound IP address granularity. Use this mode when you do not require subscriber-differentiated control or subscriber-level quota tracking, when analysis on an IP level is sufficient, or when offline IP-address/subscriber binding can be performed. For example, you can identify which subscribers generate the most P2P traffic by identifying the top IP addresses and correlating them to individual subscribers using Radius or DHCP logs. The total bandwidth of P2P traffic allowed for each subscriber can also be limited.
Anonymous subscriber mode requires no integration or static configuration of the IP addresses used, so the SCMS-SM is not required. Rather, ranges of IP addresses are configured directly on the SCE platform, for which the system dynamically creates “anonymous” subscribers, using the IP address as the subscriber name.
Note
The total number of concurrently active anonymous subscribers supported by the SCE platform is the same as the total number of concurrently active subscribers.
Static subscriber mode binds incoming IP addresses together into groups, so that traffic from and to defined subscribers can be controlled as a group. For example, you can define all traffic from and to a particular network subnet (used by multiple subscribers concurrently) as a (virtual) “subscriber” and controlled or viewed as a group.
Static subscriber mode supports cases in which the entity controlled by the Cisco Service Control solution uses a constant IP address or address range that does not change dynamically, such as:
Environments where the subscriber IP addresses do not change dynamically via, for example, DHCP or Radius
Deployments in which a group of subscribers using a common pool of IP addresses (such as all those served by a particular aggregation device) will be managed together to provide a shared bandwidth to the entire group
The system supports the definition of static subscribers directly on an SCE platform; it does not require external management software (such as the SCMS-SM). Use the SCE platform CLI to define the list of subscribers, their IP addresses, and the associated package.
In subscriber-aware mode, the SCE is populated by subscriber information (OSS ID and policy) that is dynamically bound to the (IP) address currently in use by the subscribers. Regardless of the IP address in use, this provides differentiated and dynamic control per subscriber and subscriber-level analysis. Use this mode to control and analyze traffic on a subscriber level, to monitor subscriber usage, and to assign and enforce different control policies (packages) for different subscribers.
In this mode, the SCMS-SM may provision the SCE platform with subscriber information.
The following table summarizes the different subscriber modes supported by the system.
Table 2.1. Summary of Subscriber Modes
|
Mode |
Features Supported |
Main Advantages |
Use for ... |
|---|---|---|---|
|
Subscriberless mode |
|
No subscriber configuration required. |
Global control solution or subscriber-level analysis. Examples:
|
|
Anonymous subscriber mode |
|
|
IP-level analysis or control that is not differentiated per subscriber, and where offline IP-address/subscriber binding is sufficient. Examples:
|
|
Static subscriber mode |
|
|
Control of traffic of groups of subscribers. Example:
|
|
Subscriber-aware mode |
|
|
Control and analysis of traffic on a subscriber level. Examples:
|
Service configuration defines the way the SCE platform analyses and controls traffic. In very general terms, service configuration defines the following:
Protocol and service classification
Packages and policies
Bandwidth controllers
Global controllers
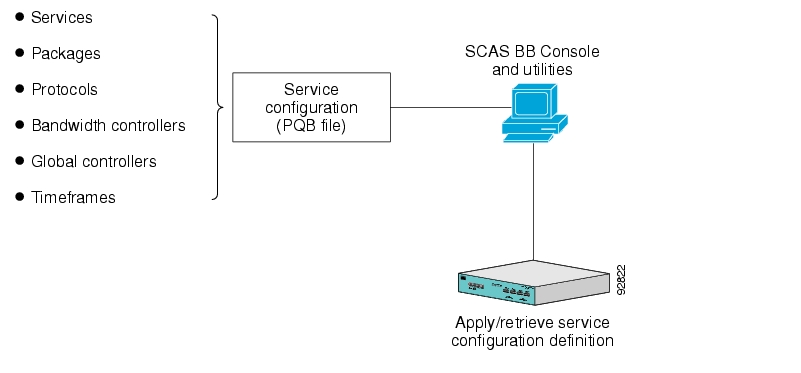
Service configuration is accomplished using one of the following:
The Console
The SCA BB Service Configuration Utility
The Service Configuration API
The Console is a set of GUI tools that are used to manage, configure, and monitor the solution components.
The Console is fully documented in the remainder of this guide.
The SCA BB Service Configuration Utility (servconf) is a simple command-line utility that you can use to apply PQB configuration files onto SCE platforms or to retrieve the current configuration from an SCE platform and save it as a PQB file. The utility configures SCE platforms with the service configuration defined in a PQB file. You can install and execute it in a Windows or Solaris environment
For full documentation of servconf, see The SCA BB Service Configuration Utility.
The Service Configuration API is a set of Java classes used to:
Program and manage service configurations
Apply service configurations to the SCE platforms
Integrated applications with third-party systems
This allows service providers to automate and simplify management and operational tasks.
The Service Configuration API is documented in the Cisco SCA BB Service Configuration API Programmer’s Guide.
This chapter describes how the Cisco Service Control Application for Broadband (SCA BB) installed on a Service Control Engine (SCE) platform processes traffic.
The chapter also defines the main elements (service configuration entities) of the SCA BB system and explains how they relate to each other.
There are three stages of traffic processing:
Traffic classification—SCA BB analyses traffic flows and determines their type (for example, browsing, e-mail, file sharing, or voice).
Traffic accounting and reporting—SCA BB performs bookkeeping and generates Raw Data Records (RDRs) that let you analyze and monitor the network.
Traffic control—SCA BB limits and prioritizes traffic flows according to their service, subscriber-package, subscriber quota state, and so on.
These three stages are described in the following sections.
You control how classification, reporting, and control are performed by editing service configurations and applying them to the SCE platform.
Traffic processing starts with traffic classification, which categorizes network sessions into services.
For each commercial service that a provider offers to its subscribers, a corresponding service is defined in the Cisco Service Control solution. You can use this service to classify and identify the traffic, report on its usage, and control it.
In the traffic classification process, SCA BB categorizes network sessions into services.
Services are the building blocks for:
Service configurations (because SCA BB can enforce different rules on different services)
Aggregated usage reporting
From a provider’s perspective, a service is a network product sold to a subscriber. The service is usually a network application—such as browsing, e-mail, file sharing, or voice—that the subscriber uses. From a technical perspective, a service consists of one or more service elements, each of which enables a decision about the service associated with a network traffic flow type.
A number of services are predefined in the default service configuration (these services are listed in the “Default Service Configuration Reference Tables” chapter of the Cisco Service Control Application for Broadband Reference Guide). You can modify these services and add additional services to a service configuration.
A service configuration can contain up to 500 services.
The classification process occurs when a session starts. The process examines the first few packets of the session and decides to which service the session belongs. The session is then assigned a service ID that remains the same during the session’s life cycle.
Traffic is classified and mapped to services on the basis of some or all of the following service elements:
Protocol—The protocol used. This allows, for example, the mapping of browsing flows and e-mail flows to separate services.
Initiating side—Whether the subscriber side or the network side generated the flow. This allows, for example, the mapping of subscriber-initiated and network-initiated peer-to-peer traffic to separate services.
Zone—Lists of IP addresses of the network-side host of the flow. This allows, for example, the mapping of all voice flows going to a specified server to a specific service.
Flavor—Specific Layer 7 properties such as host names of the network-side host of the flow. This allows, for example, the mapping of all HTTP flows where the URL matches a certain pattern to a specific service.
SCA BB uses these flow mappings to map each network connection passing through it to a service. You define rules for the different services to implement control policies. The classification rules can contain Layer 3 and Layer 4 parameters (such as port numbers and IP addresses), and also Layer 7 parameters (such as host name and user agent for HTTP connections).
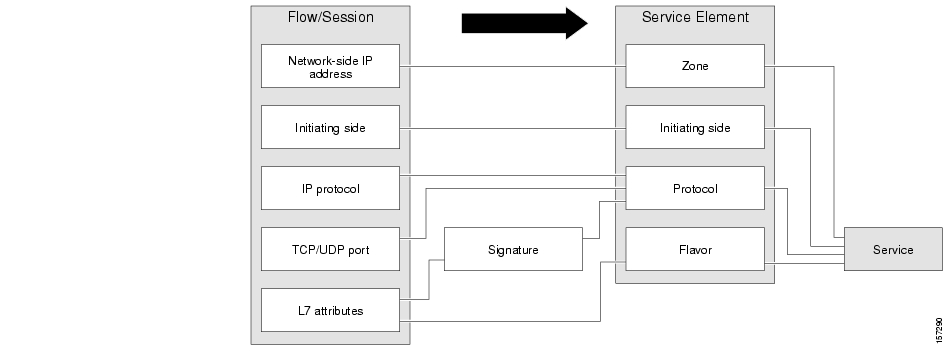
A service consists of one or more service elements; different network traffic flow types are mapped to different service elements.
A service element maps a specific protocol, initiating side, zone, and flavor to the selected service. Some or all of these parameters can take wild-card values.
A traffic flow is mapped to a specific service if it meets all four of the following criteria:
The flow uses the specified protocol of the service element.
The flow matches the initiating side specified for the service element.
The destination of the flow is an address that belongs to the specified zone of the service element.
The flow matches the specified flavor of the service element.
Note
If a flow matches two service elements and one is more specific than the other, the flow will be mapped to the more specific of the two.
For example: Service A is defined for browsing and Service B is defined for browsing to a specific list of URLs. A browsing flow to a URL on Service B’s list matches both services, but will be mapped to Service B.
If a flow matches one parameter of one service element and a different parameter of another service element, precedence will be given first to matching flavors, then to protocols, then to zones, and finally to the initiating side.
For example: Service A is defined for e-mail and Service B is defined for all traffic to a specific network zone. An e-mail flow to the specific network zone matches both services, but will be mapped to Service A.
The following table contains examples of services and their network parameters.
Table 3.1. Examples of Services and Service Parameters
|
Service Name |
Protocol |
Initiating Side |
Zone |
Flavor |
|---|---|---|---|---|
|
Web Browsing |
HTTP HTTPS |
Subscriber-initiated |
* |
* |
|
Web Hosting (network-initiated browsing) |
HTTP HTTPS |
Network-initiated |
* |
* |
|
Local SMTP |
SMTP |
* |
Local-mail servers (215.53.64.0/24) |
* |
One of the main classifications of a flow is the protocol of a session (that is, of the network application that generated the session).
A protocol, as defined in the SCA BB system, is a combination of one or more signatures, one or more port numbers, and a transport type. The protocol of the network flow is identified according to these parameters. For example, if the port number is 80, the transport type is TCP, and content matches the HTTP signature, SCA BB maps the flow to the HTTP protocol.
The default service configuration contains a long list of predefined protocols. You can add additional protocols.
When a TCP or UDP flow does not match a specific protocol definition, SCA BB maps the flow to the Generic TCP or Generic UDP protocol.
When a non-TCP/UDP flow does not match a specific protocol definition, SCA BB maps the flow to the Generic IP protocol.
A protocol is a collection of protocol elements.
A protocol element maps a specific signature, IP protocol, and port range to the selected protocol. Some or all of these parameters can take wild-card values; port numbers can take range values.
A traffic flow is mapped to a specific protocol if it meets all three of the following criteria:
The flow matches the specified signature of the protocol element.
The flow protocol matches the IP Protocol of the protocol element.
The flow matches the specified port range of the protocol element.
Note
If a flow matches two protocol elements and one is more specific than the other, the flow will be mapped to the more specific of the two.
For example: Protocol A is defined for flows that match the FTP signature and Protocol B is defined for flows that match the FTP signature on TCP port 21. An FTP flow on port 21 matches both protocols, but will be mapped to Protocol B.
If a flow matches the signature of one protocol element and the port of another protocol element, it will be mapped to the matching signature.
For example: Protocol A is defined for flows that match the FTP signature and Protocol B is defined for flows on TCP port 21. An FTP flow on port 21 matches both protocols, but will be mapped to Protocol A.
SCA BB examines traffic flows using the SCE platform’s deep-packet-inspection capabilities, and compares each flow with an installed set of protocol signatures to identify the network application that generated the flow.
SCA BB comes with a set of predefined signatures for common network applications and protocols, such as browsing, e-mail, file sharing, and VoIP.
Cisco periodically publishes protocol packs containing new signatures and updates to existing signatures. You can use these protocol packs to update the set of signatures installed on SCA BB, enhancing its classification capabilities.
Most signatures used by SCA BB are predefined and hard-coded. SCA BB also allows you to add dynamic signatures, which can be user-defined.
You can create and edit dynamic signatures in the Signature Editor tool. The Dynamic Signature Script (DSS) engine in SCA BB carries out the classification using these user-defined signatures in addition to the predefined signatures.
The SCE platform is usually located between the provider’s subscribers and the network. Subscriber-initiated flows are initiated by the subscriber toward the network; network-initiated flows are initiated from the network toward the subscriber.
You can limit some flow-types to one initiating side. For example, with HTTP you can restrict the direction of the flow to subscriber-initiated, because HTTP is always subscriber-initiated when the subscriber ventures outward to surf the Internet. If the direction of the HTTP flow is network-initiated, this probably means that a web server is open on the subscriber’s local machine for receiving incoming HTTP traffic. The provider can block network-initiated HTTP.
A zone is a collection of network-side IP addresses.
Zones are configured by the user who arranges IP addresses in groups connected by a common purpose. A subscriber’s network flow mapped to a service may be applied to a zone. In practice, zones often define geographical areas.
Zones are used to classify network sessions; each network session can be assigned to a service element based on its destination IP address.
Examples of zones:
A “walled garden”—A range of IP addresses of a server farm with premium video content, for which the provider would like to limit access to specific subscribers and to assure traffic priority.
A zone to differentiate between off-net and on-net flows.
Example of assigning a zone to a session:
Zone A and Zone B are two user-defined zones. Zone A includes the IP address range 10.1.0.0/16, and Zone B includes the IP address range 10.2.0.0/16. Analysis of a new session shows that its network IP address is 10.1.1.1—the session belongs to zone A.
A zone is a collection of related zone items.
A zone item is an IP address or a range of IP addresses.
Table 3.2. Examples of Zone Items
|
Network Address |
Example |
|---|---|
|
IP address |
123.123.3.2 |
|
IP address range (and mask) |
123.3.123.0/24 This means that the first 24 bits of the IP address must be included as specified and the final 8 bits can take any value. (That is, all IP addresses in the range 123.3.123.0 to 123.3.123.255.) |
Flavors are advanced classification elements that are used to classify network sessions according to signature-specific Layer 7 properties.
Flavors provide an additional level of granularity in defining services in the Cisco Service Control solution. A protocol flavor uses an additional protocol attribute in classifying a service, making this service a flavor of the service based on the protocol only. For example, the user-agent attribute of the HTTP protocol could be added as a protocol flavor, enabling the definition of all HTTP traffic generated by the same browser type (indicated in the user-agent field) as one service.
Examples of flavor types are HTTP User Agent and SIP Source Domain.
A flavor is a collection of flavor items.
The type of a flavor item depends on the flavor type. For a list of available flavor types, see Flavor Types and Parameters.
The default service configuration includes some predefined flavors, such as HTTP Streaming Agents (a flavor of HTTP) and Vonage (a flavor of SIP).
Content filtering involves classification and control of HTTP flows according to the requested URL. The classification of the URL is performed by accessing an external database.
Service providers require effective Web filtering for their subscribers, for various purposes such as avoiding litigation and providing parental control. The problem is that the Web is huge and constantly growing, and SCA BB and the SCE Platform are not designed to track and maintain the huge database of URLs that is required for effective filtering.
SCA BB provides content filtering by integrating with SurfControl Content Portal Authority (CPA). SurfControl’s technology enhances SCA BB URL classification capabilities by eliminating the need for a network administrator to manage a URL database or interact with the server, while creating a powerful filtering solution. It provides complete coverage of the Web’s most trafficked sites and access to the most accurate and relevant database of URLs classified by risk category, such as sexually explicit, racist, hacker, and so forth.
The integration of SurfControl’s CPA into SCA BB provides the required web-filtering solution. SCA BB, running on the SCE Platform, contacts a CPA server to categorize the web site that a subscriber requests. The returned category is then used to classify the HTTP flow. This classification is then used for the normal SCA BB traffic control and reporting.
Note
SCA BB includes an internal database of URLs that is used by the HTTP URL flavor classification. When a URL is found in both the internal database and the external content filtering database, the URL is classified according to the internal database.
You can use data gathered by the SCE platforms for real-time signaling, billing, and reporting.
Various metrics are collected in different scopes—global (per entire link), per service (or group of services), per package (or group of packages), and per subscriber—based on user-defined counters.
Note
Global control bandwidth is based on Layer 1 volume.
Subscriber bandwidth control (and accounting and reporting) is based on Layer 3 volume.
The values from the counters can be either pushed or pulled:
The SCE platform generates and transmits Raw Data Records (RDRs) that contain flow, usage, and other data.
The SCE platform maintains an SNMP MIB that can be queried by external systems.
SCA BB collects and maintains various network metrics, per service, in different scopes.
The network metrics are:
Upstream volume (L3 kilobytes)
Downstream volume (L3 kilobytes)
Sessions
Active subscribers
Concurrent sessions
Session duration
Note
For VoIP services, such as SIP and MGCP, the concurrent sessions counter counts concurrent voice calls, and the session duration counter measures voice call duration.
Per service accounting takes place in the following scopes:
Per subscriber
Per group of subscribers (package)
Per link (global)
Several services may share the same service counter. For example, in the default service configuration, the SMTP service and the POP3 service share the E-Mail Counter. The assignment of services to counters is determined by the service hierarchy, as explained in the following section. Similarly, several packages may share the same package counter, and the assignment of packages to counters is determined by the package hierarchy.
Services are arranged in a hierarchal tree. A single default service is at the root, and you can place each new service anywhere in the tree.
Services inherit the rule of their parents. When a rule is defined for a particular service (in a specific package), all its child services are controlled by the same rule for that package, unless explicitly specified.
The service hierarchy provides a way to share usage counters and to organize services according to their semantics. Services are accounted in groups, as defined in the service hierarchy. Each service is assigned usage counters.
There are two categories of usage counters for services:
Global—Used for Link and Package RDRs and reports
Subscriber—Used for Subscriber RDRs and reports
A global counter and a subscriber counter are assigned to each service. The use of a service can be accounted either exclusively for traffic classified to it or in conjunction with the traffic of its parent service. For example, if a service called Premium Video Content is defined as a child of Streaming, the operator can either define a special usage counter for Premium Video Content or configure it to use the same counter as Streaming. The global counter and the subscriber counter are independent; for the same service, one counter may be the same for parent and child, whereas the other is exclusive to the child.
Packages are arranged in a hierarchal tree. A single default package is the root of the tree, and you can place new packages anywhere in the tree.
The package hierarchy allows you to organize packages according to their semantics and provides for sharing package usage counters. You can define a maximum of 1024 different exclusive package counters per service configuration, one of which is used for the Unknown Subscriber Traffic package.
Usage reporting at a package level is grouped as follows:
Package assigned an exclusive package counter—All traffic associated with this package is accounted separately in the assigned counter, along with any children that are not assigned exclusive counters.
Package NOT assigned an exclusive package counter—All traffic associated with this package is accounted together with its parent package.
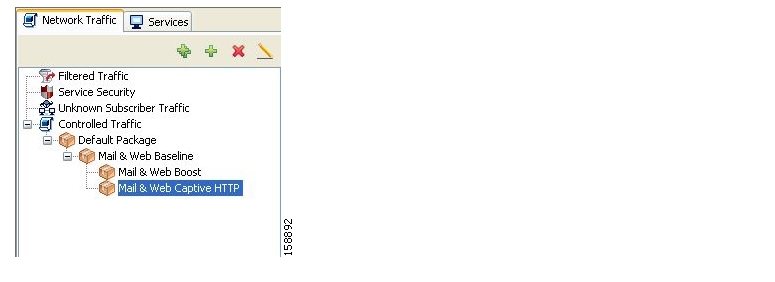
For example, in the sample package tree shown in the following figure, if the Mail & Web Baseline package is allocated an exclusive counter, but none of its child packages are, then all Package Usage RDRs and the derived reports (such as “Package Bandwidth per Service”) would group together usage of subscribers assigned to all three packages.
On the other hand, if the Mail & Web Boost package also had an exclusive counter, the traffic for Main & Web Baseline and Mail & Web Captive HTTP would be accounted together, but traffic for Mail & Web Boost would be accounted separately. (In general this is not an efficient configuration. You should use the hierarchical structure to group packages that can share the same counter.)
SCE platforms running SCA BB generate and transmit Raw Data Records (RDRs) that contain information relevant to the service provider.
RDRs contain a wide variety of information and statistics, depending on the configuration of the system. The following are the main categories of RDRs:
Usage RDRs—Generated periodically. These RDRs contain the state of the usage counters, per service and per accounting scope. There are four types of usage RDRs:
Link Usage RDRs—Global usage per service, for the entire link.
Package Usage RDRs—Usage per group of subscribers, per service.
Subscriber Usage RDRs—Usage per subscriber, per service. These RDRs are generated for all subscribers. The Cisco Service Control Management Suite (SCMS) Collection Manager (CM) and Cisco Service Control Application (SCA) Reporter use these RDRs to generate top-subscriber reports and aggregated usage billing records.
Real-Time Subscriber Usage RDRs—Generated for specific subscribers selected by the user. The SCMS-CM and SCA Reporter use these RDRs by to generate detailed subscriber activity reports.
Transaction RDRs—Generated for a sample of the flows. These RDRs are used to create statistical histograms such as Top TCP Ports.
Transaction Usage RDRs—Generated for every flow according to user-defined filters. These RDRs contain detailed Layer 7 information for browsing, streaming, and voice flows. They are used for flow-based billing.
Real-Time Signaling RDRs—Generated to indicate specific network events such as flow start or end. These RDRs are used to signal external systems to allow real-time actions across the network.
Malicious Traffic RDRs—Generated to indicate that the SCE platform has detected a traffic anomaly, such as a DDoS attack.
Traffic Control provides means to block, limit, or prioritize traffic flows according to service, subscriber package, subscriber quota state, and so on.
A package is a collection of rules describing subscriber policy. The package defines the group of services delivered to a specific group of subscribers and the system’s behavior for each service. It may contain restrictions on network flows, guidelines for flows’ prioritization, and instructions regarding how to report flows.
Each subscriber in the network is provided a reference to a package to which that subscriber belongs. The system:
Maps each network flow to a service by matching the flow with a service element
Identifies the subscriber to whom the flow pertains, according to the subscriber’s network ID (usually the subscriber’s IP address)
Identifies the package to which the subscriber belongs
Applies the correct rule to the service of the subscriber’s network flow
The SCE platform tries to identify the subscriber responsible for every traffic flow that it processes. The platform looks at the IP address or VLAN tag of the traffic flow, and checks its internal database for a subscriber that is identified by this IP Address or VLAN tag. If such a subscriber is not found in the database, the traffic flow is mapped to the Unknown Subscriber Traffic category.
A rule is a set of instructions that tell the SCE platform how to treat network flows of a specific service. A rule may:
Specify that a flow should be blocked or be granted a certain amount of bandwidth
Define an aggregate volume or session limit, after which a set of different restrictions will be enforced on the flow
Specify how a flow will be reported for billing or analysis purposes
Calendars are used to split the hours of the week into four time frames.
After you have configured a calendar, you can add time-based rules to a package that is using the calendar.
Each service configuration includes one default calendar. You can add nine more calendars, each with a different time-frame configuration. You can use different calendars for different packages. They can also be used where a service provider has customers in more than one time zone.
A time-based rule is a rule that applies to only one time frame. Time-based rules allow you to set rule parameters that will only apply at specific times. You might, for example, want to define different rules for peak, off-peak, nighttime, and weekend usage.
You can add time-based rules to any rule. If a time-based rule is not defined for a time frame, the parent rule is enforced.
Often, you will want the rules for the different time frames to be similar. When you add a time-based rule, the settings of the parent rule are copied to the new time-based rule; you can make any needed changes. Subsequent changes to the parent rule do not affect the time-based rule.
The physical link bandwidth is an absolute limit on the bandwidth that can pass through the system. You can limit the total bandwidth passing through the SCE platform even further. For example, if another device sitting next to the SCE platform on the IP stream has limited BW capacity, you can limit the bandwidth passing through the SCE platform to match the capacity of the other device.
Bandwidth control in SCA BB is accomplished in two stages:
Global control
Subscriber bandwidth control
Note
Global control bandwidth is based on Layer 1 volume.
Subscriber bandwidth control (and accounting and reporting) is based on Layer 3 volume.
Total bandwidth use is controlled by global controllers. Global controllers are virtual queues in SCE platforms. You configure them for the entire system, rather than for individual subscribers.
Global controllers provide constraints for large, global volumes of traffic, such as “Total Gold Subscriber Traffic”, or “Total P2P Traffic”. Each global controller defines the maximum percentage of total available bandwidth allocated to all traffic of a particular type. Using a global controller, you can limit total traffic of services such as P2P in the system to any desired percentage of the total available bandwidth. In this way, you keep the total bandwidth consumed by this traffic under control.
The upstream and downstream interfaces are each assigned one default global controller that, by default, controls 100% of the link traffic. You can add up to 1023 more global controllers for each interface, and you can assign a maximum percentage of the total link limit to each global controller separately.
For each global controller, you can define separate values for the maximum percentage of total available bandwidth separately for each time frame. (See Calendars.)
In dual-link systems you can define different bandwidth values for each link. You can also set a limit on the aggregated bandwidth passing on the two links.
Bandwidth used by individual subscribers is controlled by Subscriber BW Controllers (BWCs). Each BWC controls available bandwidth for selected services. Services controlled by a particular BWC are defined per package, but bandwidth control is per service.
A BWC is specified by the following parameters:
Committed Information Rate (CIR)—The minimum bandwidth that must be granted to the services that are controlled by the BWC
Peak Information Rate (PIR)—The maximum bandwidth that will be allocated to the services that are controlled by the BWC
Global Controller—The global controller to which this BWC links
Assurance Level (AL)—The rate of change of available bandwidth under conditions of traffic congestion
PIR may be thought of as the “width” of the virtual pipe, where the pipe is flexible and can adjust in width. CIR is the minimum width to which the pipe can contract. During network congestion, the system contracts each pipe differently to differentiate between subscribers and between their services.
The pipe width in this analogy defines the total bandwidth (Admitted Information Rate (AIR)) that is allowed to cross the pipe. AIR ranges between CIR and PIR. The consumed bandwidth (UIR) is the rate that currently flows through the BWC and it is always less than AIR.
It might be that the traffic associated with the BWC does not consume much bandwidth at a particular point in time. However, where there is a growing demand for bandwidth, the BWC ensures that at least the CIR is granted, even in conditions of network congestion (PIR-congestion). Similarly, the BWC ensures that no matter of congestion conditions, the traffic associated with a BWC would always be below the PIR limit.
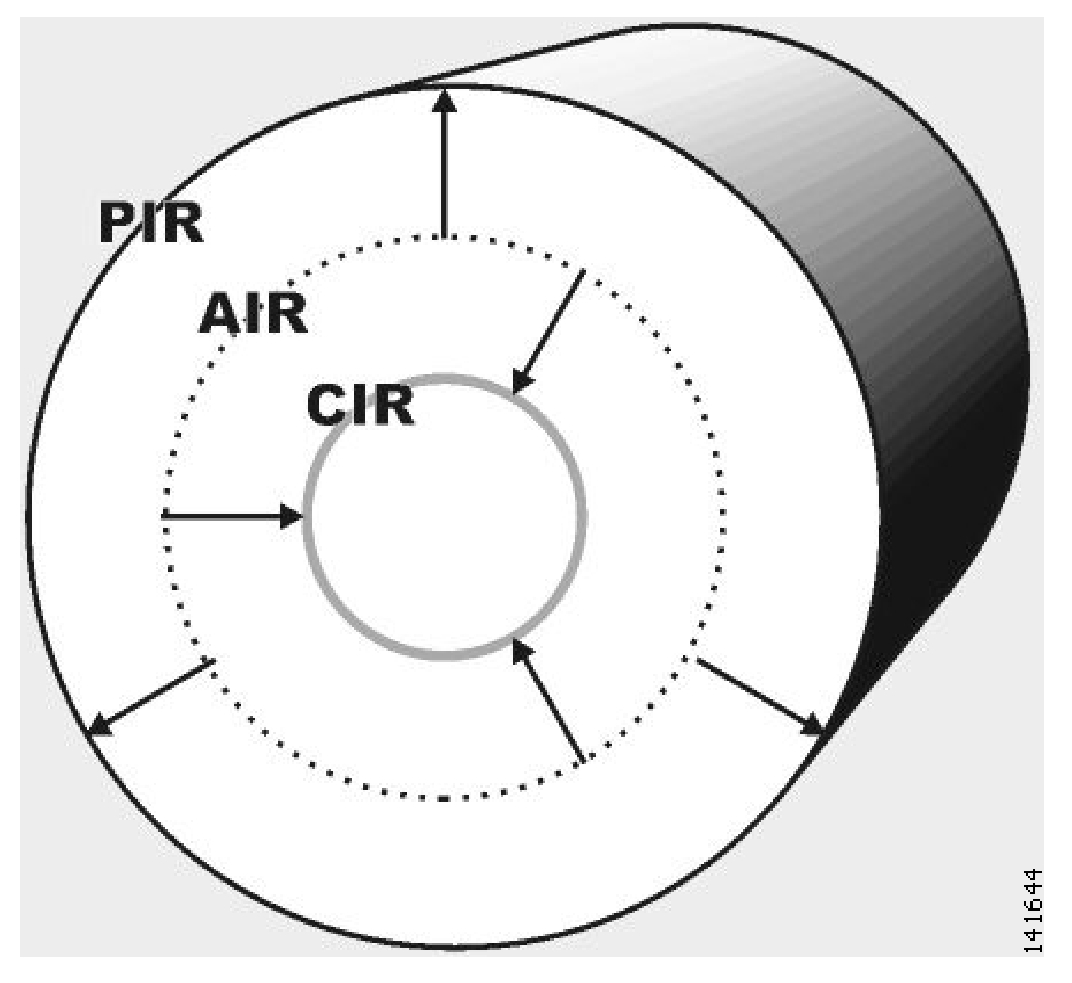
In the preceding figure, the small circle indicates CIR. The big circle indicates PIR. The dashed circle indicates AIR—the maximum rate currently allowed to flow through the BWC: CIR < AIR < PIR. UIR—the rate that currently flows through the BWC—can be smaller than CIR: 0 < UIR < AIR.
The BWC has a third parameter that controls how AIR is determined at different congestion conditions. As indicated, when the network is not congested the system allows PIR and when the network is highly congested the system provides CIR. In between these two extremes, the AIR is determined by a third parameter—Assurance Level (AL). AL controls how fast AIR would decrease from PIR to CIR as congestion builds, or increase from CIR to PIR as congestion decreases. A higher AL ensures a higher AIR compared to a similar BWC with a lower AL.
Subscriber BWCs enforce bandwidth at two levels:
The first level, Primary (Total) BWC, specifies bandwidth service configurations that the provider enforces on its subscribers.
The second level, (Internal) BWC, specifies service configurations that the subscriber wants to enforce on its services.
SCA BB provides each subscriber with an independent set of BWCs. A single BWC, the Primary BWC (tBWC), controls the total bandwidth of the subscriber. The other BWCs control the bandwidth of some services of that subscriber. For example, one BWC may control the Streaming Service; another may control the Download and E-mail Services together. These BWCs, which provide second-level control, are referred as iBWCs.
PIR defines the upper limit for the associated services. CIR defines a minimum rate for these services. The system ensures that this minimum is granted under conditions that will be described later.
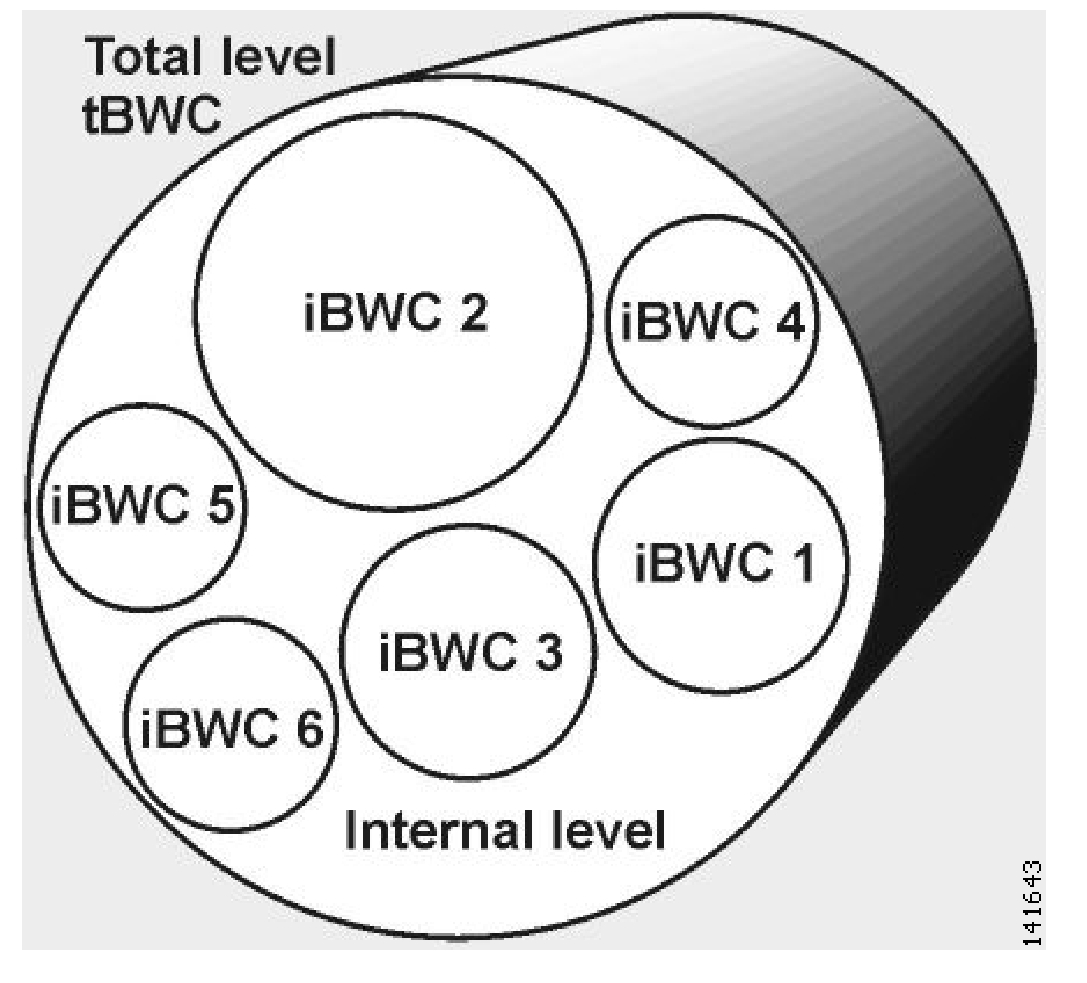
The primary BWC (tBWC) controls the total bandwidth of the subscriber. iBWCs control the bandwidth of portions of this bandwidth that are associated with one or more services.
iBWCs are linked to traffic in the following way:
In the package general definitions, define a BWC, with its PIR, CIR, AL and CoS.
When defining a rule, assign each service to one BWC.
You can assign subscribers a quota limit on selected services.
Each subscriber has 16 quota buckets, each of which you can define for volume or sessions. When a subscriber uses a certain service, the amount of consumed volume or number of sessions is subtracted from one of the buckets.
The service configuration determines which bucket to use for each service. Consumption of volume buckets is measured in units of L3 kilobytes. Consumption of session buckets is measured by the number of sessions. For example, you can define that the Browsing and E-Mail services consume quota from Bucket #1, that the P2P service consumes quota from Bucket #2, and that all other services are not bound to any particular bucket.
External quota provisioning systems can use the Quota Provisioning API (see the Cisco SCMS SCE Subscriber API Programmer’s Guide) to dynamically modify the quota in each bucket. For example, you can increase the quota of a certain bucket when a subscriber purchases additional quota. These external systems can also query the amount of remaining quota in each bucket. This can be used, for example, to show subscribers in a personal web page how much of their quota remains.
External quota provisioning can also be acquired using the Quota Manager (QM), an off-the-shelf solution provided by Cisco. For complete information regarding the installation and operation of the QM, see the Cisco Service Control Management Suite Quota Manager Solution Guide.
The internal SCA BB quota provisioning system replenishes each quota bucket by a fixed amount at fixed intervals.
Subscribers can be notified when they breach the quota in any bucket.
The subscriber notification feature lets you push web-based messages (such as notifications of quota depletion) to a subscriber by redirecting the subscriber HTTP traffic to relevant web pages. HTTP redirection starts when the subscriber notification is activated and ceases when the notification is dismissed.
SCA BB includes service security functionality to help protect network operators and their subscribers from attacks and malicious traffic:
DoS attacks
DDoS attacks
VoIP threats
Worms
Hacker activity
Malicious takeover of subscriber computers:
Spam zombies
E-mail based viruses
Although it is never possible to provide complete protection from network threats, the Cisco Service Control solution provides insight into malicious activity in a network, and can mitigate large scale eruptions of malicious activity that compromise overall network performance.
Networks operators can use SCA BB to:
Monitor network traffic for suspicious activity
Block malicious traffic
Notify subscribers that are creating or have been affected by malicious traffic
SCA BB uses three threat detection mechanisms:
Anomaly Detection—This set of mechanisms monitors the rate of connections (both successful and unsuccessful) to and from each host IP address. High connection rates or a low ratio between successful and unsuccessful connections indicate malicious activity.
Anomaly detection characteristics can indicate the following categories of malicious activity:
IP sweep—Scanning multiple IP addresses, all on the same port (a behavior that is typical of worms)
Port scan—Scanning all ports at one IP address (a behavior typical of hackers)
DoS attack—An attack (on a single IP address) from a single IP address
DDoS attack—An attack (on a single IP address) from multiple IP addresses
NoteSCA BB will identify a DoS attack with spoofing (using many fake IP addresses instead of one real address) as a DDoS attack.
The anomaly detection mechanism is effective in addressing new threats as they appear. It does not need knowledge about their exact nature and Layer 7 signatures, but is based on the characteristics of their network activity.
Mass mailing activity detection—This mechanism monitors SMTP session rates for individual subscribers (using SCE platform subscriber-awareness; it can work in subscriber-aware or anonymous subscriber mode). A high rate of SMTP sessions from an individual subscriber is usually an indicator of malicious activity that involves sending e-mail (either mail-based viruses or spam-zombie activity).
Signature based detection—The SCE platform’s stateful Layer 7 capabilities are used to detect malicious activity that is not easily detectable by the other mechanisms. Operators can add signatures for such threats, achieving a very quick response time in addressing new threats.
You can define the following actions when configuring the detection mechanisms described in the preceding section:
Monitor the network for malicious activity detected by each of these mechanisms.
You can display graphs based on data collected for malicious activity analysis in the Console.
Automatically block malicious activity that is detected by the SCE platform to avoid threat propagation and adverse effects to the network.
Notify subscribers that are involved in malicious activity by redirecting their web sessions to a captive portal.
SCA BB provides a high level of flexibility in tuning the detection methods to define malicious activity and in configuring the actions to be taken when malicious activity is detected.
Filter rules are part of service configurations. They allow you to instruct the SCE platform to ignore some types of flow (based on the flow’s Layer 3 and Layer 4 properties) and to transmit the flows unchanged.
When a traffic flow enters the SCE platform, the platform checks whether a filter rule applies to the flow. If a filter rule applies to this traffic flow, the SCE platform passes the traffic flow to its transmit queues without generating any RDRs and without enforcing any service configuration rules. These flows will not appear in records generated for analysis purposes and will not be controlled by rules belonging to the active service configuration.
It is recommended that you add filter rules for OSS protocols (such as DHCP) and routing protocols (such as BGP) that might traverse the SCE platform These protocols usually should not be affected by policy enforcement, and their low volume makes them insignificant for reporting.
A number of filter rules are included in the default service configuration.
Quick forwarding is a flow filter rule action whose aim is to ensure low latency for delay sensitive flows. The packets of quick-forwarded flows are duplicated and sent through different paths: one copy goes directly to the transmit queue and thus suffers only a minimal delay, the other copy goes through the normal packet path. Since the SCA BB application handles quick-forwarded flows in an offline manner, those flows cannot be controlled.
Traffic forwarding to Value Added Services (VAS) servers allows the Cisco Service Control solution to use an external expert system for additional traffic processing. When using this feature, traffic is rerouted by the SCE to the preconfigured location of the expert system (VAS server). After processing, the traffic is sent back to the SCE, which then sends it to its original destination. Conceptually, this feature adds one additional step (the expert system redirection) to the traffic processing done by SCA BB.
A service configuration implements and enforces the business strategy and vision of the provider.
A service configuration can take effect only after it is propagated to the appropriate SCE platform. SCA BB enforces the service configuration by analyzing the network traffic passing through them.
A service configuration consists of:
Traffic Classification Settings—A service configuration contains services, such as Web Browsing, File Sharing, and Voice. Each service consists of service elements, which define how network traffic is mapped to the service. Protocols, zones, flavors, and signatures are the configuration building blocks of services.
Traffic Accounting and Reporting Settings—A service configuration contains settings that determine how traffic flows and network usage accounting are reported.
Traffic Control Settings—A service configuration contains packages, each package consisting of a set of rules (such as bandwidth rate limit and quota limits) defined for different services. Rules, quota buckets, subscriber BWCs, and global controllers are the main configuration building blocks of traffic control settings.
In practice, defining service configurations is an iterative process.
It is recommended that you:
Set up the system.
Apply the default service configuration.
Gather data.
Analyze.
Only then, decide what you want to do:
Continue traffic discovery by further partitioning the traffic into services.
Achieve capacity-control and tiered-control goals by creating rules to limit and prioritize traffic according to services and subscriber packages.
This chapter:
Guides you through the process of installing or upgrading the Cisco Service Control Application for Broadband (SCA BB)
Explains how to launch the various components of the Console
Describes the concept of the Console as a collection of tools, presents each tool and its role, and describes how to navigate between the tools
Concludes with a Quick Start that describes how to apply your first service configuration and generate your first report
Installation of SCA BB is performed in two stages:
Install the SCA BB front ends:
The Console
The SCA BB Service Configuration Utility, the SCA BB Signature Configuration Utility, and the SCA BB Real-Time Monitoring Configuration Utility
Install the SCA BB application components:
The SCA BB Service Modeling Language Loadable Image (SLI) and the SCA BB Service Control Engine (SCE) applicative management plug-in
The SCA BB Subscriber Manager applicative management plug-in (for systems with a Cisco Service Control Management Suite (SCMS) Subscriber Manager (SM))
If you are upgrading an existing installation of SCA BB, see Upgrading from Version 2.5 to Version 3.0.5 or Upgrading from Version 3.0.x to Version 3.0.5.
Before installing SCA BB, verify that the SCE platform and, if used, the SCMS-SM are operational and are running appropriate versions of their software.
To verify that the SCE platform is operational:
Verify that the status LED on the SCE flashes green. (Orange—booting up; flashing orange—warning; red—failure.)
To verify that the SCE platform is running an appropriate version of the OS:
At the SCE platform CLI prompt (
SCE#), typeshow version.Press Enter.
The response shows the version of the OS running on the SCE platform.
The SCA BB installation package is a ZIP file located in the CCO.
The installation package consists of the following files:
The installer for the Console:
scas-bb-console-<version>-<build>.exe.A Cisco installation application package file (PQI file) for each platform:
A PQI file for each type of SCE platform. Each PQI file is located in a subfolder whose name is the platform name.
A PQI file for the SM, located in the
SMsubfolder.
The file
scas_bb_util.tgz, which contains the files for the SCA BB Service Configuration Utility (servconf), the SCA BB Signature Configuration Utility (sigconf), and the SCA BB Real-Time Monitoring Configuration Utility (rtmcmd) (together with real-time monitoring report templates).The file
PCubeEngageMib.mib, which defines the SCAS BB MIB, located in theSNMPsubfolder.The SCA BB Service Configuration Java API distribution file:
serviceconfig-java-api-dist.tgz.The file
surfcontrol.xml, which lists the content categories for content filtering using SurfControl Content Port Authority, located in theURL Filteringsubfolder.
You should install the following SCA BB front ends:
The Console
The SCA BB Service Configuration Utility (servconf), the SCA BB Signature Configuration Utility (sigconf), and the SCA BB Real-Time Monitoring Configuration tool (rtmcmd) (together with associated real-time monitoring report templates)
servconf requires access to the Java Runtime Environment (JRE) (see Installing the Java Runtime Environment).
To install the Console:
Navigate to the Console installation file,
scas-bb-console-3.0.5.exe, and double-click it.The Welcome screen of the SCAS BB Console 3.0.5 Setup Wizard appears.

Click Next.
The Install Location screen of the Setup Wizard opens.
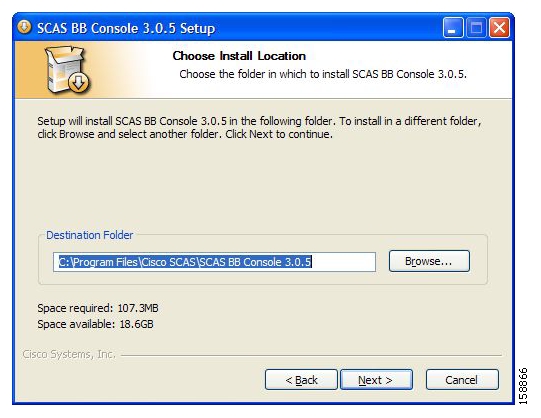
(Optional) Click Browse and choose a different destination folder.
Click Next.
The Start Menu Folder screen of the Setup Wizard opens.
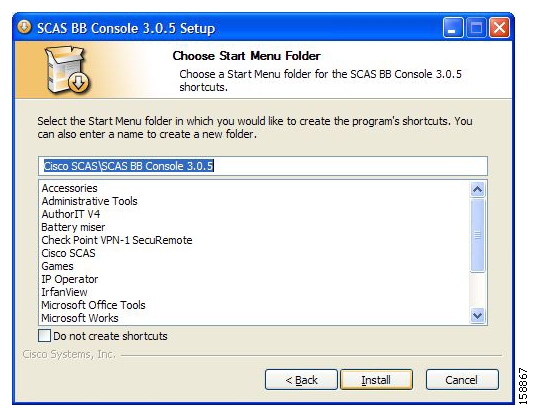
(Optional) Enter a different Start Menu folder in the Start Menu Folder field.
(Optional) Check the Do not create shortcuts check box.
Click Install.
The Installing screen of the Setup Wizard opens.

Wait until installation is complete.
The Next button is enabled.
Click Next.
The Installation Complete screen of the Setup Wizard opens.

Click Finish.
The SCAS BB Console 3.0.5 Setup Wizard closes.
The Console is now installed on the machine.
To install the SCA BB configuration utilities:
From the SCA BB installation package, extract the file
scas_bb_util.tgz, and copy it to a Windows, Solaris, or Linux workstation.Unpack the file to a new folder.
The SCA BB Service Configuration Utility (servconf), the SCA BB Real-Time Monitoring Configuration Utility (rtmcmd) (and associated real-time monitoring report templates), and the SCA BB Signature Configuration Utility (sigconf) are located under the
binfolder.
The SCA BB Service Configuration Utility, servconf, requires access to JRE version 1.4 or 1.5.
You can download a JRE from the Sun™ website at http://java.sun.com/j2se/1.4.2/download.html.
To verify that the JRE is installed, run java -version from the command prompt. The Java version should start with 1.4 or 1.5.
If a different version of JRE is also installed on the workstation, you may need to tell servconf where to find the appropriate JRE. Do this by setting the JAVA_HOME environment variable to point to the JRE 1.4 installation directory. For example:
JAVA_HOME=C:\Program Files\Java\j2re1.4.2_08SCA BB has two software components that reside on the SCE platform:
The SCA BB SLI, which performs traffic processing
The SCA BB SCE applicative management plug-in, which performs some service configuration operations
SCA BB also has one software component that resides on the SM device:
The SCA BB SM applicative management plug-in, which performs some application-specific subscriber management operations
To install these components from the Console, see Installing PQI Files on SCE Devices and Installing PQI Files on SM Devices.
To install these components from a command line, see Installing PQI Files from the Command Line.
Upgrading SCA BB includes upgrading each of the following software components:
The Console
The SCE PQI file
The SM PQI file
Note
This section describes the upgrade of SCA BB application components only. For a full description of the entire Cisco solution upgrade procedure, consult the solution upgrade document accompanying the formal release.
To upgrade SCA BB application components:
Using a SCAS BB 2.5 Console, retrieve the service configuration (PQB) from the SCE platform, and save it to the local hard disk.
NoteThe upgrade procedure does not require uninstalling the SCAS BB 2.5 Console.Open the SCA BB 3.0.5 Console.
Use the Network Navigator tool to install a version 3.0.5 SCE PQI file on the SCE platform:
Create an SCE device in the Network Navigator tool. (See Adding SCE Devices to a Site.)
Install the PQI file. (See Installing PQI Files on SCE Devices.)
Verify that the installation was successful by retrieving the SCE platform’s online status. (See Retrieving the Online Status of SCE Devices.)
If your system includes an SM, use the Network Navigator tool to install a version 3.0.5 SM PQI file on the SM device:
Create an SM device in the Network Navigator tool. (See Adding SM Devices to a Site.)
Install the PQI file. (See Installing PQI Files on SM Devices.)
Using the 3.0.5 Service Configuration Editor tool, open the service configuration saved in step 1.
When you upgrade old PQB files, new signature-based protocols are not assigned to any service (and are therefore classified as Generic TCP). Check the release notes for a list of new signature-based protocols, and manually assign these protocols to a service.
Apply the service configuration to the SCE platform.
Note
When you upgrade old PQB files, some protocol IDs are changed automatically. Messages such as the following may be displayed to indicate the change:
Protocol ID of BaiBao changed from 80 to 43
Protocol ID of PPLive changed from 81 to 44
New SCA BB versions do not use the default Dynamic Signature Script (DSS) file that was installed for a previous SCA BB version.
If a protocol pack for the new version is available, install it after the product installation is complete. Do not install an old protocol pack on top of a new product installation.
Upgrading SCA BB includes upgrading each of the following software components:
The Console
The SCE PQI file
The SM PQI file
Note
This section describes the upgrade of SCA BB application components only. For a full description of the entire Cisco solution upgrade procedure, consult the solution upgrade document accompanying the formal release.
To upgrade SCA BB application components:
Using a SCA BB 3.0.x Console, retrieve the service configuration (PQB) from the SCE platform, and save it to the local hard disk.
NoteThe upgrade procedure does not require uninstalling the SCA BB 3.0.x Console.Open the SCA BB 3.0.5 Console.
Use the Network Navigator tool to install a version 3.0.5 SCE PQI file on the SCE platform:
Create an SCE device in the Network Navigator tool. (See Adding SCE Devices to a Site.)
Install the PQI file. (See Installing PQI Files on SCE Devices.)
Verify that the installation was successful by retrieving the SCE platform’s online status. (See Retrieving the Online Status of SCE Devices.)
If your system includes an SM, use the Network Navigator tool to install a version 3.0.5 SM PQI file on the SM device:
Create an SM device in the Network Navigator tool. (See Adding SM Devices to a Site.)
Install the PQI file. (See Installing PQI Files on SM Devices.)
Using the 3.0.5 Service Configuration Editor tool, open the service configuration saved in step 1.
When you upgrade old PQB files, new signature-based protocols are not assigned to any service (and are therefore classified as Generic TCP). Check the release notes for a list of new signature-based protocols, and manually assign these protocols to a service.
Apply the service configuration to the SCE platform.
Note
When you upgrade old PQB files, some protocol IDs are changed automatically. Messages such as the following may be displayed to indicate the change:
Protocol ID of BaiBao changed from 80 to 43
Protocol ID of PPLive changed from 81 to 44
New SCA BB versions do not use the default Dynamic Signature Script (DSS) file that was installed for a previous SCA BB version.
If a protocol pack for the new version is available, install it after the product installation is complete. Do not install an old protocol pack on top of a new product installation.
Install the new version of the SCA BB Service Configuration Utility, servconf, in an empty directory (see Installing the SCA BB Configuration Utilities).
SCA BB uses stateful Layer 7 capabilities for classification of traffic flows.
When a traffic flow is handled by the system, it is assigned a signature ID according to the set of Layer 3 to Layer 7 parameters (the signature) characterizing this flow. Typically, these signatures come embedded in SCA BB.
In order to enable rapid response to the ever-changing protocol environment, SCA BB was enhanced to allow signatures to be updated dynamically. You can load a protocol support plug-in onto an operational system, enhancing the system’s protocol support without compromising the stability of the system (no update of an existing software component is required) and without any service downtime.
Periodically, Cisco publishes protocol packs containing new and improved protocol signatures for SCA BB. A typical protocol pack is a file containing signatures for detecting network worms, popular peer-to-peer applications, and other relevant protocols. When loaded into SCE platforms, these signatures improve SCA BB classification abilities.
Note
You can install a protocol pack on an SCE platform only if a PQI is already installed on the platform.
A protocol pack for SCA BB may be either a DSS file or an SPQI file:
Loading a DSS file to the SCE platform requires no downtime of SCA BB or the platform.
Loading an SPQI file to the SCE platform entails updating the SCE application:
If hitless upgrade (see Hitless Upgrade of the SLI) is enabled, there is no downtime of the SCE platform when loading the SPQI file.
If hitless upgrade is not enabled, loading an SPQI file requires a short downtime (up to one minute) of the SCE platform. During that time, network traffic bypasses the platform and is neither controlled nor reported.
NoteIf hitless upgrade is disabled, SPQI installation can cause the loss of the following subscriber data from all subscribers: package ID, real-time monitoring flag, and quota settings. Subscribers are assigned default values for these properties.
A protocol pack is compatible only with specific versions of the SCE application. When working with protocol packs, it is important to verify that the protocol pack version matches the SCE application version. For example, only use a protocol pack for 3.0.5 on SCE application version 3.0.5.
The version compatibility information for each protocol pack is included in the protocol pack’s release notes.
To verify that the protocol pack can be successfully installed:
Verify that the correct version of servconf is installed and running correctly:
From the command prompt, type
servconf --version.Press Enter.
The version of the utility should match that of the protocol pack.
Verify that the correct version of the SCE application is installed:
At the SCE platform CLI prompt (
SCE#), typeshow version.Press Enter.
The application version should match that of the protocol pack.
Verify that a service configuration (PQB) is applied to the SCE platform:
In the Console, retrieve and view the current PQB.
Installing a protocol pack on an SCE platform is performed using one of the following:
The Network Navigator tool (described in the following section)
Note
If the protocol pack is an SPQI file you can enable and configure the hitless upgrade option using Hitless Upgrade CLI commands. (See Hitless Upgrade of the SLI.)
The tool or utility performs the following steps:
Retrieves the current service configuration from the SCE platform and (optionally) stores a backup copy in a user-specified folder.
Imports the signatures that are in the DSS or SPQI file into the service configuration. This overwrites any DSS that was previously imported into the service configuration.
For each new signature that includes a Buddy Protocol attribute (an attribute that points to an existing protocol) (see The Buddy Protocol)—Adds the new signature to all services that include the buddy protocol.
If the protocol pack is an SPQI file—Replaces the SCE application. This causes a short (up to one minute) downtime in SCE platform service.
Applies the new service configuration to the SCE platform.
If the protocol pack is an SPQI file and the hitless upgrade option is enabled, you can monitor the progress of the upgrade using Hitless Upgrade CLI commands.
The Network Navigator allows easy installation of protocol packs.
You can install protocol packs on one, several, or all SCE platforms at one or more selected sites.
To install a protocol pack on a single SCE platform:
In the Site Manager tree, right-click the SCE where the protocol pack will be installed.
From the popup menu that appears, select Update Dynamic Signature Pack.
The Update Dynamic Signature Pack dialog box appears.

Click Browse.
A Select file dialog box appears.
From the Files of type drop-down list, select *.spqi or *.dss, according to the file to be installed.
Browse to the file to be installed.
Click Open.
The Select file dialog box closes.
(Recommended) Check the Backup the current configuration check box, click Browse, and select a backup file.
Click Finish.
A Password Management dialog box appears.
Enter the appropriate password. (For more information, refer to Password Management.)
Click Update.
The Password Management dialog box closes.
An Update Dynamic Signature Pack progress bar appears.
The service configuration on the SCE platform is updated.
To install a protocol pack on multiple SCE platforms:
In the Site Manager tree, select sites or SCE devices where the protocol pack will be installed, and right-click one of them
From the popup menu that appears, choose Update Dynamic Signature Pack.
The Update Dynamic Signature Pack dialog box appears.
Select the protocol pack to be installed.
(Recommended) Check the Backup the current configuration check box and select a backup directory.
NoteThe backup files will be namedbackupPolicy_<SCE Platform IP address>.pqb.Click Finish.
A separate Password Management dialog box appears for each SCE device that you selected.
For each SCE device, enter the password and click Update.
The protocol pack is installed on each SCE platform in turn.
To verify that the protocol pack was installed successfully:
At the SCE platform CLI prompt (
SCE#), typeshow version.Press Enter
The response shows the version of the OS running on the SCE platform. This includes information about the installed protocol pack version.
Retrieve the PQB from the SCE platform and view it using the Console.
Verify that the new protocols from the protocol pack were added to the service configuration.
The problems that may cause the installation of a protocol pack to fail and their remedies include:
Missing or incorrect version of the JRE—Install the correct version of the JRE.
Incorrect or missing SCE application version on the SCE platform—Verify that the correct SCE application is installed.
No service configuration (PQB) is applied to the SCE platform—Create a new PQB and apply it using the Console.
servconf failed to import the new signatures into the PQB—Use the
--force-signatureupdate signature option when running servconf.
When reporting problems to Cisco, please include the servconf log file, located at <user.home>\.p-cube\servconf.log. On Windows, this usually maps to C:\Documents and Settings\<username>\.p-cube\servconf.log.
Hitless upgrade is the SCA BB method of upgrading the software components that reside on the SCE platform without incurring any service downtime.
Note
Hitless upgrade is available on SCE 2000 and SCE 1000_2U platforms.
Hitless upgrade is not available on SCE 1000_1.5U platforms.
If hitless upgrade is enabled, classification, reporting, and control continue uninterrupted when you install an SPQI file (see Installing Protocol Packs). You can install SPQI files using either the SCA BB Console or servconf, the SCA BB Service Configuration Utility. An SPQI file is a package that includes the required (SLI) files.
After the new application is loaded on the SCE platform:
The new application services all new flows and bundles.
The old application continues to service existing flows (and new flows that belong to bundles of existing flows).
Both applications share available memory.
Until all old flows die or are killed, the hitless upgrade is considered to be in progress. In order to make the hitless upgrade process bounded, you can set criteria that will trigger the explicit killing of all flows still executing on the old application. Two such criteria exist:
When a specified amount of time has passed since the process started.
When the number of old flows goes below a specified threshold.
The default value for the first criterion is 60 (minutes); the default value for the second is zero (flows). This means that the replace operation is guaranteed to complete after no more than one hour (sooner, if all old flows die naturally), but no old flows are killed by the application before one hour passes.
These criteria are configurable by CLI commands.
You can initiate the explicit killing of all old flows using a manual command.
You can configure, monitor, and control hitless upgrade using the SCE platform Command-Line Interface (CLI). For more information about the SCE platform CLI, see the Cisco Service Control Engine (SCE) CLI Command Reference.
The commands listed here are explained in the following section.
Use the following CLI commands to configure the criteria for completing a hitless upgrade:
replace completion time <minutes>
no replace completion time
default replace completion time
replace completion num-flows <num>
no replace completion num-flows
default replace completion num-flows
These commands are line interface configuration commands. To run these commands you must enter line interface configuration mode and see the SCE(config if)# prompt displayed.
To enter line interface configuration mode:
At the SCE platform CLI prompt (
SCE#), type:configure.Press Enter.
The
SCE(config)#prompt appears.Type:
interface linecard 0.Press Enter.
The
SCE(config if)#prompt appears.
The following two CLI commands are EXEC mode commands.
Use the following CLI command to monitor the progress of a hitless upgrade:
show applications slot<num> replace
Use the following CLI command to force immediate completion of a hitless upgrade:
application slot<num> replace force completion
The following table gives a description of the hitless upgrade CLI commands listed in the previous section.
Table 4.1. Hitless Upgrade CLI Commands
|
Command |
Description |
|---|---|
|
replace completion time <minutes> |
Sets the time criterion for killing all old flows and completing the hitless upgrade. Specifying a value of zero disables this criterion—the hitless upgrade is completed only when the number-of-flows criterion is met. |
|
no replace completion time |
Sets the time criterion for completing the hitless upgrade to zero. |
|
default replace completion time |
Resets the time criterion for completing the replace operation to the default value of 60. |
|
replace completion num-flows <num> |
Sets the number-of-flows criterion for completing the hitless upgrade operation. When the number of old flows drops below the number specified by this criterion, the remaining flows are killed and the hitless upgrade is complete. |
|
no replace completion num-flows |
Sets the number-of-flows criterion for completing the hitless upgrade to zero. |
|
default replace completion num-flows |
Resets the number-of-flows criterion for completing the hitless upgrade to the default value of zero. |
|
show applications slot <num> replace |
Shows the current hitless upgrade state:
|
|
application slot <num> replace force completion |
Forces the current hitless upgrade process to complete (killing all old flows). |
The SCAS BB Console Setup Wizard adds a shortcut to the start menu for the Console.
To launch the Console:
Choose start > All Programs > Cisco SCAS > SCAS BB Console 3.0.5 > SCAS BB Console 3.0.5.
The Cisco Service Control SCAS BB Console splash screen appears.

After the Console has loaded, the main window of the Console appears, with the Network Navigator tool open.
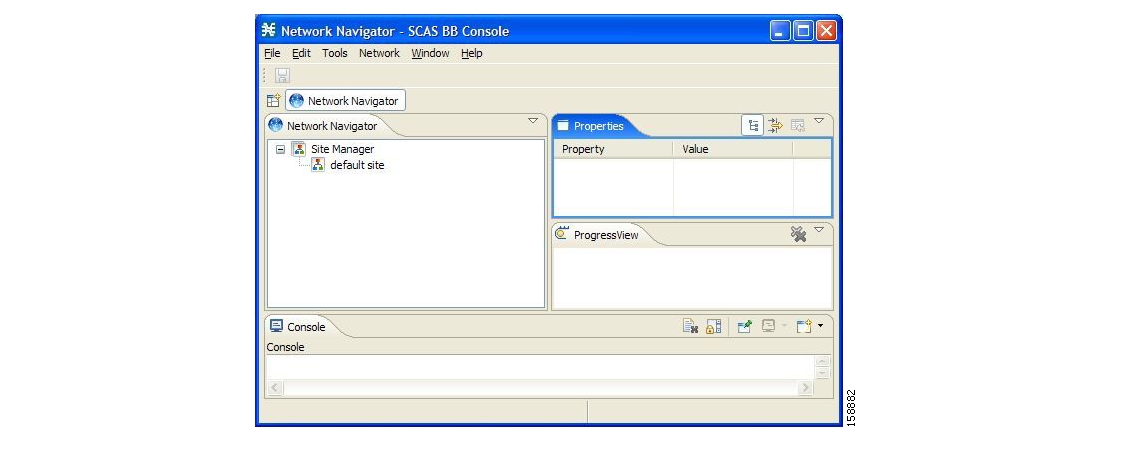
Note
When you close the Console, it will remember which tools are open and which is the active tool, and apply this the next time you launch the Console.
The Console is the front end of the Cisco Service Control Application for Broadband. You use it to configure the services that the SP offers its clients.
The Console consists of the following tools:
Network Navigator tool
Service Configuration Editor tool
Signature Editor tool
Subscriber Manager GUI tool
Reporter tool
The Console GUI has a menu bar and a standard toolbar. Underneath the toolbar is another bar that displays the button of any Console tool that is open. When you launch a tool, a button is added to this bar. To switch between open tools, click the appropriate button on the bar.

Note
The title of the Console window shows the active tool and the active service configuration.
The Network Navigator is a tool that allows you to create and manage a simple model of all local and remote devices that are part of the Cisco Service Control solution.
For more information about the Network Navigator, see Using the Network Navigator.
The Service Configuration Editor is a tool that allows you to create service configurations. A service configuration is a data structure that defines how the SCE platform analyses network traffic, what rules apply to the traffic, and what actions the SCE platform takes to enforce these rules.
Most of this document discusses using the Service Configuration Editor. See Using the Service Configuration Editor.
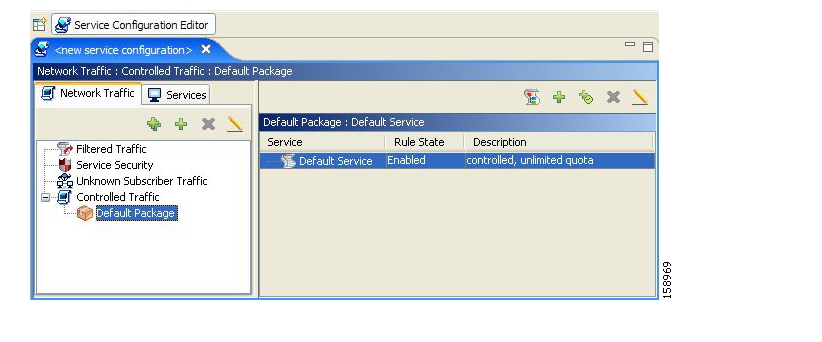
The Signature Editor is a tool that allows you to create and modify files that can add and modify protocols and protocol signatures in SCA BB.
For more information about the Signature Editor, see Using the Signature Editor.
The Subscriber Manager (SM) GUI is a tool that allows you to connect to an SCMS-SM and then manage subscribers, assign packages to subscribers, edit subscriber parameters, and manually add subscribers.
For more information about connecting to an SCMS-SM and using the SM GUI, see Using the Subscriber Manager GUI Tool.
For more information about the SCMS-SM, see the Cisco Service Control Management Suite Subscriber Manager User Guide.
The Cisco Service Control Application (SCA) Reporter is a tool that allows you to query the Cisco Service Control Management Suite (SCMS) Collection Manager (CM) RDR database, and present the results in a chart or a table. This is a valuable tool for understanding the habits and resource consumption of the applications and subscribers that use your network. It can also be used for judging the efficacy of various rules and the possible impact of their implementation on the network. You can view the reports in both tabular and chart formats, export them, save them, and edit their appearance.
You can run the SCA Reporter as a standalone or inside the Reporter tool in the Console. For more information about the SCA Reporter, see the Cisco Service Control Application Reporter User Guide.

You can access relevant parts of this user guide from the Console.
To access online help:
From the Console main menu, choose Help > Help Contents.
Online help opens in a separate window.
You can also search online help from the current tool.
To search online help:
From the Console main menu, choose Help > Search.
A new area containing a Help tab is added next to the current tool.
Enter a word, phrase, or more complex search expression in the Search expression field.
The Go button is enabled.
NoteClick >> (Expand) for an explanation of how to construct search expressions.Click Go.
Help topics containing your search expression are listed under Local Help.
Click a help topic to view its contents.
NoteYou can bookmark topics for later reference.By clicking the appropriate link at the bottom of the Help tab, you can switch to:
All topics
Related topics
Bookmarks
This Quick Start section will help you get started with the Console. You will add an SCE device to the default site and apply the default service configuration to the SCE.
Launch the Console:
Choose start > All Programs > Cisco SCAS > SCAS BB Console 3.0.5 > SCAS BB Console 3.0.5.
Open the Network Navigator:
From the Console main menu, choose Tools > Network Navigator.
This step sets up the Console for network device operations.
NoteNote that the Network Navigator tool is open the first time you launch the Console.You should now be able to see the default site displayed in the Network Navigator tab.
Add an SCE device to the default site:
Right-click the default site, and, from the popup menu that appears, select New > SCE.
The Create new SCE wizard appears.
In the Address field, enter the actual IP address of an SCE platform.
Click Finish.
The Create new SCE wizard closes.
The new device is added to the site.
Check the SCE platform version and operational state:
Right-click the SCE device and, from the popup menu that appears, select Online Status.
A Password Management dialog box appears.
Enter the username and password for managing the SCE, and click Extract.
The SCE online status is retrieved.
Check that the system and application versions are correct, and that the operational state is Active.
Open the Service Configuration Editor:
From the Console main menu, choose Tools > Service Configuration Editor.
A No Editor Is Open dialog box appears.
Create a new service configuration by clicking Yes in the No Editor Is Open dialog box.
A default service configuration opens in the Service Configuration Editor tool.
Apply the service configuration to the SCE platform:
From the toolbar, select
 (Apply Service Configuration to SCE Devices).
A Password Management dialog box appears.
Enter the username and password for managing the SCE, and click Apply.
The service configuration is applied to the SCE platform.
To manage a network entity—Service Control Engine (SCE) platform, Subscriber Manager (SM), or Collection Manager (CM)—from the Console, you must first define it as a device in the Network Navigator. The Network Navigator tool allows you to create a simple model of all local and remote devices that are part of the Cisco Service Control solution, and manage the devices remotely.
The Network Navigator tool contains four tabs:
Network Navigator—Displays, in the Site Manager tree, all sites and devices that you have defined as part of your system
Properties—Displays the editable properties of the node selected in the Site Manager tree in the Network Navigator tab
ProgressView—When an operation is performed on a site or device in the Site Manager tree, displays a progress bar
Console—Displays log messages concerning actions performed in the Network Navigator tool
You can manage an SCE, SM, or CM from the Console only if the network entity is defined as a device in the Network Navigator. After a device is added to the Network Navigator, you can perform management and monitoring operations on the device.
You can also perform operations on a group of devices. For example, you can apply the same service configuration to a group of SCE Platforms. The Network Navigator allows you to group devices by adding them under the same site. A site is a group of devices that can be managed together. At installation, the Network Navigator contains a default site with no devices. You can add devices to this site or add additional sites, as described in the following sections.
Grouping devices in sites can also help to manage the passwords for these devices (see Password Management).
To add a site to the Site Manager
In the Network Navigator tab, right-click the Site Manager node.
A popup menu appears.
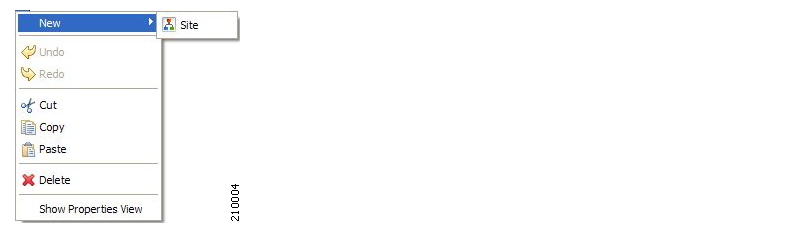
From the menu, select New > Site.
A new Site node is added to the Site Manager.
In the Properties tab, enter a name for the site in the Name cell.
(Optional) In the Version cell, enter a version number.
You can add SCE, SM, CM, or database devices to a site.
To use the Network Navigator to configure, monitor, and update the software of an SCE platform, you must first add the SCE platform to a site.
To add an SCE device to a site:
In the Site Manager tree, right-click a site.
A popup menu appears.
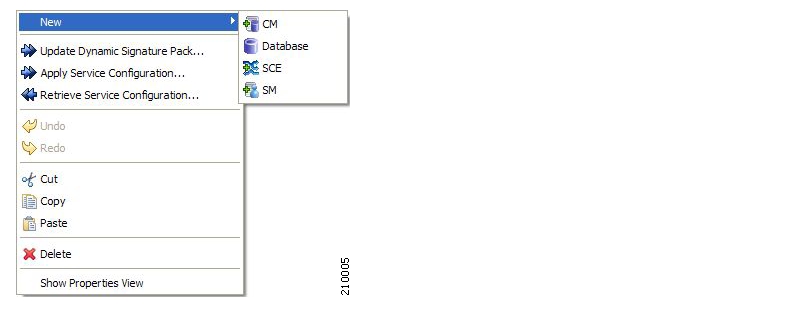
From the menu, select New > SCE.
The Create New SCE wizard appears.
In the Address field, enter the IP address of the SCE.
(Optional) In the Name field, enter a meaningful name for the SCE.
Click Finish.
The Create new SCE wizard closes.
The new device is added to the site.
To use the Network Navigator to configure, monitor, and update the software of an SM, you must first add the SM to a site.
To add an SM device to a site:
In the Site Manager tree, right-click a site.
A popup menu appears.
From the menu, select New > SM.
The Create New SM wizard appears.
In the Address field, enter the IP address of the SCMS-SM.
(Optional) In the Name field, enter a meaningful name for the SM.
Click Finish.
The Create new SM wizard closes.
The new device is added to the site.
To use the Network Navigator to monitor a CM, you must first add the CM to a site.
To add a CM device to a site:
In the Site Manager tree, right-click a site.
A popup menu appears.
From the menu, select New > CM.
The Create New CM wizard appears.
In the Address field, enter the IP address of the CM.
(Optional) In the Name field, enter a meaningful name for the CM.
Click Finish.
The Create new CM wizard closes.
The new device is added to the site.
To add a database device to a site:
In the Site Manager tree, right-click a site.
A popup menu appears.
From the menu, select New > Database.
The Create New Database wizard appears.
In the Address field, enter the IP address of the database.
(Optional) In the Name field, enter a meaningful name for the database.
From the Database type drop-down list, select a database type.
(Optional) Check the Enable Advanced Settings check box and enter new values in the Url, Driver, User, and Password fields.
Click Finish.
The Create new Database wizard closes.
The new device is added to the site.
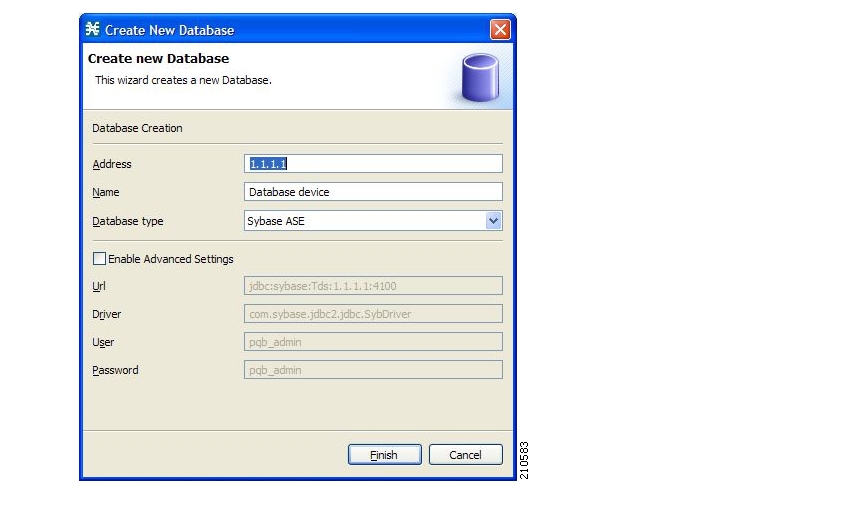
The Network Navigator allows you to manage SCE, SM, CM, and database devices.
Normally, before you can access a device (SCE, SM, CM, or database), you must enter its password. When you try to perform any operation on a site device, the Network Navigator first asks for the device username and password. (Repeating the same operation on the same device does not always require a second entry of the password.)
When performing operations on multiple devices, password entry can become tedious. The Site Master Password can help you remember some or all of your element’s usernames and passwords by storing them as part of the site’s data, and entering them for you automatically when you connect to an element.
The Site Master Password protects saved usernames and passwords in the password manager. The Console prompts you for the site’s master password when you wish to activate the site password manager. If you have multiple sites, each site will require a separate master password.

For each site, when the Password Management dialog box appears, check the Enable Site Master Password check box.
This operation generates the SCE platform’s support file, for the use of Cisco technical support staff.
To generate a tech support info file for an SCE:
In the Site Manager tree, right-click an SCE device.
A popup menu appears.

From the menu, select Generate Tech Support Info File.
The Generate Tech Support Info File dialog box appears.
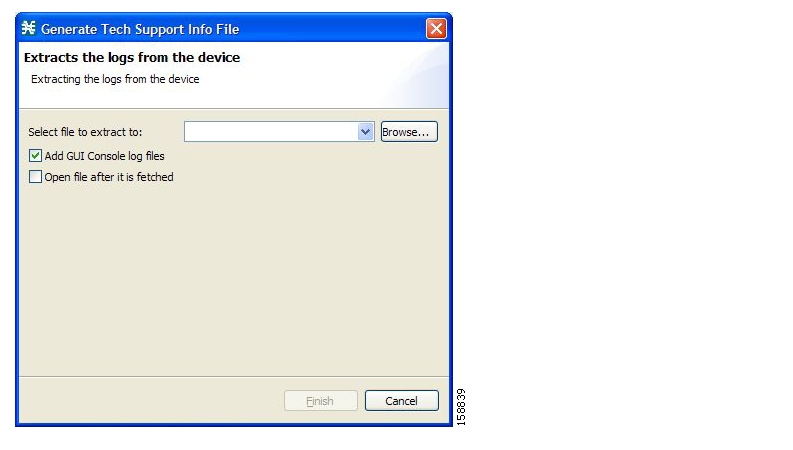
Click Browse.
A Select File dialog box appears.
Browse to the folder where you want to save the tech support info file.
In the File name field, enter a new file name, or select an existing ZIP file.
Click Open to select the file.
If the file exists, it will be overwritten when you generate the tech support info.
The Select File dialog box closes.
(Optional) To add log files to the output tech support info file, check the Add GUI Console log files check box.
(Optional) Check the Open file after it is fetched check box.
Click Finish.
The Generate Tech Support Info File dialog box closes.
A Password Management dialog box appears.
Enter the appropriate password. (For more information, refer to Password Management.)
Click Generate.
The Password Management dialog box closes.
A Generate tech support info file progress bar appears.
The file is generated.
This operation provides information about the SCE platform’s current software version and operational status.
To retrieve the online status of an SCE device:
In the Site Manager tree, right-click an SCE device.
A popup menu appears.
From the menu, select Online Status.
A Password Management dialog box appears.
Enter the appropriate password. (For more information, refer to Password Management.)
Click Extract.
The Password Management dialog box closes.
An Extracting info progress bar appears.
The SCE online status is retrieved.
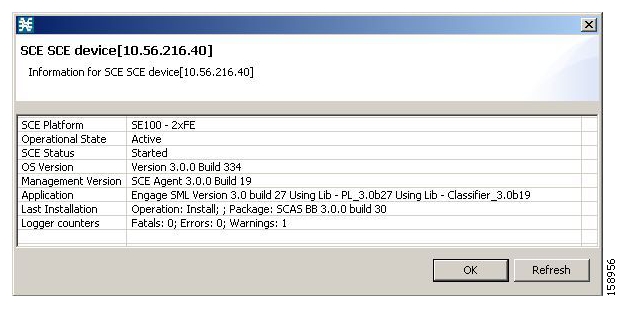
You can install a protocol pack on a single SCE platform, on selected SCE platforms, or on all SCE platforms at one or more selected sites (see Installing a Protocol Pack).
You can apply a service configuration to a single SCE platform, to selected SCE platforms, or to all SCE platforms at one or more selected sites.
Note
The service configuration that you are applying must be open in the Service Configuration Editor.
To apply a service configuration to a single SCE platform:
In the Site Manager tree, right-click an SCE device.
A popup menu appears.
From the menu, select Apply Service Configuration.
The Choose Policy dialog box appears, listing all service configurations that are open in the Service Configuration Editor.
NoteIf only one service configuration is open in the Service Configuration Editor, a Password Management dialog box appears. Continue at step 5. (If no service configurations are open in the Service Configuration Editor, an error message is displayed.)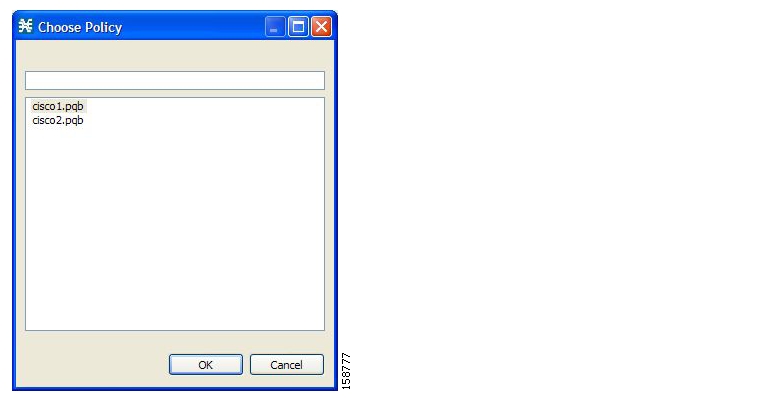
Select a service configuration from the list.
Click OK.
A Password Management dialog box appears.
Enter the appropriate password. (For more information, refer to Password Management.)
Click Apply.
The Password Management dialog box closes.
An Applying service configuration to SCE progress bar appears.
The service configuration is applied to the selected SCE platform.
To apply a service configuration to multiple SCE platforms:
In the Site Manager tree, select sites or SCE devices to which you are applying the service configuration and right-click one of them.
From the popup menu that appears, select Apply Service Configuration.
The Choose Policy dialog box appears, listing all service configurations that are open in the Service Configuration Editor.
NoteIf only one service configuration is open in the Service Configuration Editor, a Password Management dialog box appears. Continue at step 4. (If no service configurations are open in the Service Configuration Editor, an error message is displayed.)Select a service configuration from the list and click OK.
A separate Password Management dialog box appears for each SCE device that you have selected.
For each SCE device, enter the password and click Apply.
The service configuration is applied to each selected SCE platform in turn.
You can retrieve service configurations from a single SCE platform, from selected SCE platforms, or from all SCE platforms at one or more selected sites.
To retrieve a service configuration from a single SCE platform:
In the Site Manager tree, right-click an SCE device.
A popup menu appears.
From the menu, select Retrieve Service Configuration.
A Password Management dialog box appears.
Enter the appropriate password. (For more information, refer to Password Management.)
Click Retrieve.
The Password Management dialog box closes.
A Retrieving from SCE progress bar appears.
The service configuration is retrieved from the SCE platform and opened in the Service Configuration Editor.
To retrieve service configurations from multiple SCE platforms:
In the Site Manager tree, select sites or SCE devices whose service configurations you want to retrieve, and right-click one of them.
From the popup menu that appears, select Retrieve Service Configuration.
A separate Password Management dialog box appears for each SCE device that you have selected.
For each SCE device, enter the password and click Retrieve.
The service configuration is retrieved from each SCE platform in turn, and is opened in the Service Configuration Editor.
This operation installs the Cisco Service Control Application for Broadband on the SCE platform. For more information, see Installing SCA BB.
Note
Installing a PQI file usually takes a few minutes.
To install a PQI file on an SCE device:
In the Site Manager tree, select an SCE device.
From the Console main menu, choose Network > Install PQI.
The Update Software dialog box appears.
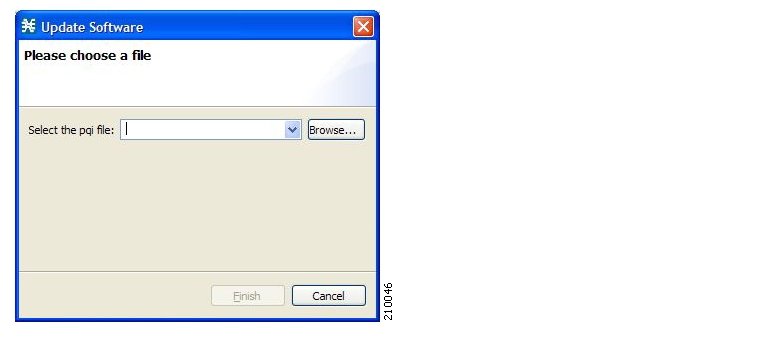
Click Browse.
A Select file dialog box appears.
Browse to the PQI file that you are installing.
Click Open.
The Select file dialog box closes.
Click Finish.
A Password Management dialog box appears.
Enter the appropriate password. (For more information, refer to Password Management.)
Click Apply.
The Password Management dialog box closes.
An Updating software to SCE progress bar appears.
The PQI file is installed on the selected SCE.
This operation installs the SCE OS software package (the operating system software and firmware of the SCE platform).
For more information, see “Upgrading SCE Platform Firmware” in the “Operations” chapter of the Cisco Service Control Engine (SCE) Software Configuration Guide.
To install an operating system (OS) file on an SCE device:
In the Site Manager tree, select an SCE device.
From the Console main menu, choose Network > Install OS.
The Update OS dialog box appears.
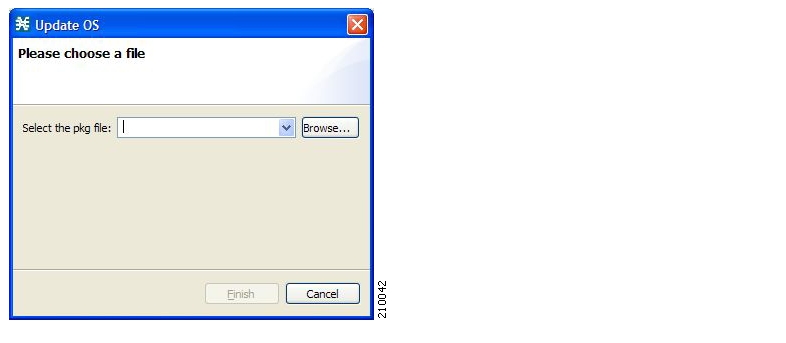
Click Browse.
A Select file dialog box appears.
Browse to the PKG file containing the OS that you are installing.
Click Open.
The Select file dialog box closes.
Click Finish.
A Password Management dialog box appears.
Enter the appropriate password. (For more information, refer to Password Management.)
Click Apply.
The Password Management dialog box closes.
An Updating software to SCE progress bar appears.
The PQI file is installed on the selected SCE.
This operation generates the SM’s support file, for the use of Cisco technical support staff.
To generate a tech support info file for an SM:
In the Site Manager tree, right-click an SM device.
A popup menu appears.
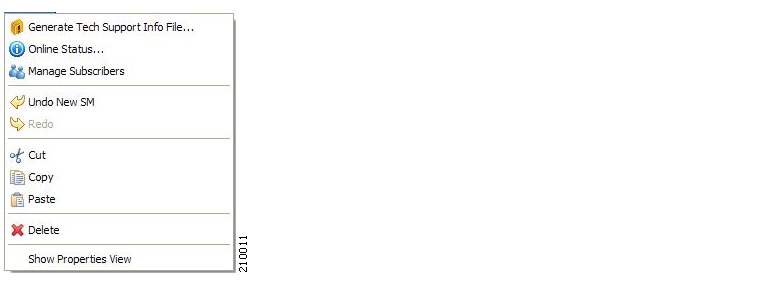
From the menu, select Generate Tech Support Info File.
The Generate Tech Support Info File dialog box appears.
Click Browse.
A Select File dialog box appears.
Browse to the folder where you want to save the tech support info file.
In the File name field, enter a new file name, or select an existing ZIP file.
Click Open to select the file.
If the file exists, it will be overwritten.
The Select File dialog box closes.
(Optional) To add log files to the output tech support info file, check the Add GUI Console log files check box.
(Optional) Check the Open file after it is fetched check box.
Click Finish.
The Generate Tech Support Info File dialog box closes.
A Password Management dialog box appears.
Enter the appropriate password. (For more information, refer to Password Management.)
Click Generate.
The Password Management dialog box closes.
A Generate tech support info file progress bar appears.
The file is generated.
This operation provides information about the SM’s current software version and operational status.
To retrieve the online status of an SM device:
In the Site Manager tree, right-click an SM device.
A popup menu appears.
From the menu, select Online Status.
A Password Management dialog box appears.
Enter the appropriate password. (For more information, refer to Password Management.)
Click Extract.
The Password Management dialog box closes.
An Extracting info progress bar appears.
The SCMS-SM online status is retrieved.
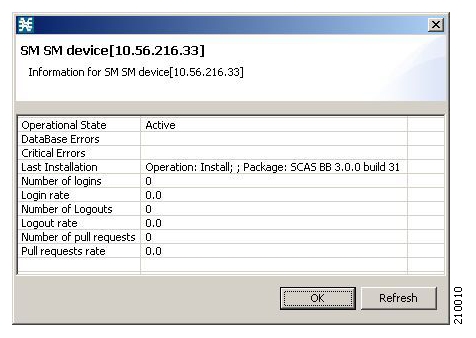
In order to manage subscribers using the SM GUI tool, you must connect to an SM device.
Note
The SM GUI tool performs authentication on the SCMS-SM by opening a PRPC connection to port 14374 and attempting to log in using the username and password that you entered in the Password Management dialog box. If a PRPC server with this user is not running on the SCMS-SM, authentication will fail.
To connect to an SM device:
In the Site Manager tree, right-click an SM device.
A popup menu appears.
From the menu, select Manage Subscribers.
A Password Management dialog box appears.
Enter the appropriate password. (For more information, refer to Password Management.)
Click Connecting.
The Password Management dialog box closes.
A Connecting to progress bar appears.
You connect to the SM, and the Console switches to the SM GUI tool.
See Using the Subscriber Manager GUI Tool for an explanation of how to proceed.
Note
Installing a PQI file usually takes a few minutes.
To install a PQI file on an SM device:
In the Site Manager tree, select an SM device.
From the Console main menu, choose Network > Install PQI.
The Update Software dialog box appears.
Click Browse.
A Select file dialog box appears.
Browse to the PQI file that you are installing.
Click Open.
The Select file dialog box closes.
Click Finish.
A Password Management dialog box appears.
Enter the appropriate password. (For more information, refer to Password Management.)
Click Apply.
The Password Management dialog box closes.
An Updating software to SM progress bar appears.
The PQI file is installed on the selected SM.
This operation provides information about the CM’s current software version and operational status.
To retrieve the online status of a CM device:
In the Site Manager tree, right-click a CM device.
A popup menu appears.
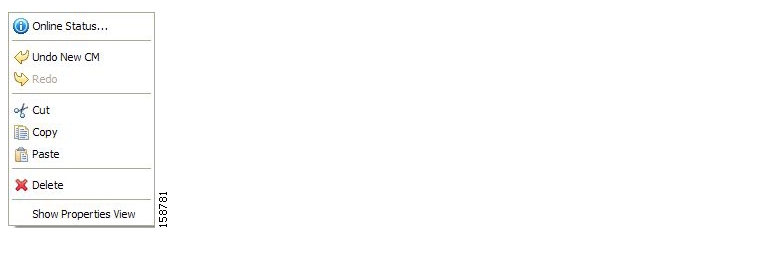
From the menu, select Online Status.
A Password Management dialog box appears.
Enter the appropriate password. (For more information, refer to Password Management.)
Click Extract.
The Password Management dialog box closes.
An Extracting info progress bar appears.
The SCMS-CM online status is retrieved.
For an example of a retrieved online status window (for an SCE platform), see Retrieving the Online Status of SCE Devices.
Note
An alternative procedure is described in “Configuring a Database Connection” in the “Using the SCA Reporter” chapter of the Cisco Service Control Application Reporter User Guide.
To make databases accessible to the SCA Reporter:
In the Site Manager tree, right-click a database device.
A popup menu appears.
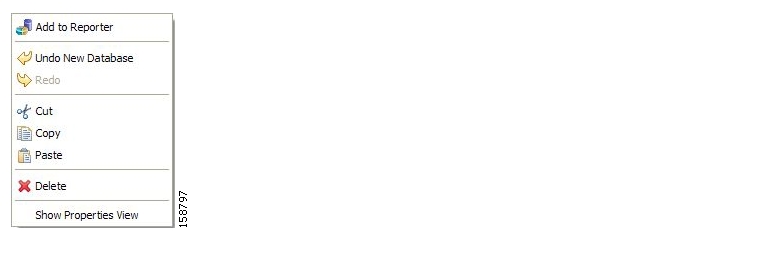
From the menu, select Add to Reporter.
The Preferences dialog box appears.
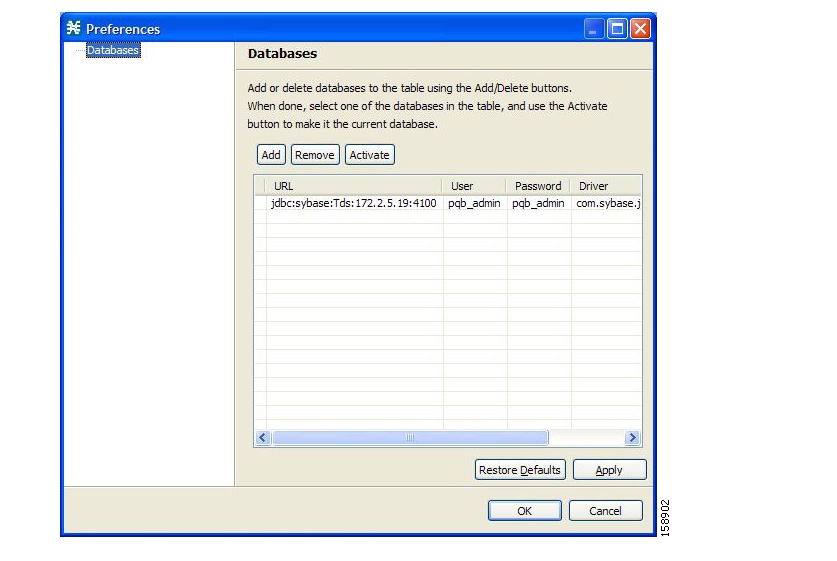
Click Add.
The Add Database wizard appears.
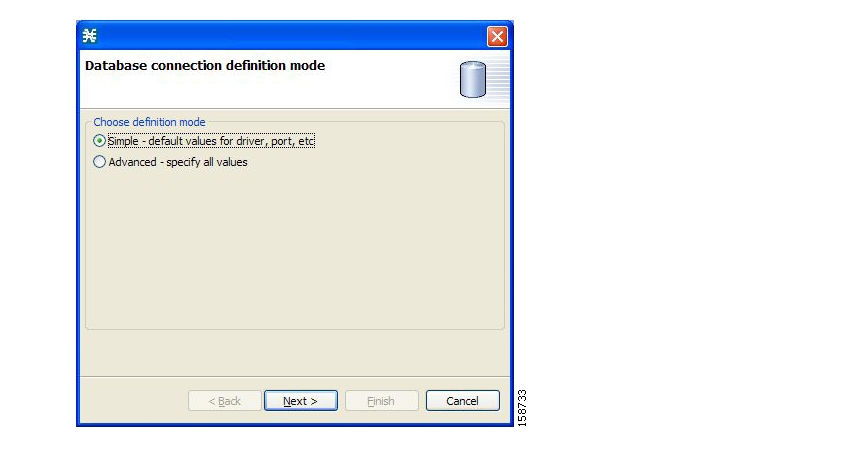
Select one of the Choose definition mode radio buttons:
Simple
Advanced
Click Next.
The Define new database connection screen of the Add Database wizard opens.
If you selected Simple in step 4, the Define new database connection screen looks like this:
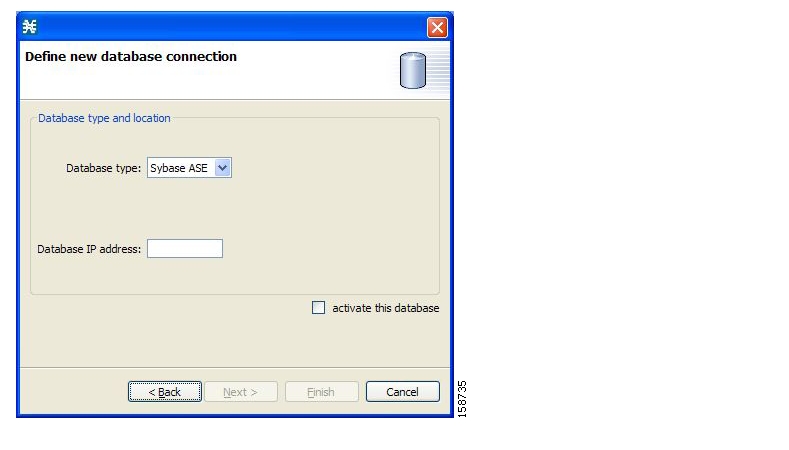
If you selected Advanced in step 4, the Define new database connection screen looks like this:

Fill in all the fields.
Click Finish.
The Add Database wizard closes.
The definition of the database is added to the list in the Preferences dialog box.
Repeat steps 3 to 7 for other databases.
Remove database connection information, if necessary.
Make sure that the correct database is activated.
Click OK.
The Preferences dialog box closes.
After you add sites and devices to the Network Navigator, you can export this data to a file to back up your settings and to share them with other users, who can import your Network Navigator settings into their Console.
If you use the Site Master Password to store the passwords of the network devices, the passwords are also exported, in encrypted form. This means that other users who import this data need only provide the Site Master Password to access the devices.
To export a Network Navigator configuration to a file:
From the Console main menu, choose File > Export.
The Export dialog box appears.
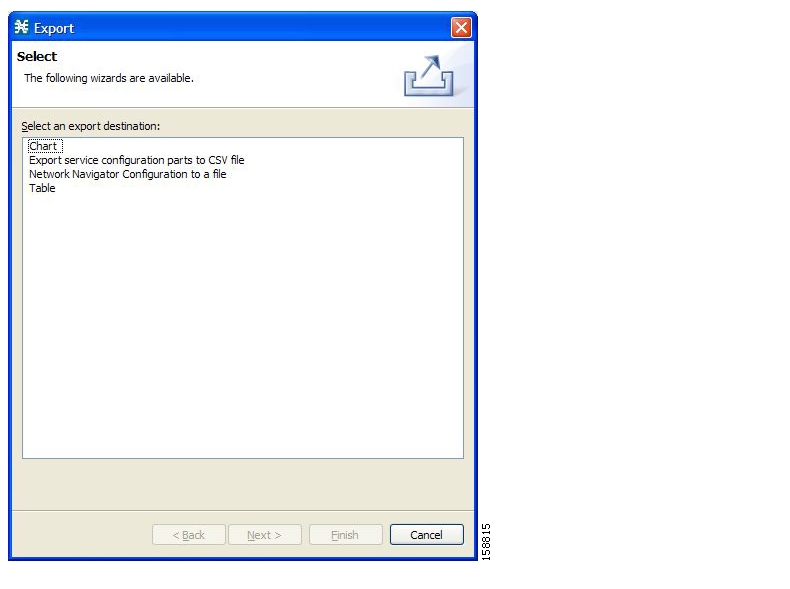
From the export destination list, select Network Navigator Configuration to a file.
Click Next.
The Export Network Navigator Configuration to a file dialog box appears.
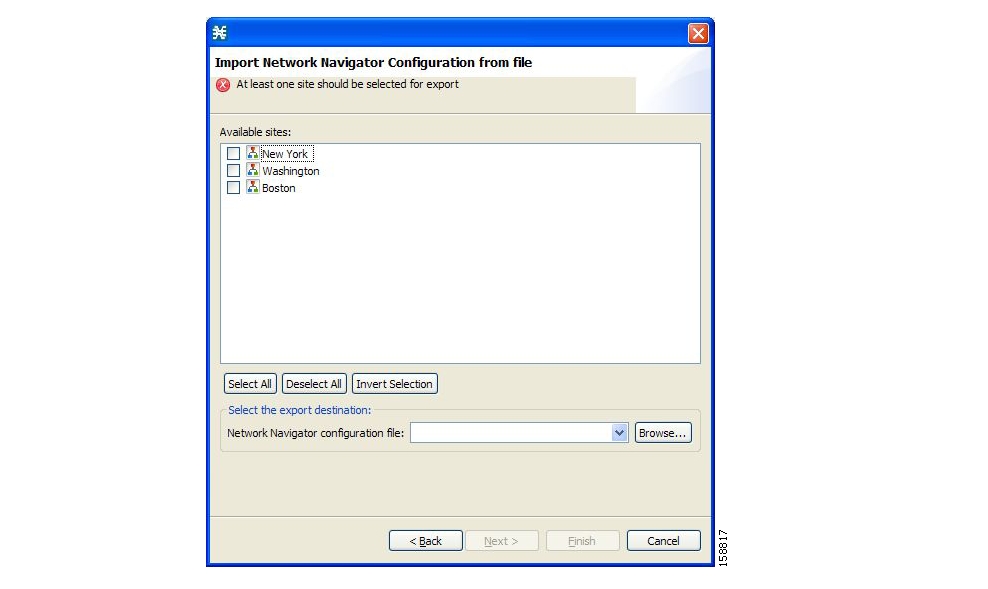
The Available sites pane lists all of the sites in the configuration.
Select the sites to export, using the check boxes and the select buttons.
In the Select the export destination area, click Browse.
An Open dialog box appears.
Browse to the folder where you want to save the configuration file.
In the File name field, enter a new file name, or select an existing
site_xmlfile.Click Open to select the file.
NoteIf the file exists, it will be overwritten.The Open dialog box closes.
Click Finish.
The Export Network Navigator Configuration dialog box closes.
The configuration is saved to the file.
To import a Network Navigator configuration to a file:
From the Console main menu, choose File > Import.
The Import dialog box appears.
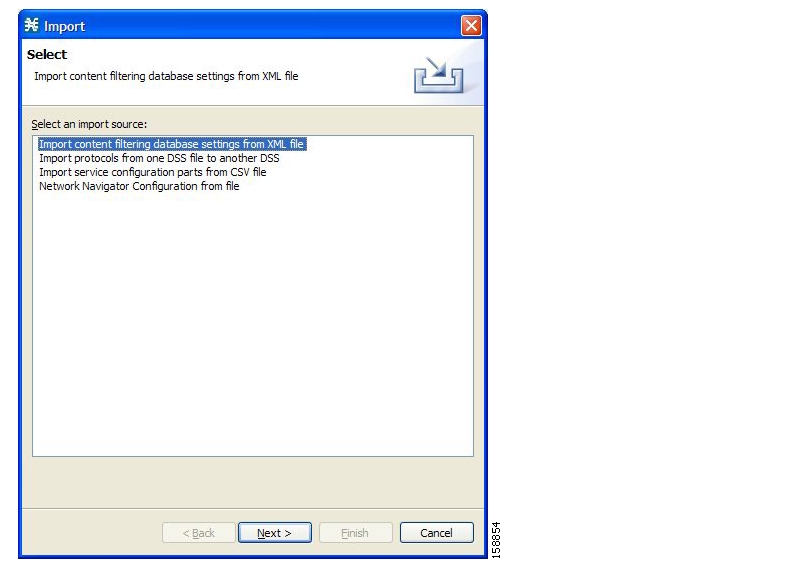
From the import source list, select Network Navigator Configuration from file.
Click Next.
The Import Network Navigator Configuration from file dialog box appears.
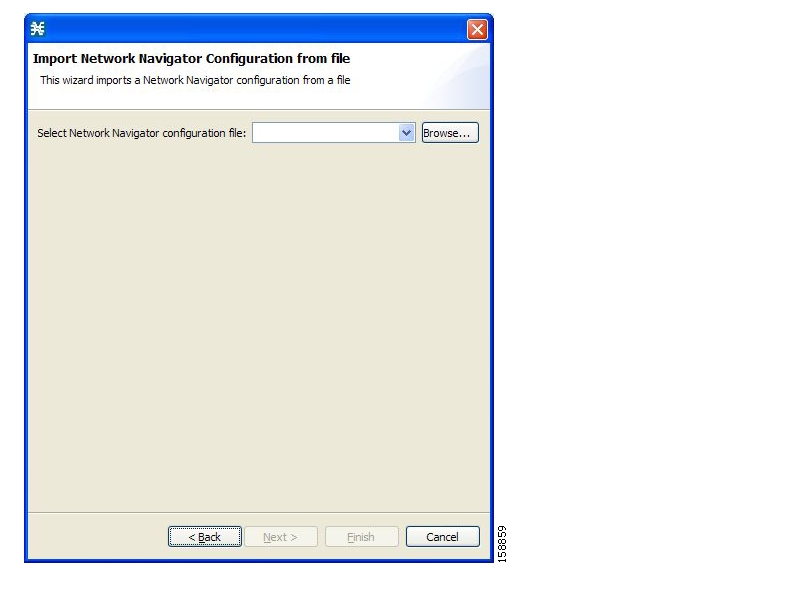
Click Browse.
An Open dialog box appears.
Browse to the folder containing the file to import, and select a
site_xmlfile.Click Open to select the file.
The Open dialog box closes.
Click Finish.
The Import Network Navigator Configuration dialog box closes.
The configuration is imported from the file.
The following table lists the firewall/NAT open port settings required for the Network Navigator to operate properly.
Table 5.1. Required Firewall/NAT Settings
|
Source |
Destination |
Comments |
|---|---|---|
|
Workstation |
SCE port 14374/TCP |
PRPC—Required for all SCE operations |
|
SCE |
Workstation port 21/TCP |
FTP—Required for the following SCE operations:
|
|
SCE |
Workstation ports 21000/TCP to 21010/TCP |
FTP—Alternative to port 21/TCP, required if port 21/TCP is already used by another application on the workstation |
|
Workstation |
SM port 14374/TCP |
PRPC—Required for all SM operations |
|
Workstation |
CM port 14375/TCP |
PRPC—Required for the CM Online Status operation and for CM authentication |
The SCA Reporter may have additional requirements for connecting to the database. See the Cisco Service Control Application Reporter User Guide for more information.
User authentication is performed when a PRPC connection is made to an SCE platform, a CM, or an SM. For authentication to succeed, a PRPC server must be running at the destination, and you must know the username and password of a user of the server.
You define the username and password using a command-line utility in the SM and CM, or the user/password mechanism in the SCE platform.
For more information about defining users, see the following:
CM—“Managing Users” in the “Managing the Collection Manager” chapter of the Cisco Service Control Management Suite Collection Manager User Guide
SM—“p3rpc Utility” in the “Command-Line Utilities” appendix of the Cisco Service Control Management Suite Subscriber Manager User Guide
SCE—“TACACS+ Authentication, Authorization, and Accounting” in the “Configuring the Management Interface and Security” chapter of the Cisco Service Control Engine (SCE) Software Configuration Guide
This chapter describes how to use the Service Configuration Editor tool.
When you first open the Service Configuration Editor tool, a No Service Configuration Is Open dialog box appears.

To create a new service configuration (see Adding New Service Configurations) click Yes.
To open an existing service configuration (see Opening Existing Service Configurations) click No.
When you first add or open a service configuration, the Configuration option is added to the main menu.
You can have many service configurations open at one time; each is displayed in its own tab, and you click a tab to make that service configuration active.
When a service configuration has unsaved changes, an asterisk precedes its name on the tab.
A service configuration is a data structure that defines how the Service Control Engine (SCE) platform analyses network traffic, what rules apply to the traffic, and what actions the SCE platform takes to enforce these rules.
A service configuration consists of the following two main elements:
Services—Define the categories to which transactions are classified
Packages—Define how the SCE platform acts upon transactions from different services
Service configurations are stored as PQB files.
You can add a new service configuration whenever necessary.
Note
You cannot add a second new service configuration until you have saved the first one.
To add a new service configuration:
In the toolbar, click
 (New Service Configuration).
If you have set a default DSS file (see The Default DSS File), a Default Signature message appears.

(Recommended) Click Yes to import the default DSS file.
Click No to continue without importing the default DSS file.
The new service configuration is added to the Console window, open on the Network Traffic tab, and becomes the active service configuration.

When a new service configuration opens, it contains the default service configuration supplied with SCA BB. This includes a default package, which contains a default service rule.
You can open a saved service configuration for viewing or for editing, or to apply it to an SCE platform.
Service configuration files have the extension PQB.
To open a service configuration file:
Do one of the following:
From the Console main menu, choose File > Open Service Configuration.
In the toolbar, click
 (Open A Service Configuration File).
An Open dialog box appears.
Browse to a service configuration file.
Click Open.
The Open dialog box closes.
If the default DSS file has not been imported into the service configuration, a Default Signature message appears.
(Recommended) Click Yes to import the default DSS file.
Click No to continue without importing the default DSS file.
The service configuration is loaded into the Console:
This service configuration becomes the active service configuration.
The title of the Console window displays the name of this service configuration.
You can save the active service configuration.
To save the current service configuration to a service configuration file:
From the Console main menu, choose File > Save As.
A Save As dialog box appears.
Browse to the folder where you want to save the file containing the service configuration.
In the File name field, enter a new file name, or select an existing PQB file.
Click Save.
The service configuration is saved to the selected file. If the file exists, it is overwritten.
During processing, a Saving Service Configuration File message appears.
To save the current service configuration to the file from which it was loaded:
In the toolbar, click
 (Save).
If the current service configuration was not loaded from a PQB file (that is, if it is new, or it was retrieved from an SCE platform), the Save As dialog box opens as in the previous procedure.
To close a service configuration:
On a service configuration tab, click
 (Close).
If there are no unsaved changes, the service configuration tab closes.
If there are unsaved changes a Save Resource message appears.

Click Yes:
If this is an existing edited service configuration, the changes are saved and the service configuration tab closes.
If this is a new service configuration, a Save As dialog box opens.
Enter a name for the service configuration and click Save.
The Save As dialog box closes, the changes are saved, and the service configuration tab closes.
You can export service configuration data from the current service configuration to CSV files. The CSV file formats are described in the “CSV File Formats” chapter of the Cisco Service Control Application Suit for Broadband Reference Guide.
To export one type of service configuration element to a CSV file:
From the Console main menu, choose File > Export.
The Export dialog box appears.
From the export destination list, select Export service configuration parts to CSV file.
Click Next.
The Export Service Configuration Parts dialog box appears.
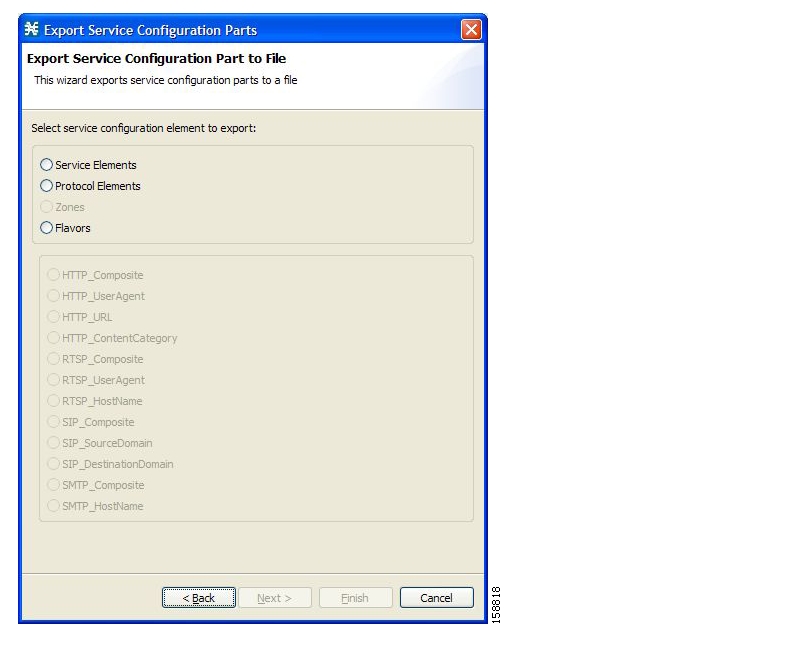
Select one of the Select service configuration element to export radio buttons:
Service Elements
Protocol Elements
Zones
Flavors
If you select Flavors, the flavors in the flavor area of the dialog box are enabled.
NoteOnly those flavors for which a flavor type is defined in this service configuration are enabled.If you selected Flavors, select one of the flavor type radio buttons.
Click Next.
The second screen of the Export Service Configuration Parts dialog box opens.
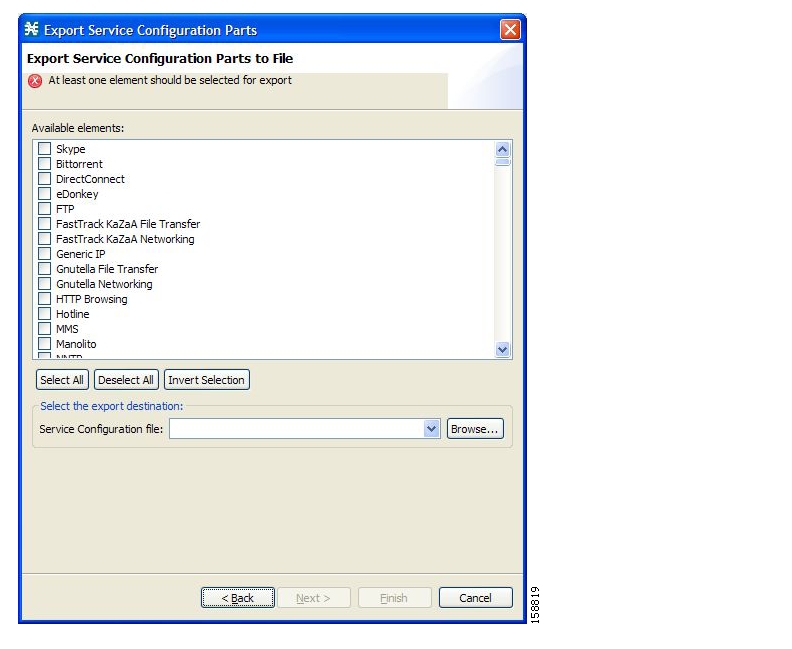
The Available elements pane lists all elements in the service configuration of the selected type.
Select the elements to export, using the check boxes and the select buttons.
In the Select the export destination area, click Browse.
An Open dialog box appears.
Browse to the folder where you want to save the file containing the service configuration elements.
In the File name field, enter a new file name, or select an existing CSV file.
Click Open to select the file.
If the file exists, it will be overwritten.
The Open dialog box closes.
Click Finish.
The selected service configuration elements are exported to the file.
An Export Complete message appears.

Click OK.
The Export Service Configuration Parts dialog box closes.
You can import service configuration data to the current service configuration from CSV files. The CSV file formats are described in the “CSV File Formats” chapter of the Cisco Service Control Application Suit for Broadband Reference Guide.
To import one type of service configuration element from a CSV file:
From the Console main menu, choose File > Import.
The Import dialog box appears.
From the Select an import source list, select Import service configuration parts from CSV file.
Click Next.
The Import Service Configuration Parts dialog box appears.
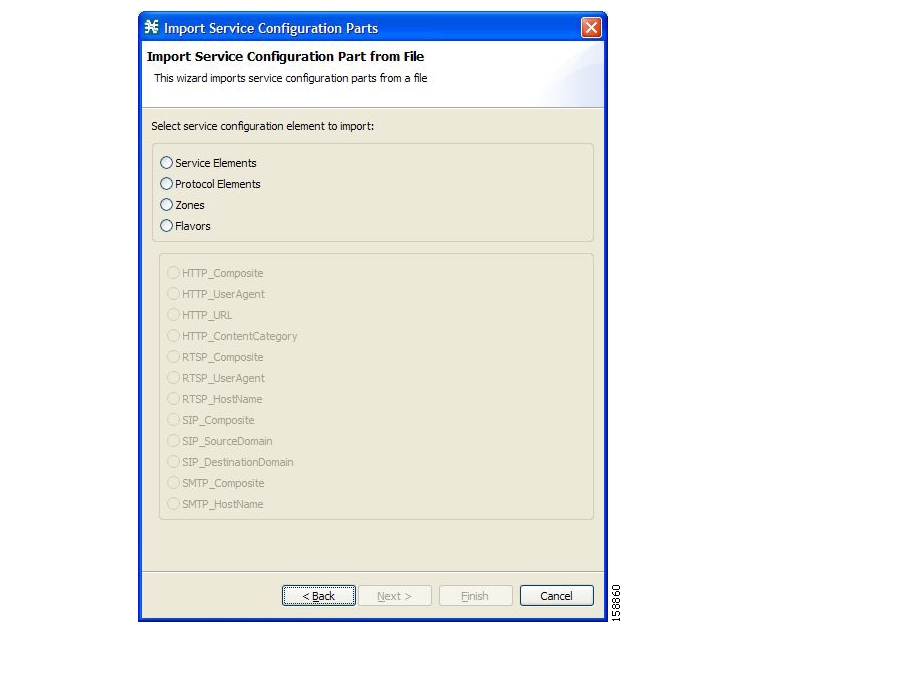
Select one of the Select service configuration element to import radio buttons:
Service Elements
Protocol Elements
Zones
Flavors
If you select Flavors, the flavors in the flavor area of the dialog box are enabled.
If you selected Flavors, select one of the flavor type radio buttons.
Click Next.
The second screen of the Import Service Configuration Parts dialog box opens.
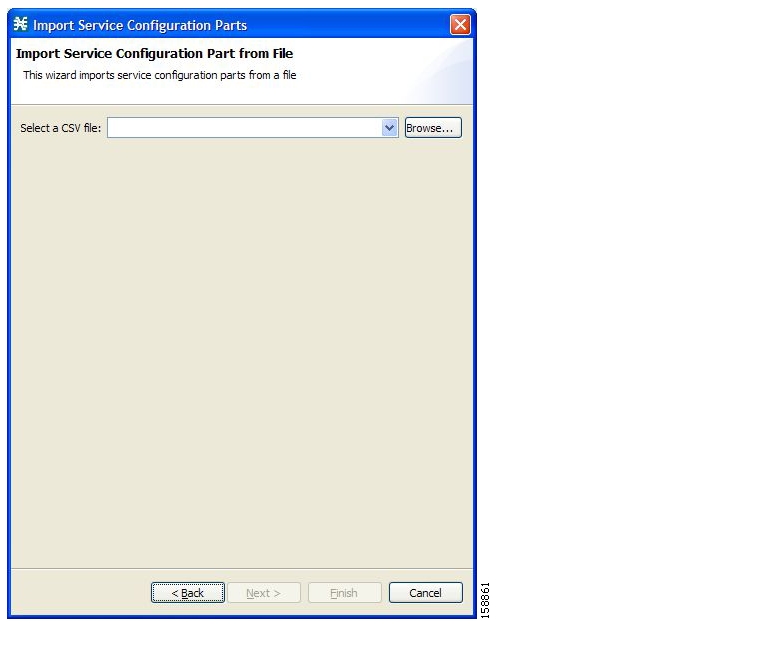
Click Browse.
An Open dialog box appears.
Browse to the folder containing the file to import, and select a CSV file.
Click Open to select the file.
The Open dialog box closes.
Click Finish.
The configuration elements are imported from the file.
An Import Complete message appears.

Click OK.
The Import Service Configuration Parts dialog box closes.
For a new or edited service configuration to take effect, you must apply it to the SCE platform. Otherwise, the SCE platform continues to enforce the previous service configuration.
You can use the Service Configuration Editor to apply a service configuration to an SCE platform, but not to retrieve a service configuration.
You can apply or retrieve a service configuration using:
servconf, the SCA BB Service Configuration Utility (see Using the SCA BB Service Configuration Utility)
Use the Validate option to validate the new or updated service configuration currently displayed. The validation process checks for overall service configuration coherence, and points out possible pitfalls in the service configuration.
The Validate process runs automatically when you select Apply Service Configuration to SCE devices. The Service Configuration Validation dialog box appears only if the procedure found errors or issued warnings regarding the current service configuration.

When you click Apply Service Configuration to SCE Devices, the current service configuration is validated. If there is a problem and the validation process ends with a warning or error, the service configuration Validation dialog box appears, supplying the validation results. Select Apply, or correct the problem before applying the service configuration. Use the Validation menu command to manually validate the service configuration.
To apply the current service configuration to SCE platforms:
In the toolbar, click
(Apply Service Configuration to SCE Devices).The Select SCE Devices dialog box appears.

All SCE platforms defined in the Network Navigator are listed in the dialog box.
Select one or more SCE platforms from the list.
Click OK.
A Password Management dialog box appears for each platform selected.
Enter the appropriate password. (For more information, refer to Password Management.)
Click Apply.
The Password Management dialog box closes.
An Applying service configuration to SCE progress bar appears for each SCE platform selected.
The service configuration is applied to the selected SCE platforms.
Traffic classification is the first step in creating a Cisco Service Control Application for Broadband (SCA BB) service configuration. Traffic is classified according to services.
For each commercial service that providers offer to their subscribers, a corresponding service is defined in the Cisco Service Control solution. You can use this service to classify and identify the traffic, report on its usage, and control it.
This chapter how explains how to work with services and their elements and subelements.
Services are used to classify controlled traffic.
A service consists of one or more service elements; different network traffic transaction types are mapped to different service elements.
Traffic is classified on the basis of some or all of the following:
Protocol—The protocol used by the transaction, as identified by the Service Control Engine (SCE) platform
Initiating side—Where the transaction was initiated
Zone—IP address of the network-side host of the transaction
Flavor—Specific Layer 7 properties of the transaction; for instance, hostnames of the network-side host of the transaction
A service configuration can contain up to 500 services and 10,000 service elements. Every service element in a service configuration must be unique.
A service is defined by the following parameters:
General parameters:
Name—A unique name
Description—(Optional) A description of the service
Hierarchy parameters:
Parent Service
The default service, which is the base of the service hierarchy, does not have a parent.
NoteThe parent service is important when services share usage counters (see next parameter).Service Usage Counters—Used by the system to generate data about the total use of each service. A service can use either its own usage counters, or those of the parent service.
Each usage counter has:
A name assigned by the system (based on the service name).
NoteAn asterisk is appended to a service counter name whenever the counter applies to more than one service.A unique counter index—A default value of the counter index is provided by the system. Do not modify this value.
Advanced parameter:
Service Index—A unique number by which the system recognizes the service (changing the service name does not affect SCE platform activity). A default value of the service index is provided by the system. Do not modify this value.
These parameters are defined when you add a new service (see Adding and Defining Services). You can modify them at any time (see Editing Services).
You can view a hierarchy tree of all existing services and see their associated service elements.
To view all services:
In the current service configuration, click the Services tab.
The Services tab appears.
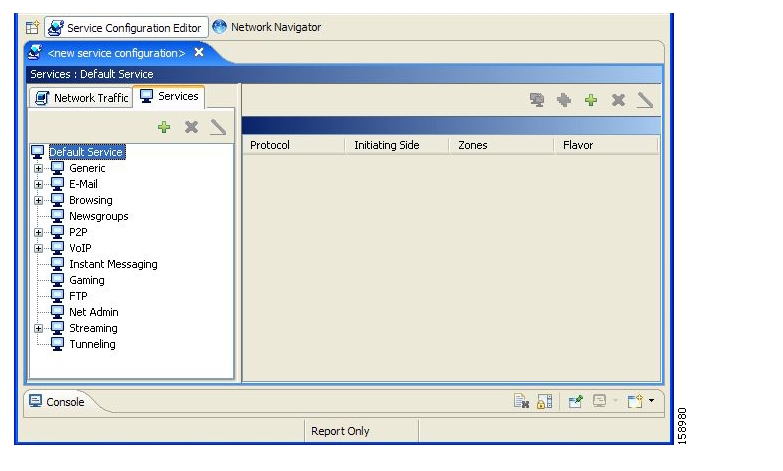
A list of all services is displayed in the service tree (left pane).
Click a service in the hierarchy to display its service elements.
A list of all service elements defined for this service is displayed in the right (Service Element) pane.
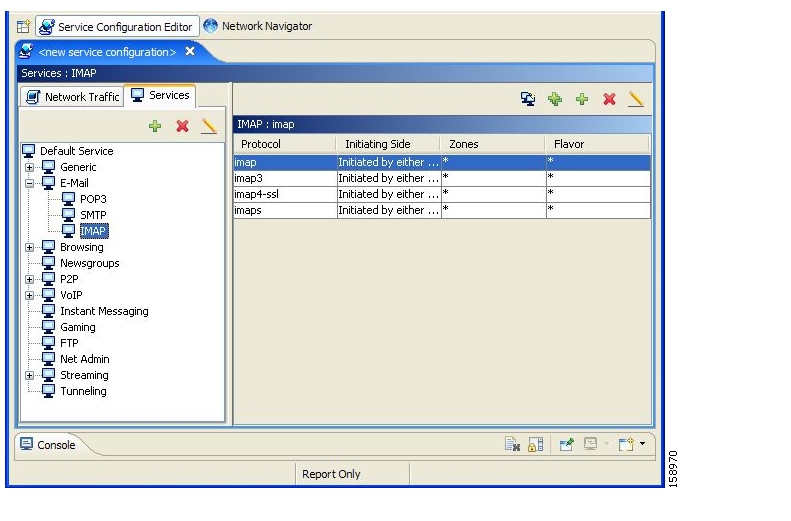
To view more information about a service, select a service from the service tree and click
 (Edit Service).
The Service Settings dialog box appears.
A number of services are predefined in the Console installation. You can add additional services to a service configuration, subject to the limit of 500 services (including predefined services) per service configuration.
After you have added and defined a new service, you can add service elements to the service (see Adding Service Elements).
To add a service to a service configuration:
In the Services tab, select a service from the service tree. This service will be the parent of the service you are adding.
In the left pane, click
 (Add Service).
The Service Settings dialog box appears.
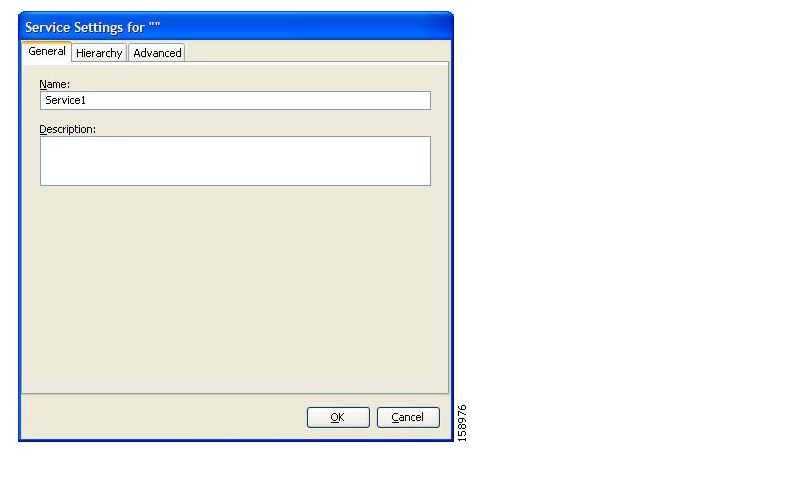
In the Name field, enter a unique and relevant name for the service.
(Optional) In the Description field, enter a meaningful and useful description of the service.
To set exclusive usage counters for this service, or to change the parent service you selected when adding the service, continue with the instructions in the section Defining Hierarchical Settings for a Service.
To specify an index for this service, continue with the instructions in the section Setting the Service Index.
NoteThe system automatically assigns a free number for the new service. Modify this number only where a specific index value must be assigned to a specific service.Click OK.
The Service Settings dialog box closes.
The service is added to the service tree as a child to the service you selected in the hierarchy.
To select a parent service and set the service usage counters:
In the Service Settings dialog box, click the Hierarchy tab.
The Hierarchy tab opens.

To set a different parent service, select the desired parent from the Parent Service drop-down list.
By default, a new service uses its parent’s global usage counter. To define an exclusive global usage counter, check the Map this Service to an exclusive Global usage counter check box.
The name in the read-only Global counter of this service field changes to reflect your choice.
The Counter Index drop-down list is enabled.
(Optional) Select a value for the counter index from the Counter Index drop-down list.
NoteA default value of the counter index is provided by the system. Do not modify this value.By default, a new service uses its parent’s subscriber usage counter. To define an exclusive subscriber usage counter, check the Map this Service to an exclusive Subscriber usage counter check box.
The name in the read-only Subscriber counter of this service field changes to reflect your choice.
The Counter Index drop-down list is enabled.
(Optional) Select a value for the counter index from the Counter Index drop-down list.
NoteA default value of the counter index is provided by the system. Do not modify this value.To specify an index for this service, continue with the instructions in the section Setting the Service Index.
NoteThe system automatically assigns a free number for the new service. Modify this number only where a specific index value must be assigned to a specific service.Click OK.
The Service Settings dialog box closes.
The service is added to the service tree as a child to the service selected in the Parent Service drop-down list.
To set a value for the service index:
In the Service Settings dialog box, click the Advanced tab.
The Advanced tab opens.
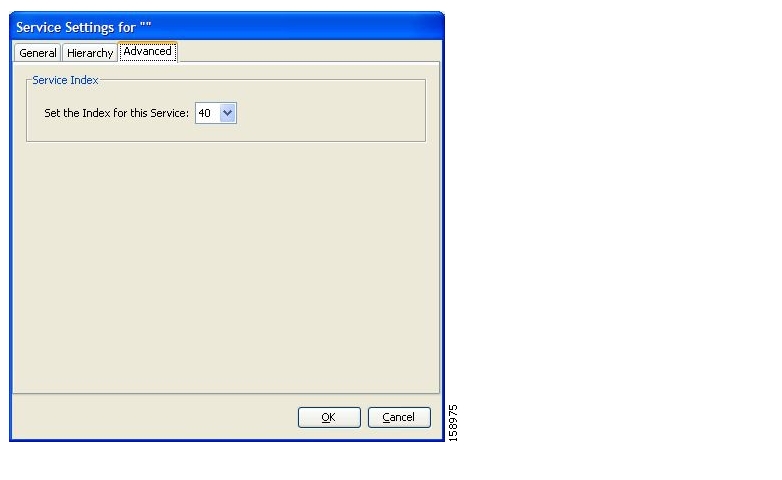
From the Set the Index for this Service drop-down list, select a service index.
The service index must an integer in the range 1 to 499; zero is reserved for the default service.
NoteThe system automatically assigns a free number for the new service. Modify this number only where a specific index value must be assigned to a specific service.Click OK.
The Service Settings dialog box closes.
The service is added to the service tree as a child to the service selected in the Parent Service drop-down list.
You can modify the parameters of a service, even those included in the Console installation.
To add, modify, or delete service elements, see Managing Service Elements.
To edit a service:
Check the Map this Service to an exclusive Global usage counter check box.
The name in the read-only Global counter of this service field changes to reflect your choice.
The Counter Index drop-down list is enabled.
Select a value for the counter index from the Counter Index drop-down list.
NoteA default value of the counter index is provided by the system. Do not modify this value.To share a subscriber usage counter with the parent service, uncheck the Map this Service to an exclusive Subscriber usage counter check box.
The name of the parent service’s counter is displayed in the Subscriber counter used by this service field.
To define an exclusive subscriber usage counter:
Check the Map this Service to an exclusive Subscriber usage counter check box.
The name in the read-only Subscriber counter of this service field changes to reflect your choice.
The Counter Index drop-down list is enabled.
Select a value for the counter index from the Counter Index drop-down list.
NoteA default value of the counter index is provided by the system. Do not modify this value.In the Services tab, select a service from the service tree.
In the left pane, click
(Edit Service).The Service Settings dialog box appears.
To give a new name to the service, enter a new name in the Name field.
To give a new description for the service, enter a new description in the Description field.
To change hierarchical settings, click the Hierarchy tab.
The Hierarchy tab opens.
To set a different parent service, select the desired service from the Parent Service drop-down list.
To share a global usage counter with the parent service, uncheck the Map this Service to an exclusive Global usage counter check box.
The name of the parent service’s counter is displayed in the Global counter used by this service field.
To define an exclusive global usage counter:
To change the service index:
In the Service Settings dialog box, click the Advanced tab.
The Advanced tab opens.
From the Set the Index for this Service drop-down list, select a service index.
The service index must an integer in the range 1 to 499; zero is reserved for the default service.
NoteA default value of the service index is provided by the system. Do not modify this value.
Click OK.
The Service Settings dialog box closes.
The changes to the service are saved.
You can delete all services, even those in the Console installation, with the exception of the default service.
To delete a service:
In the Services tab, select a service from the service tree.
In the left pane, click
 (Delete Service).
A Service Warning message appears.
Click Yes.
If any package has a rule for this service (see Managing Rules), a second Service Warning message appears.
Click Yes.
The service is deleted and is no longer displayed in the service tree. Any rules for the service are also deleted.
Children of the deleted service are not deleted; they move up one level in the service tree.
A service is a collection of service elements. Therefore, to complete the definition of a service, you must define its service elements. A service element maps a specific protocol, initiating side, zone, and flavor to the selected service.
For more information, see Managing Protocols, Managing Zones, and Managing Flavors.
A service configuration can contain up to 10,000 service elements. Every service element must be unique.
A traffic flow is mapped by a service element to the service element’s service if it meets all five of the following criteria:
The flow uses the specified protocol of the service element.
The flow is initiated by the side (network, subscriber, or either) specified for the service element.
The destination of the flow is an address that belongs to the specified zone of the service element.
The flow matches the specified flavor of the service element.
The service element is the most specific service element satisfying the first four criteria.
When necessary, you can add new service elements to a service. (The most useful service elements are included in the Console installation.) A service may have any number of service elements (subject to the limit of 10,000 service elements per service configuration).
Note
Every service element must be unique; if, at any stage, the new service element is the same as an existing one, an error message is displayed in the dialog box and the Finish button is dimmed. If this occurs, modify the value in at least one field.
To add and define a service element:
In the Services tab, select a service from the service tree.
In the right (Service Elements) pane, click
(Add Service Element).The New Service Element dialog box appears.
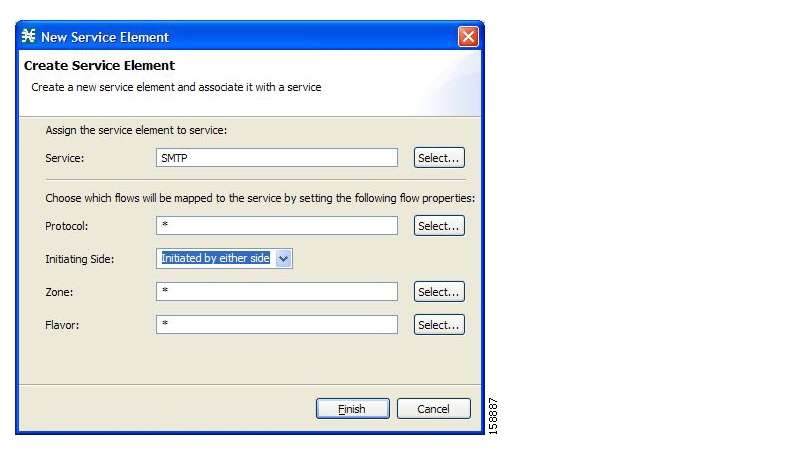
To change the service to which this service element is assigned, click the Select button next to the Service field.
The Select a Service dialog box appears, displaying a list of all services.

Select a service from the list.
Click OK.
The Select a Service dialog box closes.
The selected service is displayed in the Service field of the New Service Element dialog box.
Click the Select button next to the Protocol field.
NoteThe default value (an asterisk, *) means that no protocol checking is performed when testing if a flow maps to this service element.The Select a Protocol dialog box appears, displaying a list of all protocols.
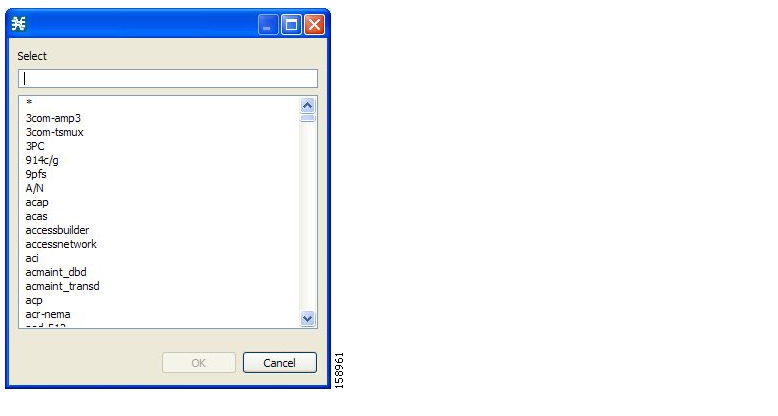
Select a protocol from the list. You can type in the field at the top of the dialog box to help locate the desired protocol.
Click OK.
The Select a Protocol dialog box closes.
The selected protocol is displayed in the Protocol field of the New Service Element dialog box.
In the Initiating Side field, click the drop-down arrow.
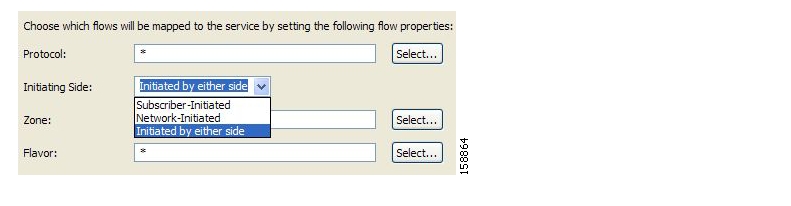
Select the appropriate initiating side from the drop-down list. The following options are available:
Subscriber-Initiated—Transactions are initiated at the subscriber side towards (a server at) the network side.
Network-Initiated—Transactions are initiated at the network side towards (a server at) the subscriber side.
Initiated by either side
Click the Select button next to the Zone field.
NoteThe default value (an asterisk, *) means that no zone checking is performed when testing if a flow maps to this service element.The Select a Zone dialog box appears, displaying a list of all zones.

Select a zone from the list.
Click OK.
The Select a Zone dialog box closes.
The selected zone is displayed in the Zone field of the New Service Element dialog box.
Click the Select button next to the Flavor field.
NoteThe default value (an asterisk, *) means that no flavor checking is performed when testing if a flow maps to this service element.The Select a Flavor dialog box appears, displaying a list of all flavors.
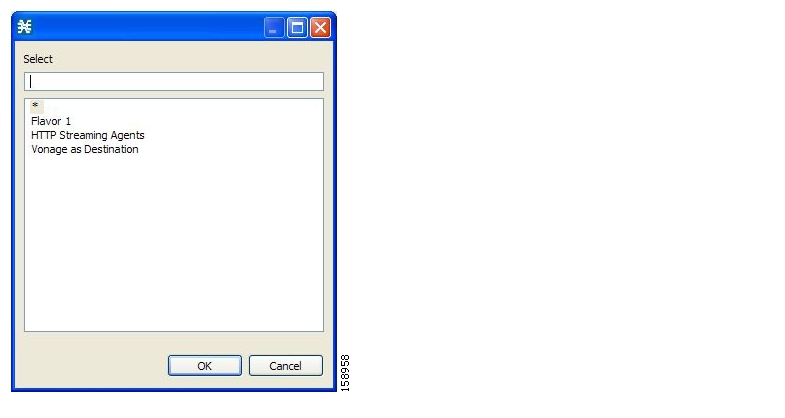
Select a flavor from the list.
Click OK.
The Select a Flavor dialog box closes.
The selected flavor is displayed in the Flavor field of the New Service Element dialog box.
Click Finish.
The New Service Element dialog box closes.
The new service element is added to the service.
A new row, representing the service element, is added to the service element list in the Service Elements pane.
Duplicating an existing service element is a useful way to add a new service element that is similar to an existing service element. It is faster to duplicate a service element and then make changes than to define the service element from scratch.
Note
Every service element must be unique; if, at any stage, the new service element is the same as an existing one, an error message is displayed in the dialog box and the Finish button is dimmed. If this occurs, modify the value in at least one field.
To duplicate a service element:
In the Services tab, select a service from the service tree.
A list of associated service elements is displayed in the Service Elements pane.
In the Service Elements pane, select a service element to duplicate.
Click
 (Duplicate Service Element).
The Copy Service Element dialog box appears.
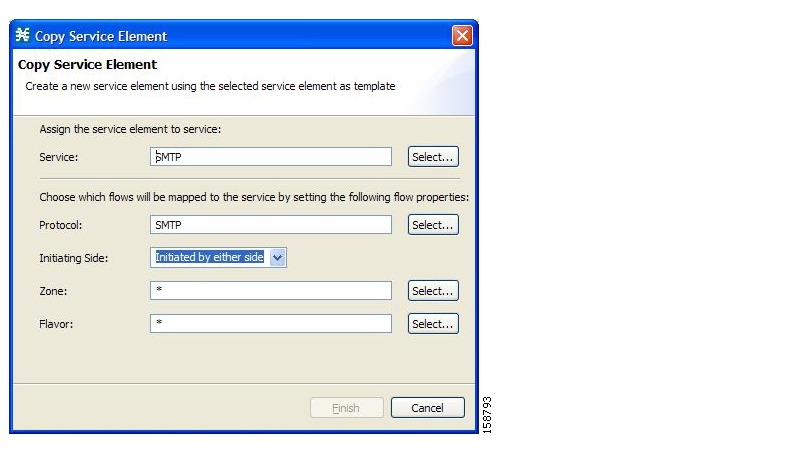
Modify the service element (see Editing Service Elements).
NoteBefore you can save the new service element, you must change the value in at least one field.
You can modify all service elements, even those included in the Console installation.
Note
Every service element must be unique. If, at any stage, the modified service element is the same as an existing one, an error message is displayed in the dialog box and the Finish button is dimmed. If this occurs, modify the value in at least one field.
To edit a service element:
In the Services tab, select a service from the service tree.
A list of associated service elements is displayed in the Service Elements pane.
In the Service Elements pane, select a service element to edit.
In the Services Elements pane, click
(Edit Service Element).The Edit Service Element dialog box appears.
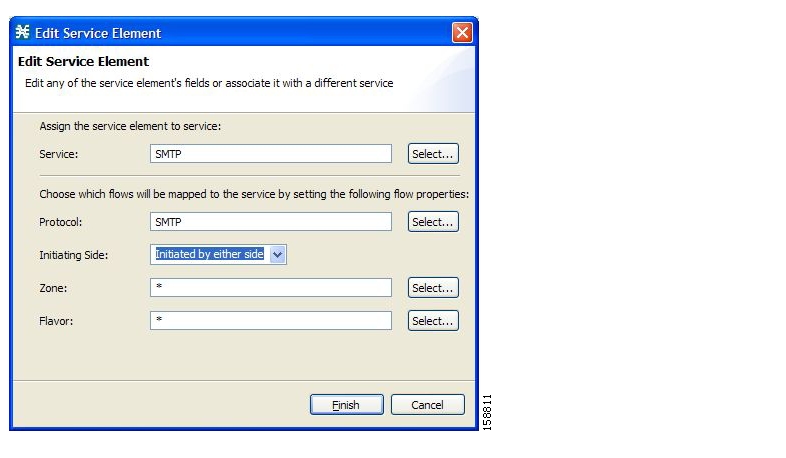
To change the service to which this service element is assigned, click the Select button next to the Service field.
The Select a Service dialog box appears, displaying a list of all services.
Select a service from the list.
Click OK.
The Select a Service dialog box closes.
The selected service is displayed in the Service field of the Edit Service Element dialog box.
To change the protocol of this service element, click the Select button next to the Protocol field.
NoteAn asterisk (*) means that no protocol checking is performed when testing if a flow maps to this service element.The Select a Protocol dialog box appears, displaying a list of all protocols.
Select a protocol from the list; you can type in the field at the top of the dialog box to help locate the desired protocol.
Click OK.
The Select a Protocol dialog box closes.
The selected protocol is displayed in the Protocol field of the Edit Service Element dialog box.
To change the initiating side of this service element, click the drop-down arrow in the Initiating Side field.
Select the appropriate initiating side from the drop-down list. The following options are available:
Subscriber-Initiated—Transactions are initiated at the subscriber side towards (a server at) the network side.
Network-Initiated—Transactions are initiated at the network side towards (a server at) the subscriber side.
Initiated by either side
To change the zone of this service element, click the Select button next to the Zone field.
NoteAn asterisk (*) means that no zone checking is performed when testing if a flow maps to this service element.The Select a Zone dialog box appears, displaying a list of all zones.
Select a zone from the list.
Click OK.
The Select a Zone dialog box closes.
The selected zone is displayed in the Zone field of the Edit Service Element dialog box.
To change the flavor of this service element, click the Select button next to the Flavor field.
NoteAn asterisk (*) means that no flavor checking is performed when testing if a flow maps to this service element.The Select a Flavor dialog box appears, displaying a list of all flavors.
Select a flavor from the list.
Click OK.
The Select a Flavor dialog box closes.
The selected flavor is displayed in the Flavor field of the Edit Service Element dialog box.
Click Finish.
The Edit Service Element dialog box closes.
The changes to the service element are saved.
The changes to the service element appear in the service element list in the Service Elements pane.
You can delete all service elements, even those included in the Console installation.
To delete a service element:
In the Services tab, select a service from the service tree.
A list of associated service elements is displayed in the Service Elements pane.
In the Service Elements pane, select a service element to delete.
In the Service Elements pane, click
(Delete Service Element).A Service Warning message appears.

Click Yes.
The service element is deleted and is no longer part of the selected service.
You can move an existing service element from one service to a different service.
To move a service element:
In the Services tab, select a service from the service tree.
A list of associated service elements is displayed in the Service Elements pane.
In the Service Elements pane, select a service element to move.
Click
 (Move Service Element to Another Service).
The Move Service Element dialog box appears, displaying the complete service tree.
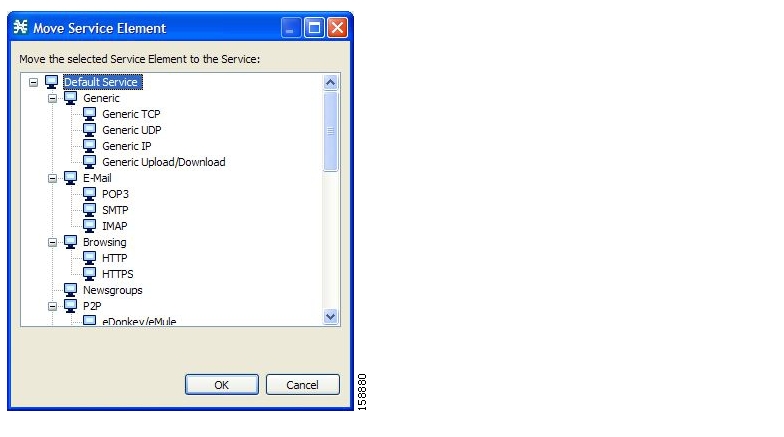
From the service tree, select a service.
Click OK.
The Move Service Element dialog box closes.
The service element is moved to the selected service.
A protocol is composed of an application protocol signature, the destination port or ports, a unique name, and an optional description.
Protocols are used to define service elements (see Managing Service Elements).
You can add new protocols (for example, to classify a new gaming protocol that uses a specific port). You can also edit or delete existing ones.
A service configuration can contain up to 10,000 protocols.
SCA BB supports many commercial and common protocols. For a complete list of protocols included with the current release of SCA BB, see “Protocols” in the “Default Service Configuration Reference Tables” chapter of the Cisco Service Control Application for Broadband Reference Guide. As new protocols are released, Cisco provides files containing the new protocol signatures so that you can add the signatures to your service configuration. (See Adding Signatures to a Service Configuration.)
You can view a list of all protocols and their associated protocol elements.
The protocols are listed in ASCII sort order (that is, 0 ... 9, A ... Z, a ... z).
The protocol elements are not sorted; they are listed in the order in which they were added to the protocol.
To view a list of all protocols:
From the Console main menu, choose Configuration > Protocols.
The Protocol Settings dialog box appears.
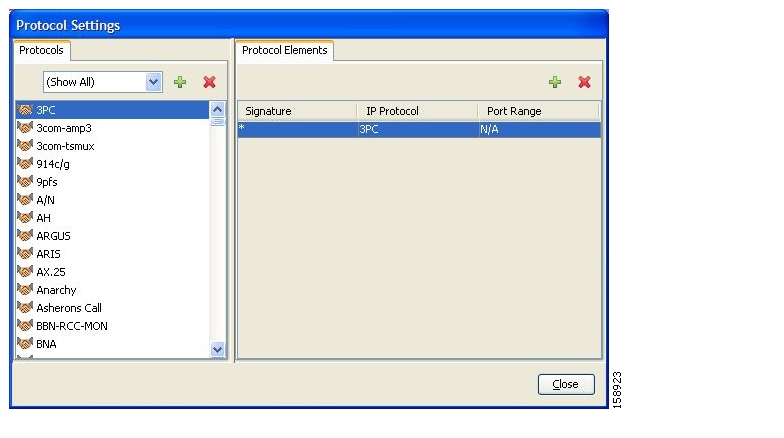
The Protocols tab displays a list of existing protocols.
To view the description and ID of a protocol:
Double-click a protocol.
The Protocol Settings dialog box appears, displaying the protocol name, description, and ID.
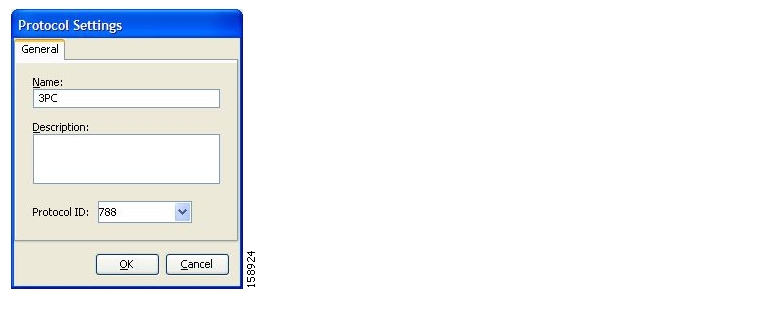
Click Cancel.
The Protocol Settings dialog box closes.
To view a list of protocol elements, select a protocol in the list in the Protocol Settings dialog box.
The protocol elements are displayed in the Protocol Elements tab.
Click Close.
The Protocol Settings dialog box closes.
You can filter the protocols by type, so that the Protocols tab displays only the selected type of protocol.
There are nine categories of protocols:
Generic Protocols—Generic IP, Generic TCP, and Generic UDP protocols, used for transactions that are not specifically mapped to a protocol by any other protocol type.
IP Protocols—Protocols (such as ICMP), other than TCP and UDP protocols, identified according to the IP protocol number of the transaction.
Port-Based Protocols—TCP and UDP protocols, classified according to their well-known ports. The default service configuration includes more than 750 common port-based protocols.
Signature-Based Protocols—Protocols classified according to a Layer 7 application signature. Includes the most common protocols, such as HTTP and FTP, and a large group of popular P2P protocols.
P2P Protocols—Peer-to-peer file sharing application protocols classified according to a Layer 7 application signature.
VOIP Protocols—Voice-over-IP application protocols classified according to a Layer 7 application signature.
SIP Protocols—Protocols classified according to a Layer 7 application signature that is SIP or has SIP characteristics.
Worm Protocols—Protocols classified according to a Layer 7 application signature that is based on traffic patterns of internet worms.
Packet Stream Pattern-Based Protocols—Protocols classified according to a Layer 7 application signature that is based on the pattern of the packet stream (for instance, the stream’s symmetry, average packet size, and rate) rather than on the packet’s payload content.
Note
Some protocols belong to more than one category. In particular, all predefined P2P, VOIP, SIP, Worm, and Packet Stream Pattern-Based Protocols are also defined as Signature-Based Protocols.
To filter the protocol list:
From the Console main menu, choose Configuration > Protocols.
The Protocol Settings dialog box appears.
From the drop-down list in the Protocols tab, select the type of protocol to display.
The protocols of the selected type appear in the Protocols tab.
Click Close.
The Protocol Settings dialog box closes.
NoteThe setting in the drop-down list is not saved. The next time you open the Protocol Settings dialog box, all protocols will be displayed.
You can add new protocols to a service configuration, subject to the limit of 10,000 protocols per service configuration.
To add a new protocol:
From the Console main menu, choose Configuration > Protocols.
The Protocol Settings dialog box appears.
In the Protocols tab, click
(Add Protocol).The Protocol Settings dialog box appears.
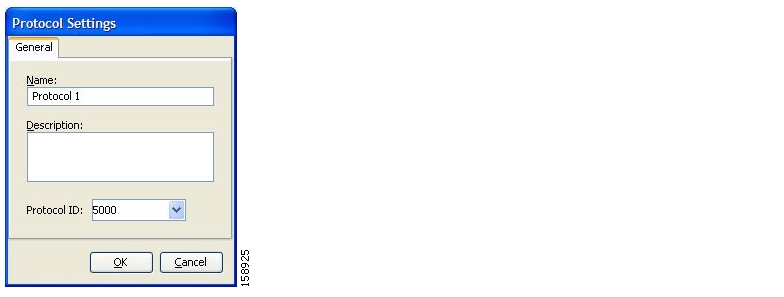
In the Name field, enter a unique name for the new protocol.
(Optional) From the Protocol ID drop-down list, select an ID for the protocol.
The protocol ID must be an integer in the range 5000 to 9998; lower values are reserved for protocols provided by SCA BB.
NoteThe value of the protocol ID is supplied automatically by the system. Do not modify this field.Click OK.
The Protocol Settings dialog box closes.
The new protocol is displayed in the Protocols tab. You can now add protocol elements to it. See Adding Protocol Elements.
You can modify the parameters of a protocol, even those included in the Console installation.
To add, modify, or delete protocol elements, see Managing Protocol Elements.
To edit a protocol:
From the Console main menu, choose Configuration > Protocols.
The Protocol Settings dialog box appears.
In the Protocols tab, double-click a protocol.
The Protocol Settings dialog box appears.
Modify fields in the dialog box:
In the Name field, enter a new name for the protocol.
From the Protocol ID drop-down list, select an ID for the protocol.
The protocol ID must be an integer in the range 5000 to 9998; lower values are reserved for protocols provided by SCA BB.
NoteThe value of the protocol ID is supplied automatically by the system. Do not modify this field.
Click OK.
The Protocol Settings dialog box closes.
The new values of the protocol parameters are saved.
Click Close.
The Protocol Settings dialog box closes.
You can delete all protocols, even those included in the Console installation.
To delete a protocol:
From the Console main menu, choose Configuration > Protocols.
The Protocol Settings dialog box appears.
In the Protocols tab, select a Protocol.
In the Protocols tab, click
(Delete Protocol).A Protocol Warning message appears.
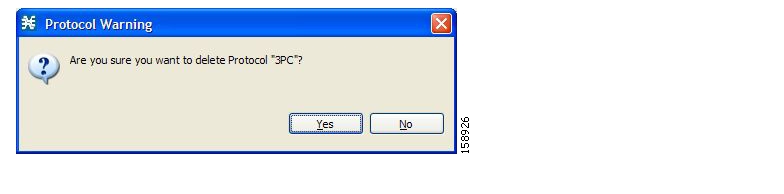
Click Yes.
If any service element maps the selected protocol to a service (see Managing Service Elements), a second Protocol Warning message appears (even if the service is not used by any package).
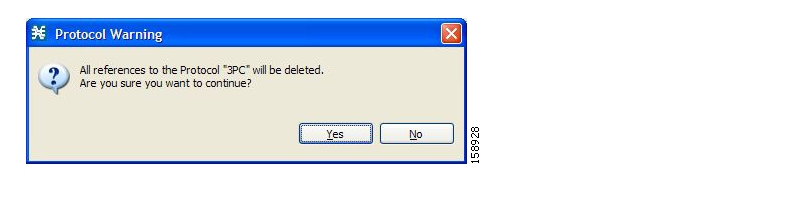
Click Yes.
The Protocol is deleted from the Protocols tab.
Click Close.
The Protocol Settings dialog box closes.
A protocol is a collection of protocol elements.
To complete the definition of a protocol, you must define its protocol elements. A protocol element maps a specific signature, IP protocol, and port range to the selected protocol. Every protocol element in a service configuration must be unique.
A traffic flow is mapped to a specific protocol if it meets all four of the following criteria:
The flow belongs to the specified signature of the protocol element.
The flow protocol is the specified IP protocol of the protocol element.
(If the IP protocol is TCP or UDP) The destination port is within the specified port range of the protocol element.
The protocol element is the most specific protocol element satisfying the first three criteria.
You can add any number of protocol elements to a protocol.
Note
When you set the parameters of the protocol element, the values of the parameters are saved as you enter them.
To add and define a protocol element:
From the Console main menu, choose Configuration > Protocols.
The Protocol Settings dialog box appears.
In the Protocols tab, select a protocol.
In the Protocol Elements tab, click
(Add Protocol Element).A protocol element is added to the protocol.
A new row, representing the protocol element, is added to the protocol element list in the Protocol Element tab.
Click in the Signature cell of the protocol element, and then click the Browse button that appears in the cell.
NoteThe default value (an asterisk, *) means that no signature checking is performed when testing if a flow maps to this protocol element.The Select a Signature dialog box appears, displaying a list of all signatures.
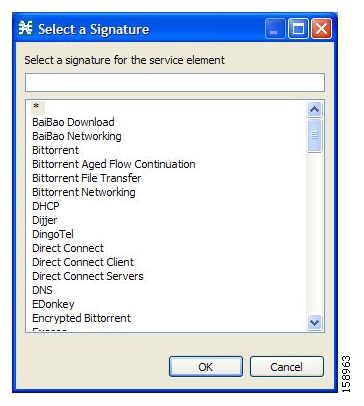
Select a signature from the list.
NoteSelect the Generic signature to allow a flow that has no matching signature in the protocol signature database to be mapped to this protocol element (if the flow also matches the IP protocol and port range of the protocol element).Click OK.
The Select a Signature dialog box closes.
The selected signature is displayed in the Signature cell of the Protocol Settings dialog box.
Click in the IP Protocol cell of the protocol element, and then click the Browse button that appears in the cell.
NoteThe default value (an asterisk, *) means that no IP protocol checking is performed when testing if a flow maps to this protocol element.The Select an IP Protocol dialog box appears, displaying a list of all IP protocols.
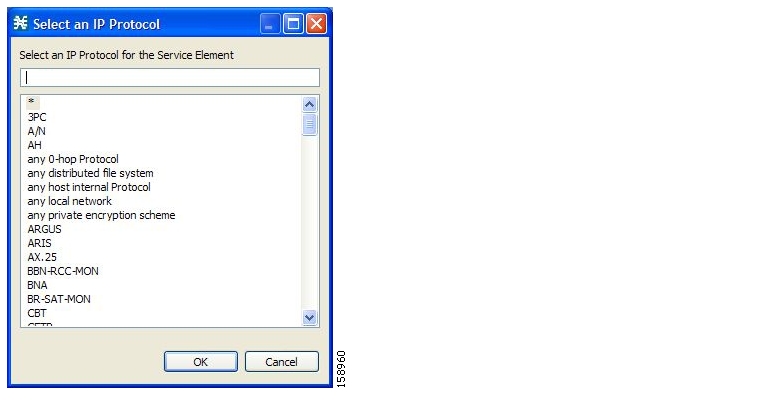
Select an IP protocol from the list.
Click OK.
The Select an IP Protocol dialog box closes
The selected IP protocol is displayed in the IP Protocol cell of the Protocol Settings dialog box.
In the Port Range cell, enter a port or range of ports. (For a range of ports, use a hyphen between the first and last ports in the range.)
NoteSpecifying a port range is only possible when the specified IP protocol is either TCP or UDP (or undefined, taking the wild-card value, *).Only a flow whose port matches one of these ports will be mapped to this protocol element.
The protocol element is defined.
Click Close.
If the protocol element that you have defined is not unique in this service configuration, a Protocol Error message appears.
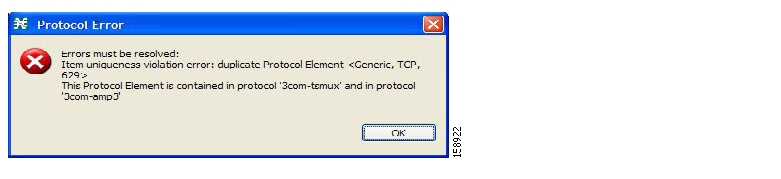
Click OK.
Modify or delete the protocol element.
Click Close.
The Protocol Settings dialog box closes.
You can modify all protocol elements, even those included in the Console installation.
Note
All changes to the protocol element are saved as you make them.
To edit a protocol element:
From the Console main menu, choose Configuration > Protocols.
The Protocol Settings dialog box appears.
In the Protocols tab, select a protocol.
In the Protocol Elements tab, select a protocol element.
Click in the Signature cell of the protocol element, and then click the Browse button that appears in the cell.
The Select a Signature dialog box appears.
Select a signature from the list.
Click OK.
The Select a Signature dialog box closes.
Click in the IP Protocol cell of the protocol element, and then click the Browse button that appears in the cell.
The Select an IP Protocol dialog box appears.
Select an IP protocol from the list.
Click OK.
The Select an IP Protocol dialog box closes.
In the Port Range cell of the protocol element, enter a port or range of ports.
Changes to the protocol element are saved as you make them.
Click Close.
If the protocol element that you have modified is not unique in this service configuration, a Protocol Error message appears.
Click OK.
Modify or delete the protocol element.
Click Close.
The Protocol Settings dialog box closes.
You can delete all protocol elements, even those included in the Console installation.
To delete a protocol element:
From the Console main menu, choose Configuration > Protocols.
The Protocol Settings dialog box appears.
Select a protocol in the Protocols tab.
In the Protocol Elements tab, select a protocol element.
In the Protocol Elements tab, click
(Delete Protocol Element).A Protocol Warning message appears.

Click Yes.
The protocol element is deleted from the Protocol Elements tab.
Click Close.
The Protocol Settings dialog box closes.
A zone is a collection of destination IP addresses; usually the addresses in one zone will be related in some way.
Zones are used to classify network sessions; each network session is assigned to a service element based on its destination IP address.
A service configuration can contain up to 10,000 zone items. Every zone item must be unique.
You can view a list of all zones and their associated zone items.
To view a list of all zones:
From the Console main menu, choose Configuration > Zones.
The Zone Settings dialog box appears.
The Zones tab displays a list of all zones. The first zone in the list is selected, and its zone items are displayed in the Zone Items tab.
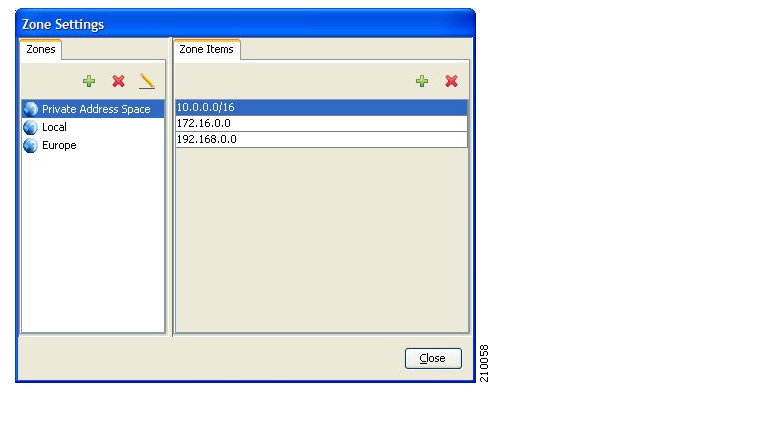
Click a zone in the list to display its zone items.
The zone items of the selected zone are displayed in the Zone Items tab.
Click Close.
The Zone Settings dialog box closes.
To add a zone to a service configuration:
From the Console main menu, choose Configuration > Zones.
The Zone Settings dialog box appears.
In the Zones tab, click
(Add Zone).The Zone Settings dialog box appears.
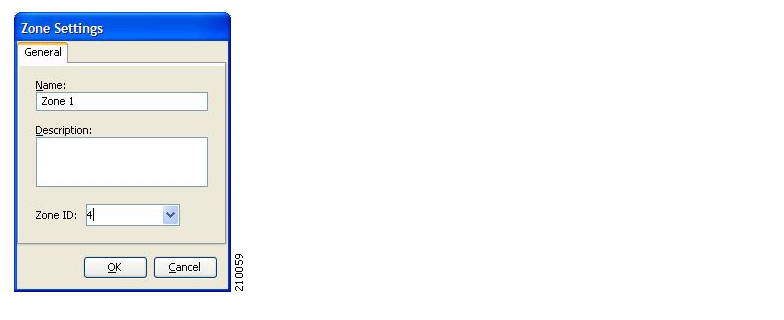
In the Name field, enter a unique name for the new zone.
(Optional) From the Zone ID drop-down list, select an ID for the zone.
The zone ID must be a positive integer in the range 1 to 32767.
NoteThe value of the zone ID is supplied automatically by the system. Do not modify this field.Click OK.
The Zone Settings dialog box closes.
The new zone is added to the Zones tab. You can now add zone items. (See Adding Zone Items.)
You can modify zone parameters at any time.
To add, modify, or delete zone items, see Managing Zone Items.
To edit a zone:
From the Console main menu, choose Configuration > Zones.
The Zone Settings dialog box appears.
In the Zones tab, select a zone.
Click
(Edit Zone).The Zone Settings dialog box appears.
Modify fields in the dialog box:
In the Name field, enter a new name for the zone.
From the Zone ID drop-down list, select an ID for the zone.
The zone ID must be a positive integer in the range 1 to 32767.
NoteThe value of the zone ID is supplied automatically by the system. Do not modify this field.
Click OK.
The Zone Settings dialog box closes.
The new values of the zone parameters are saved.
Click Close.
The Zone Settings dialog box closes.
You can delete any or all zones.
To delete a zone:
From the Console main menu, choose Configuration > Zones.
The Zone Settings dialog box appears.
In the Zones tab, select a zone.
In the Zones tab, click
(Delete Zone).A Zone Warning message appears.

Click OK.
If any service element references the selected zone, a second Zone Warning message appears.
Click Yes.
Every service element that references the selected zone is deleted.
The zone is deleted and is no longer displayed in the Zones tab.
Click Close.
The Zone Settings dialog box closes.
A zone is a collection of related zone items.
A zone item is an IP address or a range of IP addresses.
A service configuration can contain up to 10,000 zone items. Every zone item must be unique.
You can add any number of zone items to a zone (subject to the limitation of 10,000 zone items per service configuration).
To add zone items to a zone:
From the Console main menu, choose Configuration > Zones.
The Zone Settings dialog box appears.
In the Zones tab, select a zone.
In the Zone Items tab, click
(Add Zone Item).A new line is added to the Zone Items table.
Double-click the new list item and enter a valid value.
Valid values are single IP addresses (for example, 63.111.106.7) or a range of IP addresses (for example, 194.90.12.0/24).
Repeat steps 3 and 4 for other IP addresses that will be part of this zone.
Click Close.
If the zone item that you have defined is not unique in this service configuration, a Zone Error message appears.

Click OK.
Modify or delete the zone item.
Click Close.
The Zone Settings dialog box closes.
To edit a zone item:
From the Console main menu, choose Configuration > Zones.
The Zone Settings dialog box appears.
In the Zones tab, select a zone.
In the Zone Items tab, double-click a zone item.
Enter a new value for the zone item.
Valid values are single IP addresses (for example, 63.111.106.7) or a range of IP addresses (for example, 194.90.12.0/24).
Click Close.
If the zone item that you have modified is not unique in this service configuration, a Zone Error message appears.
Click OK.
Modify or delete the zone item.
Click Close.
The Zone Settings dialog box closes.
To delete a zone item:
From the Console main menu, choose Configuration > Zones.
The Zone Settings dialog box appears.
In the Zones tab, select a zone.
In the Zone Items tab, select a zone item.
In the Zone Items tab, click
(Delete Zone Item).The zone item is deleted.
Click Close.
The Zone Settings dialog box closes.
You can view a list of all signatures and the protocol to which each is assigned.
To view a list of all signatures:
From the Console main menu, choose Configuration > Signatures Settings.
The Signatures Settings dialog box appears.
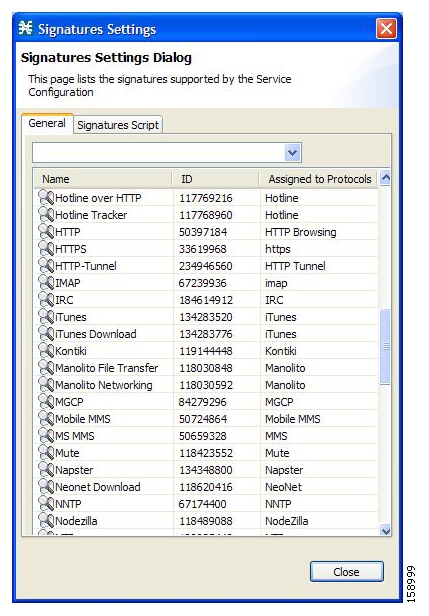
Click Close.
The Signatures Settings dialog box closes.
You can filter the signature by type, so that the Signatures Settings dialog box lists only the selected type of signature.
There are seven categories of signatures:
DSS Contributed Signatures
Not Assigned to any Protocol
P2P Signatures
VOIP Signatures
SIP Signatures
Worm Signatures
Packet Stream Pattern Based Protocols Signatures
Note
Some signatures belong to more than one category.
To filter the signature list:
From the Console main menu, choose Configuration > Signatures Settings.
The Signatures Settings dialog box appears.
From the drop-down list, select the type of signature to display.
The signatures of the selected type appear in the dialog box.
Click Close.
The Signatures Settings dialog box closes.
New protocols are being introduced all the time. Dynamic signatures is a mechanism that allows new protocols to be added to the protocol list and, from there, to service configurations. This is especially useful for classifying the traffic of a new protocol (for example, a new P2P protocol in a P2P-Control solution).
Installing new signatures to an active service configuration is described in Installing Protocol Packs.
Creating and modifying signatures is described in Using the Signature Editor.
Using servconf, the SCA BB Server Configuration Utility, to apply signatures is described in The SCA BB Service Configuration Utility.
The following sections describe working with dynamic signatures in the Service Configuration Editor.
Dynamic signatures are provided in special Dynamic Signatures Script (DSS) files that you can add to a service configuration using either the Console or the Service Configuration API. After a DSS file is imported into a service configuration, the new protocols it describes:
Appear in the protocol list
May be added to services
Are used when viewing reports
To simplify the configuration of new protocols added by a DSS, the DSS may specify a Buddy Protocol for a new protocol. If, when loading a DSS, the application encounters the Buddy Protocol, it automatically duplicates the set of service elements that use the Buddy Protocol, and replaces all references to the Buddy Protocol with references to the new protocol. The association of the new protocol to services will match that of the Buddy Protocol.
The following configuration actions are performed automatically when you import a DSS into a service configuration:
Signatures are updated and new signatures are loaded
Protocol elements are created for new signatures of existing protocols
New protocols are added to the protocol list, and protocol elements are created for them
Service elements are created for new protocols according to the configuration of Buddy Protocols
The import procedure preserves all service and protocol settings.
Note
After importing a DSS, associate the newly added protocols with services.
DSS files are periodically released by Cisco or its partners in accordance with customer requirements and market needs. DSS files contain new protocols and signatures, and update previously defined signatures. Updating a service configuration with the new DSS is explained in Adding Signatures to a Service Configuration.
Note
You can create your own DSS files or modify the Cisco release DSS file using the Signature Editor tool (see Managing DSS Files).
To view information about the current dynamic signatures:
From the Console main menu, choose Configuration > Signatures Settings.
The Signatures Settings dialog box appears.
Click the Signatures Script tab.
The Signatures Script tab opens.
If no DSS file was imported into the current service configuration, the Signatures Settings dialog box displays a message informing you of this.
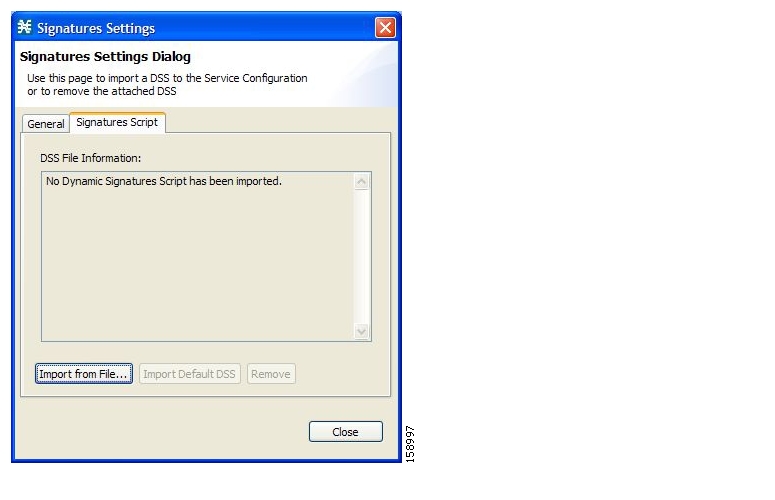
If a DSS file was imported into the current service configuration, the Signatures Settings dialog box displays information about the current dynamic signatures and the DSS file from which they were imported.

Click Close.
The Signatures Settings dialog box closes.
You can import signatures into a service configuration from a DSS file provided by Cisco or one of its partners (described in this section), or from a DSS file that you have created or modified using the Signature Editor tool (see Managing DSS Files).
Note
It is recommended that you import the latest default DSS file (see Importing Dynamic Signatures from the Default DSS File) when creating a service configuration, and that you use this option only to apply a new DSS to existing service configuration.
To import a dynamic signature script from a DSS file:
From the Console main menu, choose Configuration > Signatures Settings.
The Signatures Settings dialog box appears.
Click Import from File.
An Import Warning message appears.
Click Yes.
The Import from file dialog box appears.
Browse to the DSS file and click Open.
The Import from file dialog box closes.
The signatures in the DSS file are imported into the service configuration.
Information about the imported signatures and their DSS file is displayed in the Signatures Settings dialog box.
Click Close.
The Signatures Settings dialog box closes.
You can remove the installed dynamic signatures from a service configuration.
Note
The DSS file is not deleted.
To remove the current dynamic signatures information:
From the Console main menu, choose Configuration > Signatures Settings.
The Signatures Settings dialog box appears.
In the Signatures Settings dialog box, click Remove.
A Dynamic Signature Script Confirmation message appears.

Click OK.
If any service element references a protocol whose signature is included in the imported DSS file, a Dynamic Signature Script Removal Error message appears.

Click Yes.
Every service element that references a protocol whose signature is included in the imported DSS file is deleted.
The dynamic signatures are removed from the service configuration.
The Remove button is dimmed.
If the dynamic signatures were imported from the default DSS file, the Import Default DSS button is enabled.
Click Close.
The Signatures Settings dialog box closes.
Whenever a protocol pack becomes available from Cisco (or one of its partners), you should update offline service configurations (stored as PQB files on the workstation). The protocol pack is provided as either an SPQI file or a DSS file.
Either offer updates automatically to every service configuration created or edited at the workstation or apply them from the workstation to the SCE platform. You make the latest update available by installing the most recent DSS or SPQI file as the default DSS file. You can install the file on the workstation either from the Console or by using the SCA BB Signature Configuration Utility.
The default DSS file is automatically offered for import when any service configuration operation (such as creating a new service configuration or editing an existing one) is performed from the Console on a service configuration that was not yet updated.
The default DSS file is imported by default when any service configuration operation (such as applying an existing service configuration) is performed using servconf, the SCA BB Service Configuration Utility. You can disable this option.
Note
Users are expected to update the default DSS on their management workstation whenever they obtain a new protocol pack, as explained in the following section.
The default DSS file should normally be the latest protocol pack provided by Cisco (or one of its partners). If necessary, modify the protocol pack using the Signature Editor tool (see Editing DSS Files) to add signatures of new protocols until they become available from Cisco.
Whenever a new protocol pack becomes available, set it as the default DSS file. There is no need to clear the current default DSS file; it will be overwritten by the new protocol pack.
To set a protocol pack as the default DSS file:
From the Console main menu, choose Window > Preferences.
The Preferences dialog box appears.
From the menu tree in the left pane of the dialog box, choose Service Configuration > Default DSS.
The Default DSS area opens in the right pane of the dialog box.
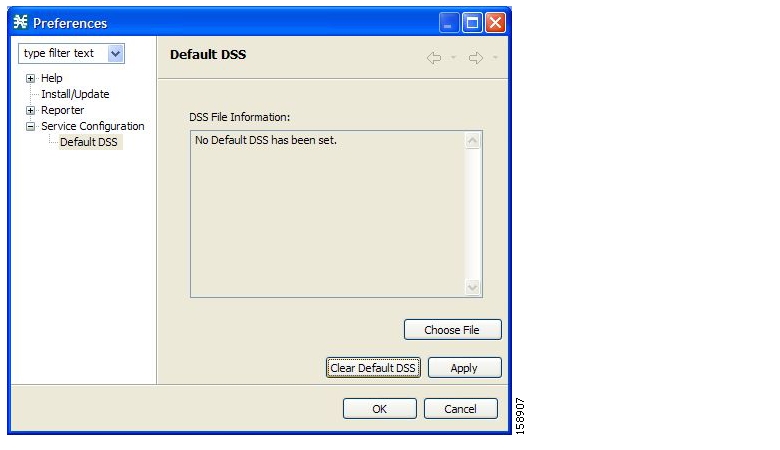
Click Choose File.
An Open dialog box appears.
From the Files of type drop-down list, select the file type of the protocol pack.
Browse to the protocol pack.
Click Open.
The Open dialog box closes.
Information about the default DSS file is displayed in the Default DSS area of the Preferences dialog box.
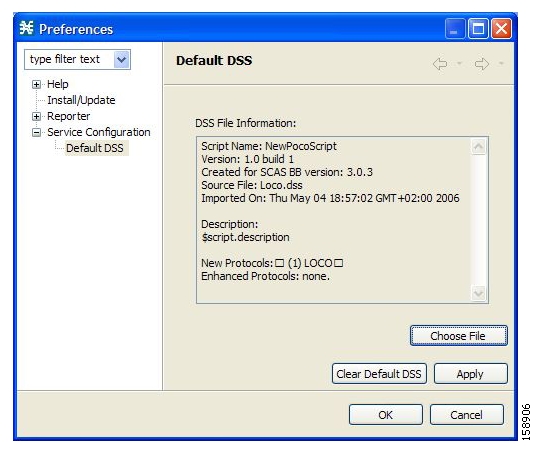
Click OK.
The DSS file is copied to
C:\Documents and Settings\<user name>\.p-cube\default3.0.5.dssas the default DSS file.The Preferences dialog box closes.
To clear the default DSS file:
From the Console main menu, choose Window > Preferences.
The Preferences dialog box appears.
From the menu tree in the left pane of the dialog box, choose Service Configuration > Default DSS.
The Default DSS area opens in the right pane of the dialog box.
Click Clear Default DSS.
The default DSS file,
C:\Documents and Settings\<user name>\.p-cube\default3.0.5.dssis deleted.All information is deleted from the Default DSS area.
NoteDeleting the default DSS file does not remove the imported dynamic signatures from the current service configuration.Click OK.
The Preferences dialog box closes.
If a default DSS file is installed, the application offers to import the dynamic signatures from the file when you create a new service configuration or when you open an existing service configuration that has not imported the signatures. Alternatively, you can manually import the dynamic signatures.
To import the default DSS file automatically:
Open an existing service configuration or create a new one.
A Default Signature message appears.
Do one of the following:
Click Yes to import the default DSS file.
Click No to continue without importing the default DSS file.
To import the default DSS file manually:
From the Console main menu, choose Configuration > Signatures Settings.
The Signatures Settings dialog box appears, with the Import Default DSS button enabled.
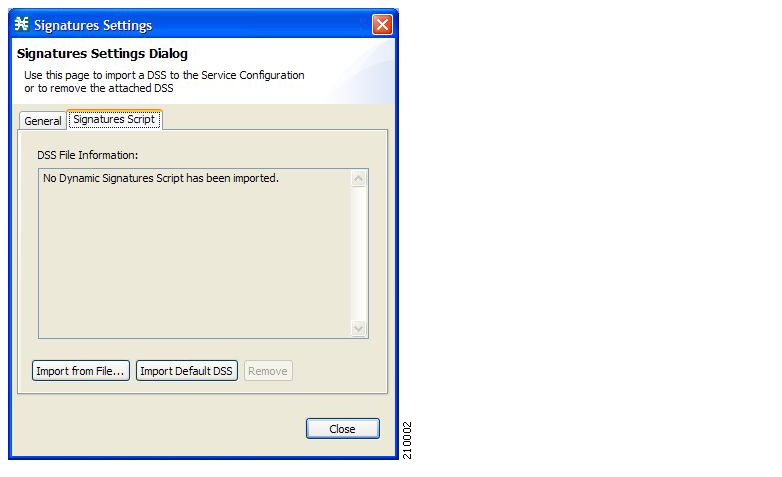
Click Import Default DSS.
An Import Warning message appears.
Click Yes.
The signatures in the default DSS file are imported into the service configuration.
The Import Default DSS button is dimmed.
Information about the imported signatures and the default DSS file is displayed in the Signatures Settings dialog box.
Click Close.
The Signatures Settings dialog box closes.
Flavors are advanced classification elements that are used to classify network sessions.
Flavors are based on specific Layer 7 properties. For instance, users can associate an HTTP flow with a service based on different parts of the destination URL of the flow.
Flavors are supported only for small number of protocols, and for each such protocol there are different applicable flavor types. Flavor types are listed in the table in the following section.
There is a maximum number of flavor items for each flavor type (see Maximum Number of Flavor Items per Flavor Type). For each flavor type, every flavor item must be unique.
The following table lists available flavor types.
Table 7.1. SCA BB Flavors
|
Flavor Type |
Valid Values |
|---|---|
|
HTTP User Agent |
Prefix string |
|
HTTP URL |
<host suffix, path prefix, path suffix, URL parameters prefix>
|
|
HTTP Composite |
<HTTP User Agent flavor, HTTP URL flavor> |
|
HTTP Content Category |
Value selected from Select a Content Category dialog box |
|
RTSP User Agent |
Prefix string |
|
RTSP Host Name |
Host suffix |
|
RTSP Composite |
<RTSP User Agent flavor, RTSP Host Name flavor> |
|
SIP Source Domain |
Host suffix |
|
SIP Destination Domain |
Host suffix |
|
SIP Composite |
<SIP source domain, SIP destination domain> |
|
SMTP Host Name |
Host suffix |
Note
Composite Flavors are pairs of two defined flavors.
You can view a list of all flavors and their associated flavor items.
To view a list of all flavors:
From the Console main menu, choose Configuration > Flavors.
The Flavor Settings dialog box appears.

The left area displays a tree showing all flavors of each flavor type.
Click a flavor in the tree to display its flavor items.
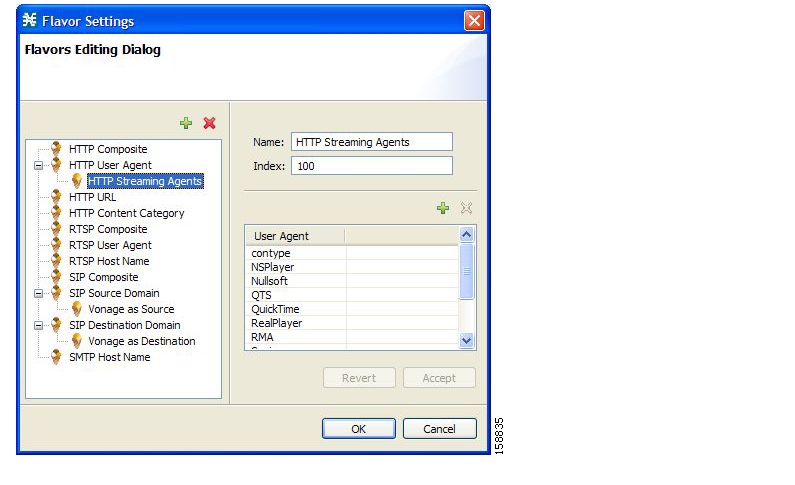
The flavor items are displayed in the right area.
Click OK.
The Flavor Settings dialog box closes.
You can add any number of flavors to a service configuration.
To add a flavor:
From the Console main menu, choose Configuration > Flavors.
The Flavor Settings dialog box appears.
In the flavor tree, select a flavor type.
Click
.A new flavor of the selected type is added to the flavor tree.
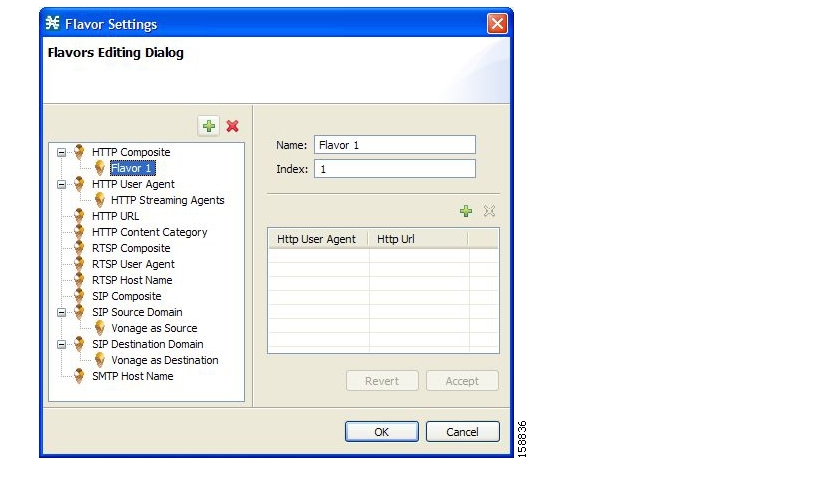
In the Name field, enter a name for the new flavor.
NoteYou can use the default name for the flavor. It is recommended that you enter a meaningful name.(Optional) In the Index field, enter a unique integer value.
NoteSCA BB provides a value for the Index. There is no need to change it.The flavor index must be a positive integer in the range 1 to 32767.
You have defined the flavor. You can now add flavor items. (See Adding Flavor Items.)
You can modify flavor parameters at any time.
To add, modify, or delete flavor items, see Managing Flavor Items.
To edit a flavor:
From the Console main menu, choose Configuration > Flavors.
The Flavor Settings dialog box appears.
In the flavor tree, select a flavor.
The name and index of the flavor (and its flavor items) are displayed in the right area.
Modify fields in the dialog box:
In the Name field, enter a new name for the flavor.
In the Index field, enter a new, unique index for the flavor.
The flavor index must be a positive integer in the range 1 to 32767.
Click OK.
The Flavor Settings dialog box closes.
You can delete any or all flavors.
To delete a flavor:
From the Console main menu, choose Configuration > Flavors.
The Flavor Settings dialog box appears.
In the flavor tree, right-click a flavor.
A popup menu appears.
Click
(Delete).A Confirm Delete message appears.
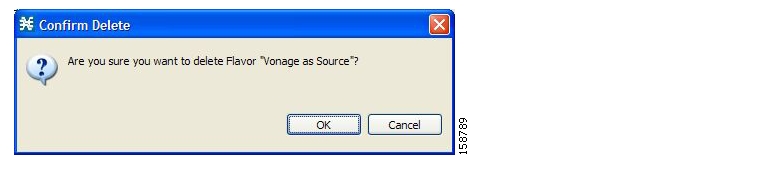
Click OK.
If any service element references the selected flavor, a Confirm References Delete message appears.
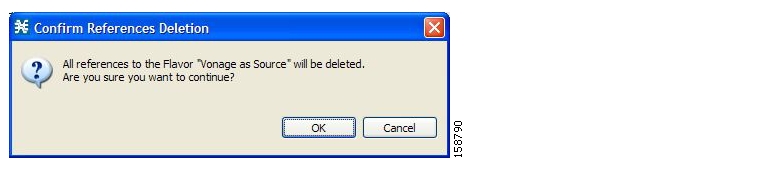
Click Yes.
Every service element that references the selected flavor is deleted.
The flavor is deleted and is no longer displayed in the flavor tree.
Click Close.
The Flavor Settings dialog box closes.
A flavor is a collection of related flavor items.
A flavor item is a value of a property or properties of a flow. These properties depend on the flavor type (see Flavor Types and Parameters).
There is a maximum number of flavor items for each flavor type (see the following section). For each flavor type, every flavor item must be unique.
The following table lists the maximum number of flavor items for each flavor type.
Table 7.2. Maximum Number of Flavor Items per Flavor Types
|
Flavor Type |
Maximum No. of Flavor Items |
|---|---|
|
HTTP Composite |
10,000 |
|
HTTP User Agent |
128 |
|
HTTP URL |
100,000 |
|
HTTP Content Category |
— |
|
RTSP Composite |
10,000 |
|
RTSP User Agent |
128 |
|
RTSP Host Name |
10,000 |
|
SIP Composite |
10,000 |
|
SIP Source Domain |
128 |
|
SIP Destination Domain |
128 |
|
SMTP Host Name |
10,000 |
You can add any number of flavor items to a flavor (subject to the limitation of the total number of each type of flavor item per service configuration, as listed in the previous section).
To add flavor items to a flavor:
From the Console main menu, choose Configuration > Flavors.
The Flavor Settings dialog box appears.
In the flavor tree, click a flavor.
Above the flavor item list, click
(Create New Flavor Item).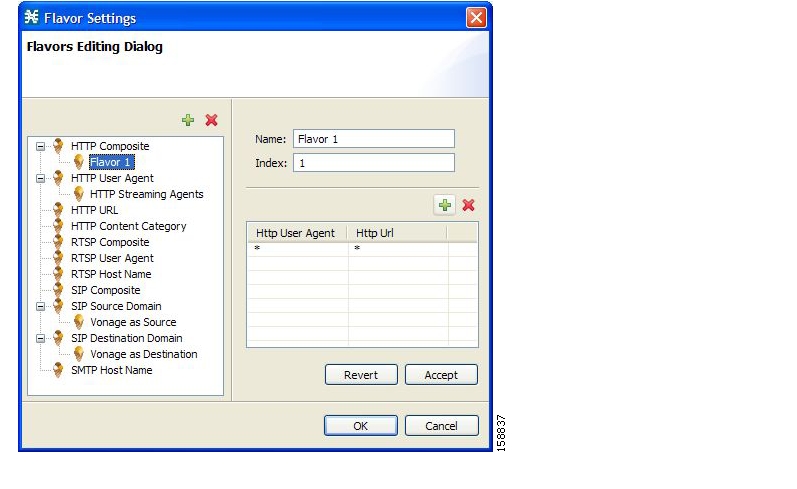
A new flavor item is added to the flavor item list. The number and type of parameters in the flavor item depend on the flavor type (see Flavor Types and Parameters).
The new flavor item has a default value of all wild cards (*, asterisks).
For each cell of the new flavor item, click the asterisk and then enter an appropriate value.
For the composite flavors, and for HTTP Content Category flavor, a Browse button is displayed when you click the asterisk.
Click the Browse button.
A Select dialog box appears, displaying all valid values for the parameter.
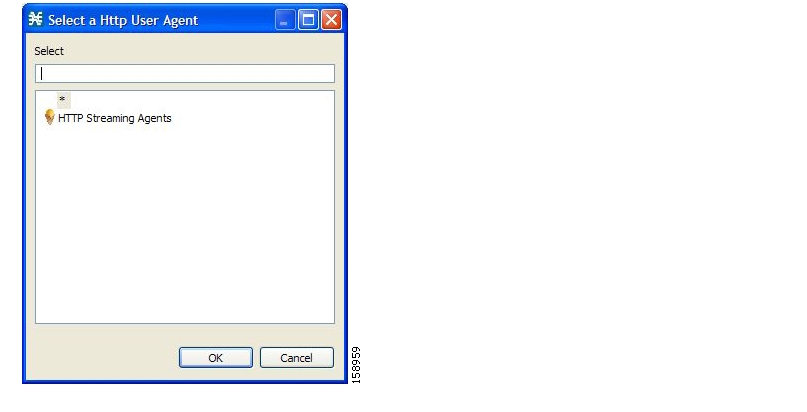
Select an appropriate value from the list.
Click OK.
The Select dialog box closes.
The selected value is displayed in the cell.
Repeat steps 3 to 5 for other flavor items.
Click OK.
The Flavor Settings dialog box closes.
To edit a flavor item:
From the Console main menu, choose Configuration > Flavors.
The Flavor Settings dialog box appears.
In the flavor tree, select a flavor.
In the flavor item list, select a flavor item.
For each cell of the flavor item, enter an appropriate new value.
For the composite flavors, and for HTTP Content Category flavor:
Click in a cell.
A Browse button is displayed.
Click the Browse button.
A Select dialog box appears, displaying all valid values for the parameter.
Select an appropriate value from the list.
Click OK.
The Select dialog box closes.
The selected value is displayed in the cell.
Click OK.
The Flavor Settings dialog box closes.
To delete a flavor item:
From the Console main menu, choose Configuration > Flavors.
The Flavor Settings dialog box appears.
In the flavor tree, select a flavor.
In the flavor item list, right-click anywhere in a flavor item.
A popup menu appears.
Click
(Delete).The flavor item is deleted and is no longer displayed in the flavor item list.
Click Close.
The Flavor Settings dialog box closes.
Content filtering involves classification and control of HTTP flows according to the requested URL. The classification of the URL is performed by accessing an external database.
SCA BB provides content filtering by integrating with a SurfControl Content Portal Authority (CPA) server.
The Cisco HTTP Content Filtering solution consists of:
The SCE application—The Cisco service control application that runs on the SCE platform. It forwards HTTP URLs that it extracts from traffic to the CPA client and uses the categorization results to classify the original HTTP flow to a service. This classification is then used for the normal SCA BB traffic control and reporting.
Cisco CPA Client—The CPA client runs on the SCE platform. It sends URL queries to the CPA server for categorization, and updates SCA BB with categorization results.
SurfControl CPA Server—The CPA server runs on a dedicated machine. It receives categorization requests from the CPA client, connects to the SurfControl Content Database, and responds with the category ID of the queried URL.
The SCE application classifies the HTTP flow according to the category returned by the CPA server. This classification is then used for SCA BB traffic control and reporting. For example, users can define a rule to block browsing of the “Adult/Sexually Explicit” category or to generate reports on the volume consumed by browsing the “Kids” or “Shopping” categories.
The SurfControl CPA Server is installed on a separate server that must be accessible from the SCE platform.
The details of the installation are not within the scope of this document.
The Cisco CPA client runs on the SCE platform. It is installed as part of the SCA BB application (PQI) installation. Use the SCE platform Command-Line Interface (CLI) to configure and monitor the client.
You can configure content filtering using SurfControl CPA and monitored using the SCE platform Command-Line Interface (CLI). For more information about the SCE platform CLI, see the Cisco Service Control Engine (SCE) CLI Command Reference.
The commands listed here are explained in the following section.
Use the following CLI commands to configure the Cisco CPA client:
[no] cpa-client
cpa-client destination <address> [port <port>]
cpa-client retries <number_of_retries>
These commands are line interface configuration commands. To run these commands you must enter line interface configuration mode and see the SCE(config if)# prompt displayed.
To enter line interface configuration mode:
At the SCE platform CLI prompt (
SCE#), typeconfigure.Press Enter.
The
SCE(config)#prompt appears.Type
interface linecard 0.Press Enter.
The
SCE(config if)#prompt appears.
Use the following CLI command in EXEC mode to monitor the status of the Cisco CPA client:
show interface linecard<slot> cpa-client
The following table gives a description of the Cisco CPA client CLI commands listed in the previous section and their default values.
Table 7.3. CPA Client CLI Commands
|
Command |
Description |
Default Value |
|---|---|---|
|
[no] cpa-client |
Enables or disables the CPA client |
Disabled |
|
cpa-client destination <address> [port <port>] |
Enables the CPA client and sets the CPA server IP address and port |
|
|
cpa-client retries <number_of_retries> |
Sets the number of retries to send to the CPA server |
3 |
|
show interface linecard <slot> cpa-client |
Monitors the CPA client status (See the following table) |
— |
The following table displays the information shown when monitoring the Cisco CPA client.
Table 7.4. CPA Client: Monitored Parameters
|
Parameter |
Description |
|---|---|
|
Mode |
Enabled or disabled |
|
CPA Address |
|
|
CPA Port |
|
|
CPA Retries |
|
|
Status |
(If enabled) Active or error (and last error description) |
|
Counters |
|
|
Timestamps |
|
The SCE application communicates with the CPA client using Raw Data Records (RDRs). To enable the RDR formatter to issue HTTP categorization requests, configure the RDR formatter on the SCE platform using the SCE platform CLI:
#>RDR-formatter destination 127.0.0.1 port 33001 category number 4 priority 100
For more information about configuring the RDR formatter, see the “Configuring the RDR Formatter” chapter of the Cisco Service Control Engine (SCE) Software Configuration Guide.
Applying HTTP URL content filtering requires the following steps in the Service Configuration Editor:
Import the content filtering configuration file into your service configuration.
By default, SCA BB creates a separate flavor (of type HTTP Content Category) for each content category and a service element for each new flavor. A new top-level service, “HTTP Browsing with Categories”, is created, comprising these service elements.
Create new services and map the new category flavors to them.
Add content filtering rules to existing packages or create new packages that include content filtering rules.
Enable content filtering for selected packages.
Apply the service configuration.
Before you can control HTTP flows based on content, you must import an XML file provided with the installation.
After you unzip the installation package, this file is located in the URL Filtering subfolder.
You can import content filtering categories using either the File > Import menu option or the Configuration > Content Filtering menu option.
To import content filtering categories using the Import dialog box:
From the Console main menu, choose File > Import.
The Import dialog box appears.
From the import source list, select Import content filtering database settings from XML file.
Click Next.
The Import Content Filtering Database Settings dialog box appears.
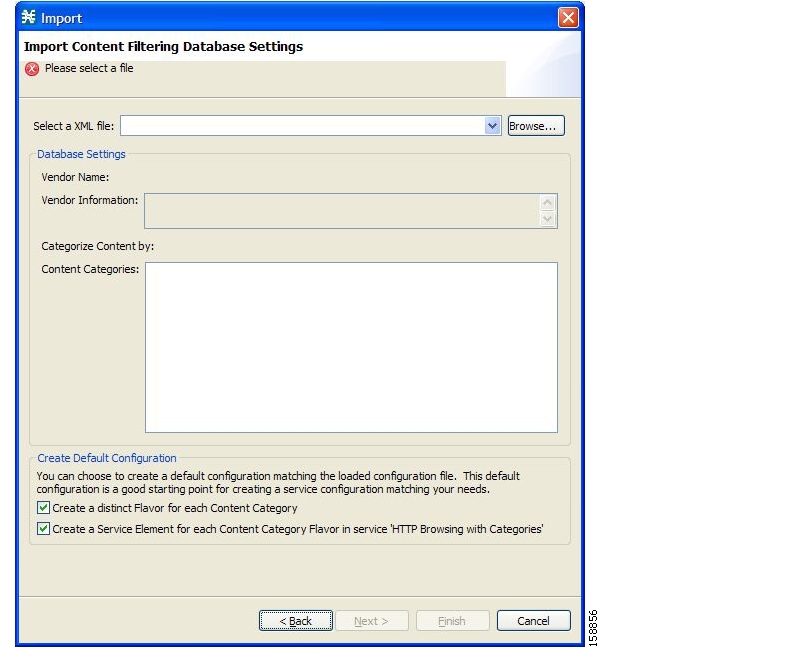
Click the Browse button next to the Select a XML file field.
An Open dialog box appears.
Browse to the folder containing the file to import, and select it.
NoteFor SurfControl’s CPA, the file is namedsurfcontrol.xml.Click Open to select the file.
The Open dialog box closes.
Information about the content of the XML file is displayed in the Database Settings pane of the Import Content Filtering Database Settings dialog box.
By default, SCA BB creates a separate flavor (of type HTTP Content Category) for each content category when importing the XML file.
To disable this option, uncheck the Create a distinct Flavor for each Content Category check box.
NoteIt is recommended that you do not disable this option.
By default, SCA BB creates a service element for each flavor created in the previous step. A new top-level service, HTTP Browsing with Categories, is created, comprising these service elements.
To disable this option, uncheck the Create a Service Element for each Content Category Flavor in Service ‘HTTP Browsing with Categories’ check box.
NoteIt is recommended that you do not disable this option.
Click Finish.
The Import Content Filtering Database Settings dialog box closes.
To import content filtering categories using the HTTP Content Filtering Settings dialog box:
- NoteThis is equivalent to the previous procedure.
From the Console main menu, choose Configuration > Content Filtering.
The HTTP Content Filtering Settings dialog box appears.
Click the Database Settings tab.
The Database Settings tab opens.
Click Import.
The Import Content Filtering Database Settings dialog box appears.
Perform steps 4 to 8 of the preceding procedure.
Click Finish.
The Import Content Filtering Database Settings dialog box closes.
Information from the imported file is displayed in the Database Settings tab of the HTTP Content Filtering Settings dialog box.
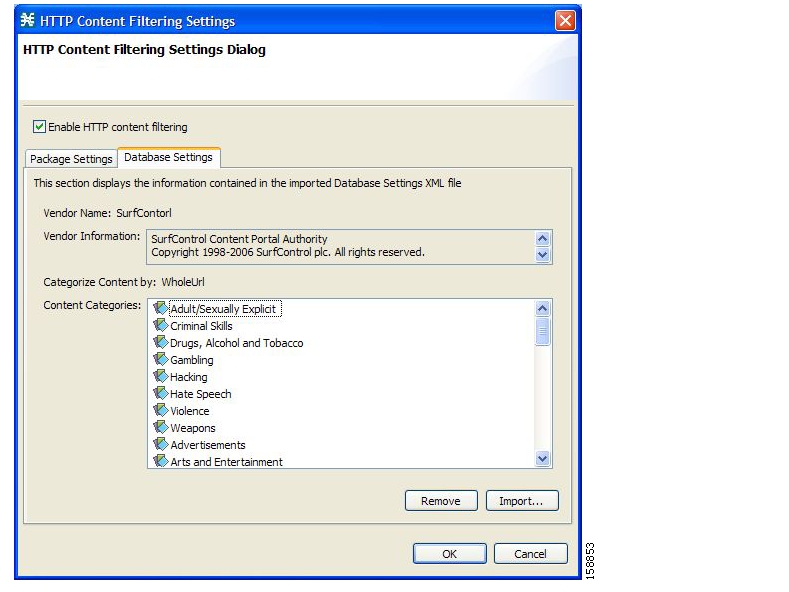
Click OK.
The HTTP Content Filtering Settings dialog box closes.
By default, SCA BB creates a separate flavor (of type HTTP Content Category) for each content category when importing the XML file.
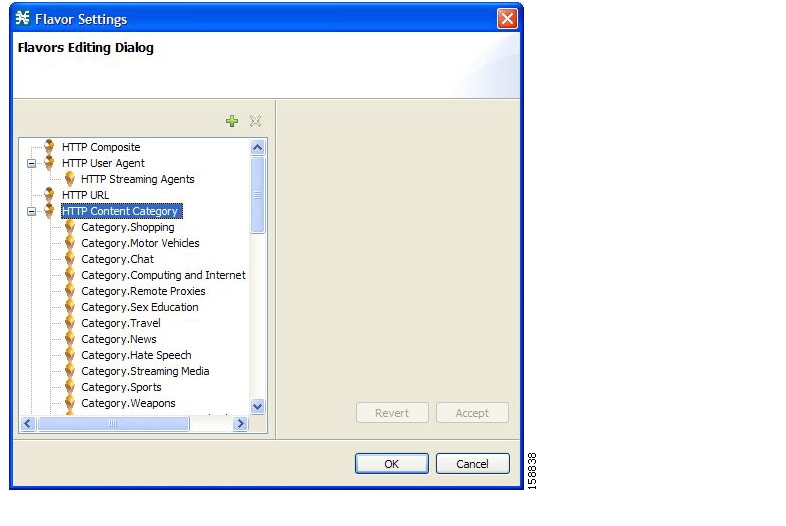
You can create additional HTTP Content Category Flavors that include two or more content categories. (See Adding Flavors.)
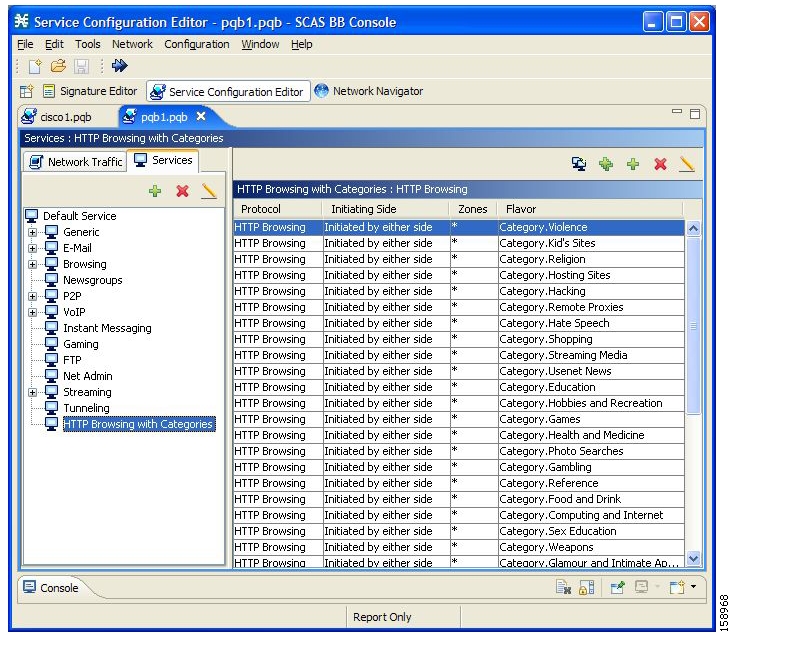
You can specify the packages where content filtering will be enabled. For packages where content filtering is disabled, HTTP flows will be classified normally.
To configure content filtering:
From the Console main menu, choose Configuration > Content Filtering.
The HTTP Content Filtering Settings dialog box appears.
The Package Settings tab displays a list of all packages defined for the current service configuration.
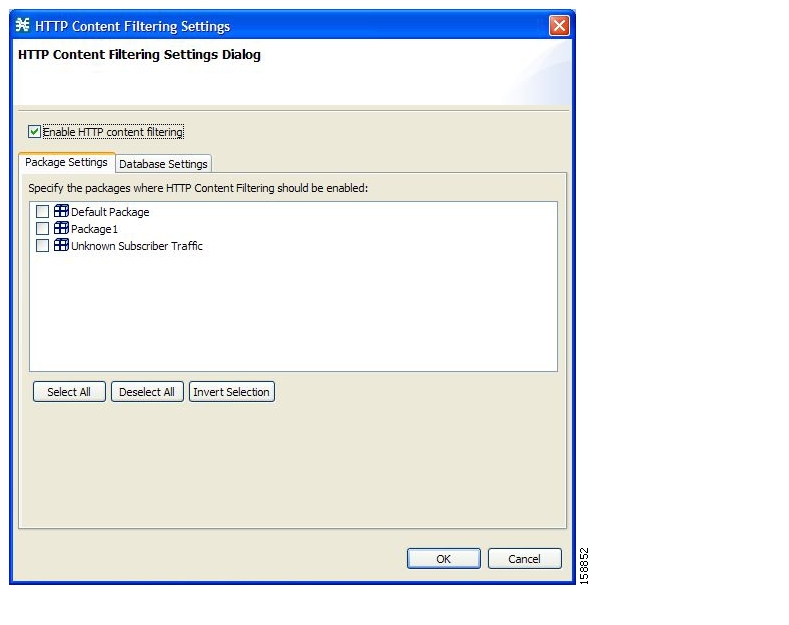
Check the Enable HTTP content filtering check box.
Check the check box next to each package for which content filtering is to be applied.
Click OK.
The HTTP Content Filtering Settings dialog box closes.
You can view whether content filtering is enabled and to which packages content filtering is applied, and information about the content filtering vendor and the vendor’s content categories.
To view content filtering settings:
From the Console main menu, choose Configuration > Content Filtering.
The HTTP Content Filtering Settings dialog box appears.
The Package Settings tab displays a list of all packages defined for the current service configuration, and shows for which packages content filtering is enabled.
Click the Database Settings tab.
The Database Settings tab opens.
This tab displays information about the content filtering vendor and the vendor’s content categories.
Click OK.
The HTTP Content Filtering Settings dialog box closes.
You can remove all content filtering settings at any time.
Removing the settings:
Removes content category flavor items from flavors
Deletes all the content category flavor items
Disables content filtering
To remove all content filtering settings:
From the Console main menu, choose Configuration > Content Filtering.
The HTTP Content Filtering Settings dialog box appears.
Click the Database Settings tab.
The Database Settings tab opens.
Click Remove.
A Confirm Content Filtering Settings Removal dialog box appears.
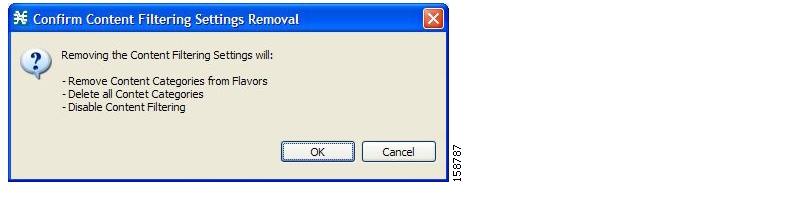
Click OK.
All content filtering settings are removed.
Vendor Name, Vendor Information, and Content Categories are deleted from the HTTP Content Filtering Settings dialog box.
Click OK.
The HTTP Content Filtering Settings dialog box closes.
Traffic Accounting and Reporting is the second step in creating a Cisco Service Control Application for Broadband (SCA BB) service configuration.
This chapter how explains how to work with usage counters and Raw Data Records (RDRs).
The SCA BB collects and maintains various network metrics (such as volume and number of sessions), per service. This accounting takes place per subscriber, per group of subscribers (package or group of packages), and for the entire link.
Services may share a usage counter. For example, in the default service configuration the SMTP and POP3 services share the E-Mail service usage counters. The assignment of services to usage counters is determined by the service hierarchy. Editing Services explains how to configure the service hierarchy.
Similarly, packages may share a usage counter. The assignment of packages to usage counters is determined by the package hierarchy. Setting Advanced Package Options explains how to configure the package hierarchy.
Service Control Engine (SCE) platforms generate and transmit Raw Data Records (RDRs) that contain information that is relevant to the service provider. These RDRs contain a wide variety of information and statistics, depending on the configuration of the system. For more details about the content of each type of RDR, see the “Raw Data Records: Formats and Field Contents” chapter of the Cisco Service Control Application for Broadband Reference Guide.
Note
RDRs are not generated for filtered traffic (see Filtering the Traffic Flows).
The RDR Settings dialog box allows you to control the generation of RDRs for an entire service configuration. This dialog box contains seven tabs:
Usage RDRs—Allows you to enable the generation of each type of Usage RDR, and define their generation intervals
Traffic Discovery—Allows you to enable the generation of Transaction RDRs and define their maximum rate of generation
Quota RDRs—Allows you to enable the generation of each type of Quota RDR, and define their generation parameters
Transaction Usage RDRs—Allows you to specify the packages and services for which Transaction Usage RDRs will be generated
Log RDRs—Allows you to specify the packages and services for which Log RDRs will be generated
Real-Time Subscriber RDRs—Allows you to enable the generation of Real-Time Subscriber Usage RDRs, and define their generation intervals and maximum rate of generation
Real-Time Signaling RDRs—Allows you to specify the packages and services for which Real-Time Signaling RDRs will be generated
NoteMedia Flow RDRs and Malicious Traffic Periodic RDRs are enabled and configured in the Advanced Service Configuration Options dialog box.
Note
All RDR data is based on Layer 3 volume.
The SCE platform can generate three types of Usage RDRs. Usage RDRs of each type are generated for each service usage counter; service usage counters aggregate usage for either one service or a group of related services in the service hierarchy.
Link Usage RDRs—Contain data relating to total usage of a particular group of services for the entire link
Package Usage RDRs—Contain data relating to total usage of a particular group of services by all subscribers to a particular package
Subscriber Usage RDRs—Contain data relating to total usage of a particular group of services by a particular subscriber
You can enable or disable the generation of each type of Usage RDR, and set the generation interval for each type of Usage RDR. You can limit the generation rate of Subscriber Usage RDRs (advisable when there are a large number of subscribers).
By default, all three types of Usage RDRs are enabled. Each RDR is generated once every five minutes.
Note
Usage RDRs are not generated for blocked sessions. A session is blocked if the service that the session is mapped to is blocked for this user’s package (see Defining Per-Flow Actions for a Rule), or if the user has exceeded the allowed quota for this service (see Managing Quotas).
To configure the generation of Usage RDRs:
From the Console main menu, choose Configuration > RDR Settings.
The RDR Settings dialog box appears.
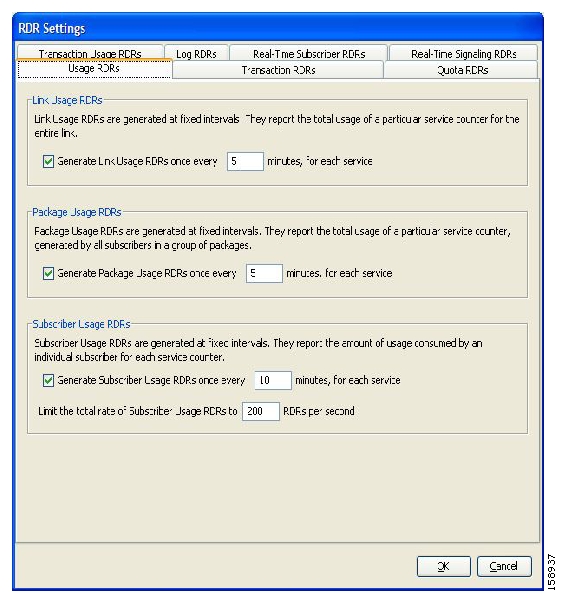
To enable the generation of a selected type of Usage RDR:
Check the appropriate Generate Usage RDRs check box.
To disable the generation of a selected type of Usage RDR:
Uncheck the appropriate Generate Usage RDRs check box.
To change the generation interval for a selected type of Usage RDR:
Enter the interval in minutes between each generation of this type of Usage RDRs in the appropriate Generate Usage RDRs field.
To limit the generation rate of Subscriber Usage RDRs:
Enter the maximum number of Subscriber Usage RDRs to be generated per second in the Limit the Total Rate of Subscriber Usage RDRs field.
To configure Transaction RDRs, continue with step 2 of the instructions in the section Managing Transaction RDRs.
Click OK.
The RDR Settings dialog box closes.
The new configuration for the generation of RDRs is saved.
The SCE platform can generate Transaction RDRs for selected service types. Each Transaction RDR contains data about a single network transaction. You can use these RDRs, for example, to generate statistical histograms that help understand the traffic that is traversing the network.
You can enable or disable the generation of Transaction RDRs, set the maximum number of RDRs generated per second, and select for which services the RDRs are generated. You can also assign a relative weight to each service. The relative weight determines the relative number of Transaction RDRs that will be generated for this service, compared to other services.
By default, at most 100 Transaction RDRs are generated per second, and all services are given the same weight.
To configure the generation of Transaction RDRs:
From the Console main menu, choose Configuration > RDR Settings.
The RDR Settings dialog box appears.
Click the Traffic Discovery tab.
The Traffic Discovery tab opens.
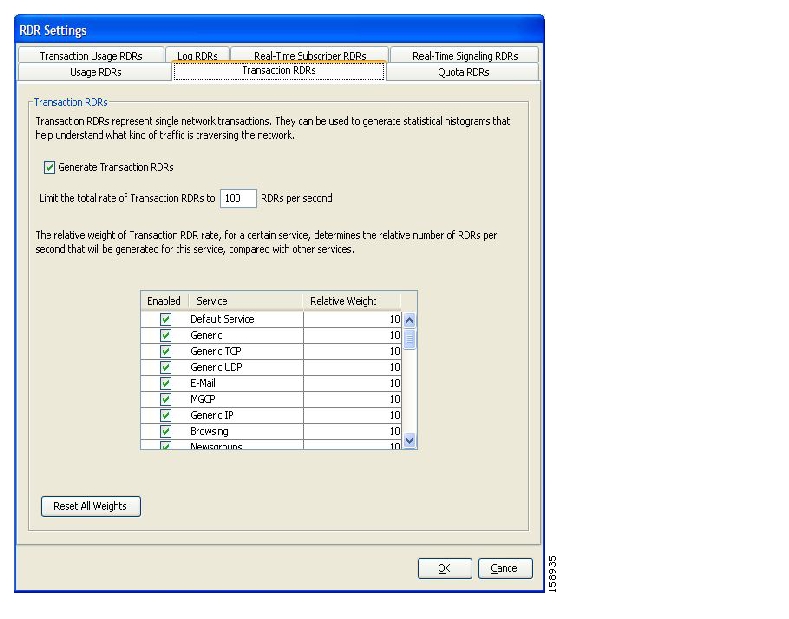
To enable the generation of Transaction RDRs:
Check the Generate Transaction RDRs check box.
To disable the generation of Transaction RDRs:
Uncheck the Generate Transaction RDRs check box.
To change the maximum generation rate for Transaction RDRs:
Enter the desired rate in the Limit the Total Rate of Transaction RDRs field.
To disable the generation of Transaction RDRs for a selected service:
Uncheck the Enabled check box next to the service name.
To set the relative weight for a selected service:
Double-click in the appropriate cell in the Relative Weight column, and enter the desired weight.
To configure Quota RDRs, continue with step 2 of the instructions in the section Managing Quota RDRs.
Click OK.
The RDR Settings dialog box closes.
The new configuration for the generation of RDRs is saved.
SCA BB generates Quota RDRs per subscriber. There are three types of Quota RDRs:
Quota Breach RDRs—When a quota bucket is depleted, services that try to consume from that bucket are regarded as breached. SCA BB can generate a Quota Breach RDR when a quota breach occurs.
When a subscriber’s service is breached, the service is handled according to its breach-handling settings. For example, you can block flows of a specific service when the quota for that service is consumed.
Remaining Quota RDRs—As quota is consumed, SCA BB can generate Remaining Quota RDRs.
The Remaining Quota RDR is only generated if a bucket state has change since the last RDR was generated.
Quota Threshold RDRs—When the remaining quota in a bucket falls below a threshold, SCA BB can generate a Quota Threshold RDR. External systems can treat this RDR as a quota request and provision the subscriber with an additional quota before the bucket is depleted.
Quota State Restore RDRs—When a subscriber logs out, their remaining quota is stored in the Cisco Service Control Management Suite (SCMS) Subscriber Manager (SM). When the subscriber logs in again, this quota is restored from the SM. SCA BB can generate a Quota State Restore RDR when the subscriber is introduced.
You can enable or disable the generation each type of Quota RDR and define the rate of generation of these RDRs.
For Remaining Quota RDRs, you can set the generation interval, and limit the generation rate (advisable when there are a large number of subscribers).
For Quota Threshold RDRs, you can configure the threshold.
By default, all Quota RDRs are disabled.
To configure the generation of Quota RDRs:
From the Console main menu, choose Configuration > RDR Settings.
The RDR Settings dialog box appears.
Click the Quota RDRs tab.
The Quota RDRs tab opens.
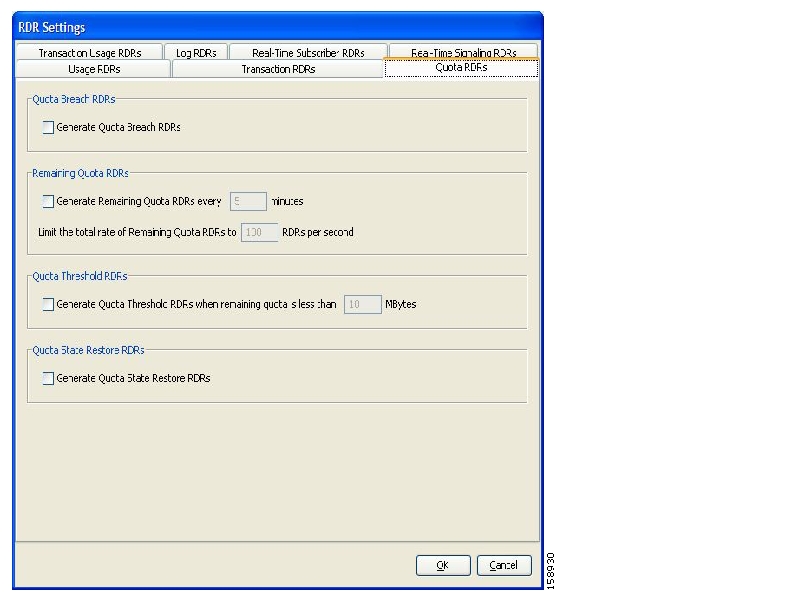
To enable the generation of Quota Breach RDRs:
Check the Generate Quota Breach RDRs check box.
To enable the generation of Remaining Quota RDRs:
Check the Generate Remaining Quota RDRs check box.
To change the generation interval of Remaining Quota RDRs:
In the Generate Remaining Quota RDRs field, enter the interval in minutes between each generation of the RDR.
To limit the maximum generation rate of Remaining Quota RDRs:
In the Limit the Total Rate of Remaining Quota RDRs field, enter the maximum number of Remaining Quota RDRs to be generated per second.
To enable the generation of Quota Threshold RDRs:
Check the Generate Quota Threshold RDRs check box.
To change the Threshold for Quota Threshold RDRs:
In the Generate Quota Threshold RDRs field, enter the threshold for which Quota Threshold RDR will be generated.
To enable the generation of Quota State Restore RDRs:
Check the Generate Quota State Restore RDRs check box.
To configure Transaction Usage RDRs, continue with step 2 of the instructions in the section Managing Transaction Usage RDRs.
Click OK.
The RDR Settings dialog box closes.
The new configuration for the generation of RDRs is saved.
The SCE platform can generate Transaction Usage RDRs for all transactions of selected packages, or for selected services per package. Each Transaction Usage RDR contains data about a single network transaction. You can use these RDRs to build detailed usage logs for specific services and subscribers, suitable, for example, for transaction-based billing.
Caution
Generating and collecting an RDR for each transaction can cause performance penalties. Enable Transaction Usage RDR generation only for those services and packages that must be monitored or controlled by the system.
You can select the packages and services for which Transaction Usage RDRs are generated. The following RDRs will also be generated for these packages and services:
HTTP Transaction Usage RDR
RTSP Transaction Usage RDR
VoIP Transaction Usage RDR
By default, no Transaction Usage RDRs are generated.
Note
Media Flow RDRs are enabled in the Advanced Service Configuration Options dialog box.
(When enabled, Media Flow RDRs are generated at the end of every SIP and Skype media flow; you can use them to distinguish between SIP voice and video calls.)
To configure the generation of Transaction Usage RDRs:
From the Console main menu, choose Configuration > RDR Settings.
The RDR Settings dialog box appears.
Click the Transaction Usage RDRs tab.
The Transaction Usage RDRs tab opens.
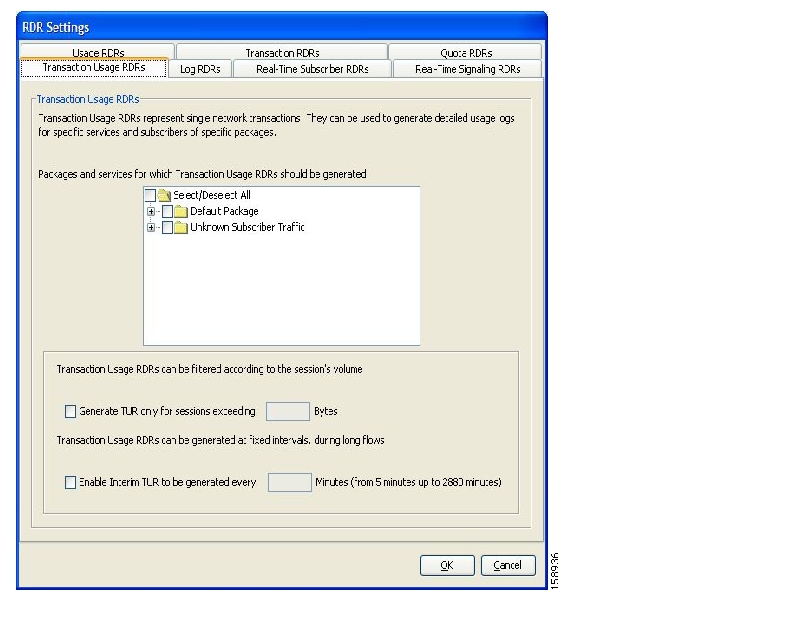
To enable the generation of Transaction Usage RDRs for selected packages:
Check the check box next to the package name in the package tree.
The package expands to show all component services of the package; all the services are checked.
To enable the generation of Transaction Usage RDRs for selected services of a package:
Expand the node of the desired package.
Check the check box next to the service name of each desired service.
To limit the generation of Transaction Usage RDRs to “large” sessions:
Check the Generate TUR only for sessions exceeding check box.
The Bytes field is enabled.
Enter the minimum session size in bytes for which a Transaction Usage RDR should be generated for the session.
Usually, a Transaction Usage RDR is only generated at when a flow closes. To enable the generation of additional, interim Transaction Usage RDRs for long flows:
Check the Enable Interim TUR to be generated every check box.
The Minutes field is enabled.
Enter the time in minutes between each generation of a Transaction Usage RDR for each flow.
To configure Log RDRs, continue with step 2 of the instructions in the section Managing Log RDRs.
Click OK.
The RDR Settings dialog box closes.
The new configuration for the generation of RDRs is saved.
Log RDRs provide information regarding system events. SCA BB generates them in response to specific actions or state changes. There are two types of Log RDRs:
Blocking RDRs—SCA BB can generate a Blocking RDR each time a transaction is blocked
Breach RDRs—SCA BB generates a Breach RDR each time a bucket exceeds the global threshold
You can set the maximum number of Log RDRs generated per second, and select the packages and services for which Blocking RDRs are generated.
By default, Blocking RDRs are generated for all packages. Breach RDRs are always generated.
Note
At most 20 Log RDRs are generated per second.
To configure the generation of Log RDRs:
From the Console main menu, choose Configuration > RDR Settings.
The RDR Settings dialog box appears.
Click the Log RDRs tab.
The Log RDRs tab opens.
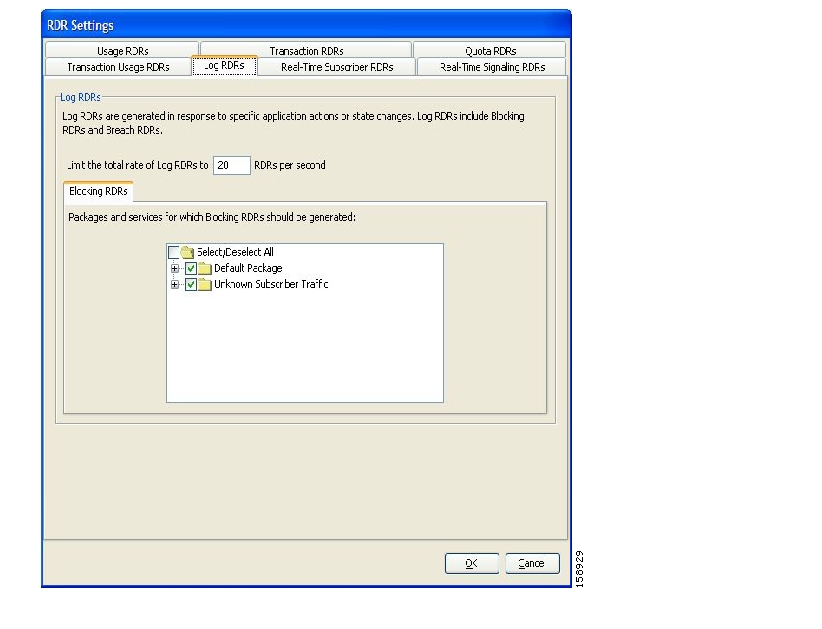
To change the maximum generation rate for Log RDRs:
Enter the desired rate in the Limit the Total Rate of Log RDRs field.
To enable the generation of Blocking RDRs for selected packages:
Check the check box next to the package name in the package tree.
The package expands to show all component services of the package; all the services are checked.
To enable the generation of Blocking RDRs for selected services of a package:
Expand the node of the desired package.
Check the check box next to the service name of each desired service.
To configure Real-Time Subscriber Usage RDRs, continue with step 2 of the instructions in the section Managing Real-Time Subscriber Usage RDRs.
Click OK.
The RDR Settings dialog box closes.
The new configuration for the generation of RDRs is saved.
Real-Time Subscriber Usage RDRs are RDRs that report subscriber usage. These RDRs are generated for each individual subscriber for each service used, at specified intervals. These RDRs permit a more granular monitoring of selected subscribers when necessary.
See Selecting Subscribers for Real-Time Usage Monitoring for more information on selecting subscribers to be monitored.
Caution
Generating and collecting Real-Time Subscriber Usage RDRs for many subscribers can cause performance penalties. Enable Real-Time Subscriber Usage RDR generation only for those subscribers that must actually be monitored by the system.
You can enable or disable the generation of Real-Time Subscriber Usage RDRs, set the generation interval for the RDRs, and set the maximum number of RDRs generated per second.
By default, Real-Time Subscriber Usage RDRs are generated (but only for selected subscribers). An RDR for each subscriber is generated once every minute. At most 100 RDRs are generated per second.
To configure the generation of Real-Time Subscriber Usage RDRs:
From the Console main menu, choose Configuration > RDR Settings.
The RDR Settings dialog box appears.
Click the Real-Time Subscriber RDRs tab.
The Real-Time Subscriber RDRs tab opens.
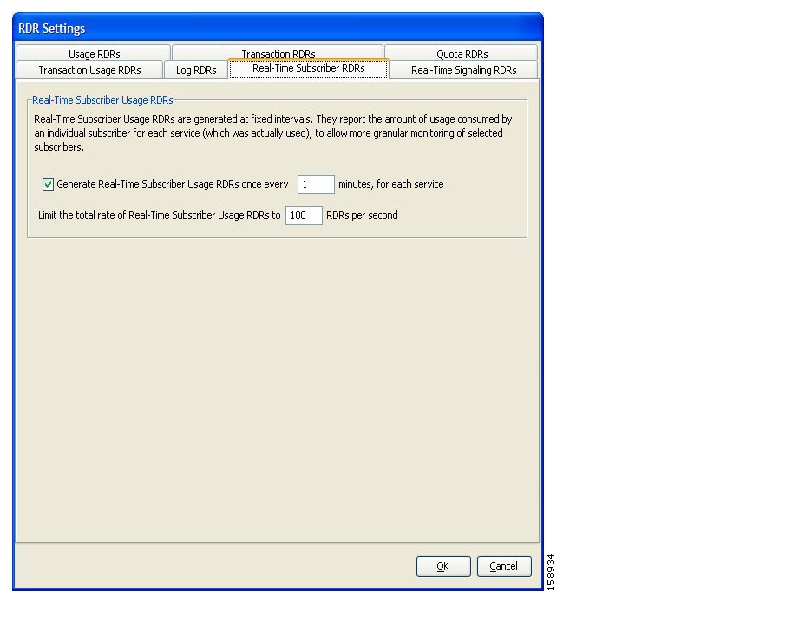
To enable the generation of Real-Time Subscriber Usage RDRs:
Check the Generate Real-Time Subscriber Usage RDRs check box.
To change the generation interval for Real-Time Subscriber Usage RDRs:
Enter the desired interval in minutes between each generation of the RDRs in the Generate Real-Time Subscriber Usage RDRs field.
To limit the generation rate of Real-Time Subscriber Usage RDRs:
Enter the maximum number of Real-Time Subscriber Usage RDRs to be generated per second in the Limit the total rate of Real-Time Subscriber Usage RDRs field.
To configure Real-Time Signaling RDRs, continue with step 2 of the instructions in the section Managing Real-Time Signaling RDRs.
Click OK.
The RDR Settings dialog box closes.
The new configuration for the generation of RDRs is saved.
SCA BB can generate Real-Time Signaling RDRs at the beginning and end of a flow, at specified intervals after the beginning of the flow, and at the beginning and end of a network attack.
You can use these RDRs to signal external systems concerning events detected by the SCE platform, allowing real-time actions to be taken across the network.
There are two groups of Real-Time Signaling RDRs:
Flow Signaling RDRs:
Flow Start Signaling RDRs
Flow Stop Signaling RDRs
Flow Interim Signaling RDRs
Attack Signaling RDRs:
Attack Start Signaling RDRs
Attack Stop Signaling RDRs
You can enable or disable the generation of Flow Signaling RDRs for selected packages, or for selected services per package, and set the generation interval for Flow Interim Signaling RDRs. Flow Interim Signaling RDRs can only be generated if Flow Start and Flow Stop Signaling RDRs are enabled.
You can enable or disable the generation of Attack Signaling RDRs for selected packages.
Note
Malicious Traffic Periodic RDRs are enabled and configured in the Advanced Service Configuration Options dialog box.
By default, no Real-Time Signaling RDRs are generated.
To configure the generation of Real-Time Signaling RDRs:
From the Console main menu, choose Configuration > RDR Settings.
The RDR Settings dialog box appears.
Click the Real-Time Signaling RDRs tab.
The Real-Time Signaling RDRs tab opens.
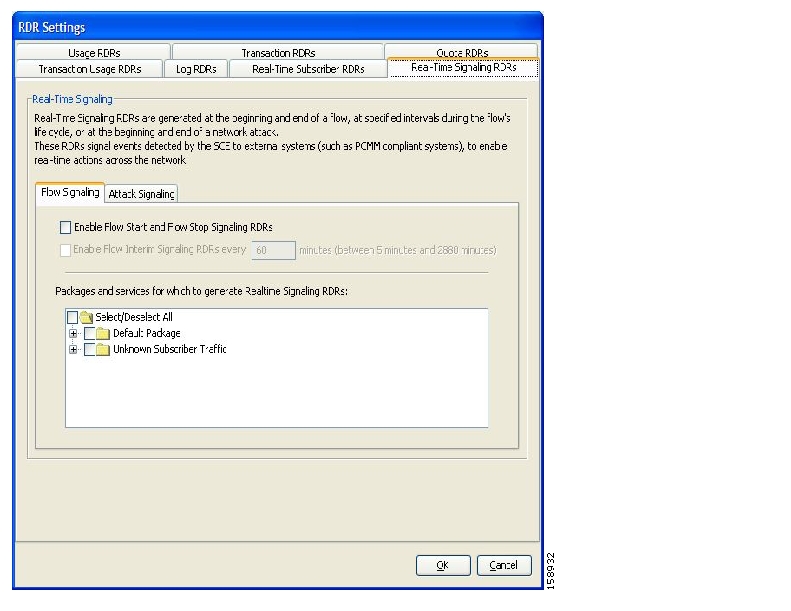
To enable the generation of Flow Start and Flow Stop Signaling RDRs:
Check the Enable Flow Start and Flow Stop Signaling RDRs check box.
The Enable Flow Interim Signaling RDRs check box is enabled.
To enable the generation of Flow Interim Signaling RDRs:
Check the Enable Flow Interim Signaling RDRs check box.
The Enable Flow Interim Signaling RDRs field is enabled.
To change the generation interval for Flow Interim Signaling RDRs:
Enter the interval in minutes between each generation of the RDRs in the Enable Flow Interim Signaling RDRs field.
To enable the generation of Flow Interim Signaling RDRs for selected packages:
Check the check box next to the package name in the package tree.
The package expands to show all component services of the package; all the services are checked.
To enable the generation of Flow Interim Signaling RDRs for selected services of a package:
Expand the node of the desired package.
Check the check box next to the service name of each desired service.
To enable the generation of Attack Signaling RDRs:
In the body of the Real-Time Signaling RDRs tab, click the Attack Signaling tab.

Check the Enable Attack Start and Attack Stop Signaling RDRs check box
To enable the generation of Attack Signaling RDRs for selected packages:
Check the check box next to the package name in the package list.
Click OK.
The RDR Settings dialog box closes.
The new configuration for the generation of RDRs is saved.
The Traffic Control capabilities of the Service Control Engine (SCE) platform and the Cisco Service Control Application for Broadband (SCA BB) are used to limit and prioritize traffic flows. Control of traffic is based on parameters such as the service of the flow, the subscriber’s package, and the subscriber’s quota state.
A package is a description of subscriber policy. It is a collection of rules that defines the system’s reaction when it encounters flows that are mapped to the service to which the rule is related. It is recommended that you first define services (see Managing Services) and only then add and define packages.
Every SCA BB service configuration contains a package, the default package, which is the root package and cannot be deleted.
A subscriber is mapped to the default package if no other package is specifically assigned to the subscriber, or if a nonexistent package is assigned to the subscriber.
A service configuration can contain up to 5000 packages.
A package is defined by the following parameters:
General parameters:
Package Name—A unique name for the package
Description—(Optional) A description of the package
Quota Management parameters:
Quota Management Mode—Specifies whether subscriber quotas are managed by an external quota manager or replenished periodically by SCA BB.
Aggregation Period Type—The quota aggregation period used when quotas are replenished periodically.
Quota Buckets—16 resource buckets used for quota management.
Subscriber BW Controllers parameters:
Subscriber relative priority—The relative priority given to subscribers of the package at times of network congestion. Separate priorities are defined for upstream and downstream flows.
Subscriber Bandwidth Controllers—A list of BW controllers (BWCs) that are available to services that are part of the package. Various parameters are defined for each BWC, including a mapping to a global controller. Separate BWCs are defined for upstream and downstream flows.
Advanced parameters:
Package Index—The unique number by which the system recognizes a packages. (Changing the package name does not affect SCE platform activity.) A default value of the package index is provided by the system. Do not modify this value.
Parent Package—The package one level higher in the package hierarchy. The parent package is important when packages share usage counters. The default package is the base of the package hierarchy, and does not have a parent.
Package Usage Counter—Used by the system to generate data about the total use by each package. A package can use either an exclusive package usage counter or the package usage counter of the parent package.
Each usage counter has:
A name assigned by the system (based on the package name).
NoteAn asterisk is appended to a package counter name whenever the counter applies to more than one package.A unique counter index—A default value of the counter index is provided by the system. Do not modify this value.
Calendar—The calendar that is used as the basis for the time-based rules of the package.
VAS Traffic Forwarding Table—The forwarding table used by the package.
These parameters are defined when you add a new package (see Adding Packages). You can modify them at any time (see Editing Packages).
You can view a hierarchy tree of all existing packages, and you can see a list of services for which specific rules are defined for any selected package.
To view all packages:
In the current service configuration, click the Network Traffic tab.
The Network Traffic tab appears.
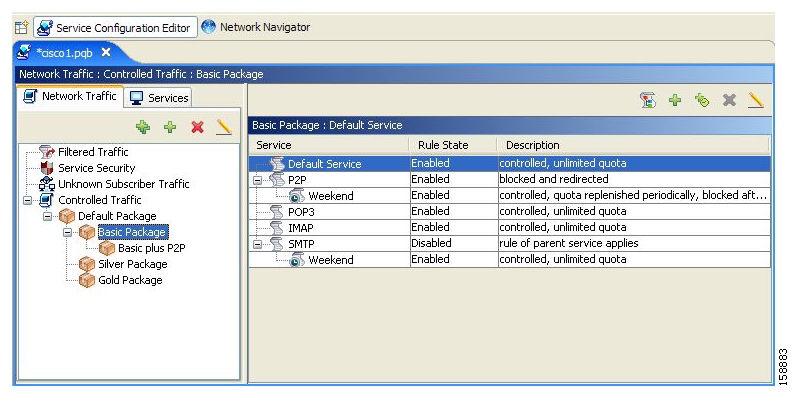
A list of all packages is displayed in the package tree.
NoteTo view more information about a package, open the Package Settings dialog box (see Editing Packages).Click a package in the hierarchy to display the rules of the package.
A list of all rules of this package is displayed in the right (Rule) pane.
A default package is predefined in the Console installation. You can add additional packages to a service configuration, subject to the limit of 5000 packages per service configuration.
After you have added a new package, you can define rules for the package (see Adding Rules to a Package).
To add a package to a service configuration:
In the Network Traffic tab, select a package from the package tree. This package will be the parent of the package you are adding.
In the Network Traffic tab, click
(Add Package).The Package Settings dialog box appears.
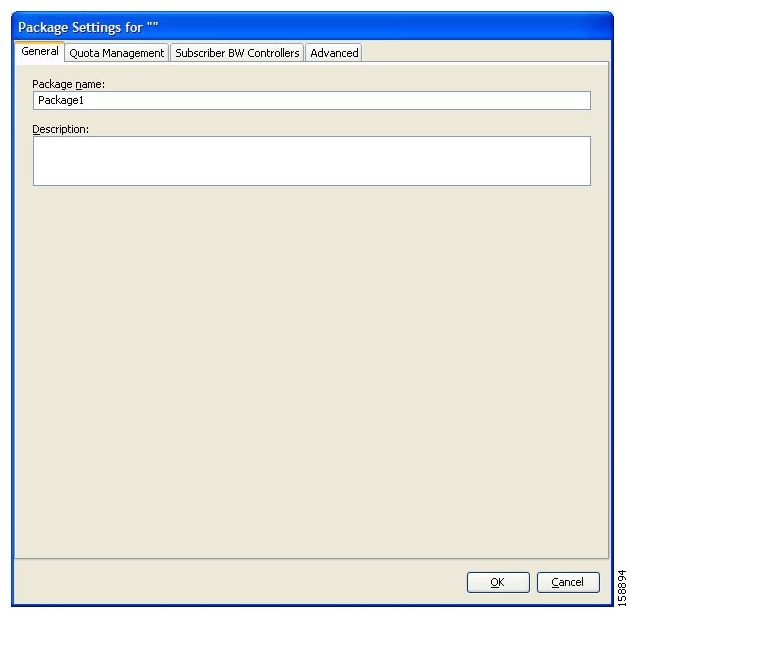
In the Package name field, enter a unique and relevant name for the package.
(Optional) In the Description field, enter a meaningful and useful description of the package.
To configure parameters in the Advanced tab, continue with the instructions in the following section.
Click OK.
The Package Settings dialog box closes.
The new package is added as a child to the package selected in the package tree and becomes the selected package. The default service rule is displayed in the right (Rule) pane.
To edit the default service rule, and to add new rules to the package, see Managing Rules.
To configure parameters in the Quota Management tab see Editing Package Quota Management Settings.
To configure parameters in the Subscriber BW Controllers tab, see Editing Package Subscriber BWCs.
You can change the index for the package, specify an exclusive usage counter, or select a calendar for the package in the Advanced tab.
To set the package advanced options:
In the Package Settings dialog box, click the Advanced tab.
The Advanced tab opens.
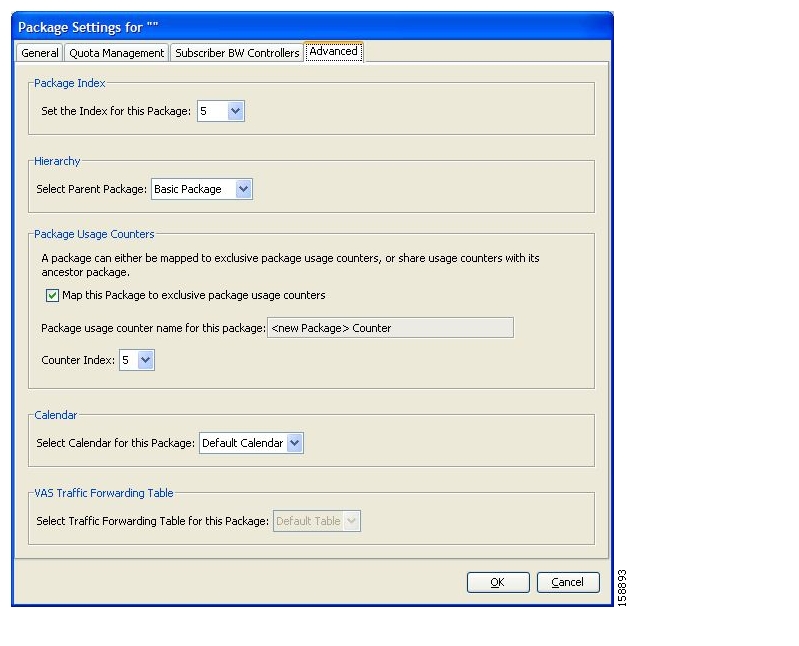
To change the package index for this package, from the Set the Index for this Package drop-down list, select a package index.
NoteA default value of the index is provided by the system. Do not modify this value unless a specific index value must be assigned to the package.To set a different parent package for this package, select the desired parent from the Select Parent Package drop-down list.
By default, a new package uses an exclusive usage counter. To share the parent package usage counter, uncheck the Map this Service to exclusive package usage counters check box.
The name in the read-only Package usage counter name for this package field changes to reflect your choice.
The Counter Index drop-down list is dimmed.
To change the counter index (if you are using an exclusive package usage counter), select a value for the index from the Counter Index drop-down list.
NoteA default value of the index is provided by the system. Do not modify this value.To set a calendar for this package (to use its time frames for time-based rules), select the desired calendar from the Select Calendar for this Package drop-down list.
To set a VAS traffic-forwarding table for this package, select the desired traffic-forwarding table from the Select Traffic Forwarding Table for this Package drop-down list.
NoteIf VAS traffic forwarding is disabled (the default), the drop-down list is dimmed. To enable VAS traffic forwarding, see Enabling VAS Traffic Forwarding.Click OK.
The Package Settings dialog box closes.
The new package is added as a child to the selected parent package and becomes the selected package. The default service rule is displayed in the right (Rule) pane.
To edit the default service rule, and to add new rules to the package, see Managing Rules.
Duplicating an existing package is a useful way to create a new package that is similar to an existing package. It is faster to duplicate a package and then make changes than to define the package from scratch.
A duplicated package is added at the same level in the package tree as the original package.
To duplicate a package:
In the Network Traffic tab, select a package from the package tree.
In the Network Traffic tab, click
(Duplicate Package).A duplicate package is created with all the same attributes as the original package. The name of the new package is the name of the selected package followed by “(1)” (or “(2)”, and so on if a package is duplicated many times).
Modify the package parameters (see Editing Packages).
You can modify the parameters of a package (including the default package) at any time.
To edit a package:
In the Network Traffic tab, select a package from the package tree.
In the Network Traffic tab, click
(Edit Package).The Package Settings dialog box appears.
In the Package name field, enter a new name for the package.
In the Description field, enter a new description of the package.
To change quota management settings, see Editing Package Quota Management Settings.
To change bandwidth control settings, see Editing Package Subscriber BWCs.
To change advanced settings, click the Advanced tab.
The Advanced tab opens.
To change the package index for this package, from the Set the Index for this Package drop-down list, select a Package Index.
NoteA default value of the counter index is provided by the system. Do not modify this value unless a specific index value must be assigned to the package.To change the parent package of this package, select the desired parent from the Select Parent Package drop-down list.
To share the parent package usage counter, uncheck the Map this Service to exclusive package usage counters check box.
The name in the read-only Package usage counter name for this package field changes to reflect your choice.
The Counter Index drop-down list is dimmed.
To use an exclusive package usage counter, check the Map this Service to exclusive package usage counters check box.
The name in the read-only Package usage counter name for this package field changes to reflect your choice.
The Counter Index drop-down list is enabled.
To change the counter index if you are using the exclusive package usage counter, select a value for the index from the Counter Index drop-down list.
NoteA default value of the counter index is provided by the system. Do not modify this value.To change the calendar used by this package, select the desired calendar from the Select Calendar for this Package drop-down list.
To change the VAS traffic-forwarding table for this package, select the desired traffic-forwarding table from the Select Traffic Forwarding Table for this Package drop-down list.
NoteIf VAS traffic forwarding is disabled (the default), the drop-down list is dimmed. To enable VAS traffic forwarding, see Enabling VAS Traffic Forwarding.
Click OK.
The Package Settings dialog box closes.
All changes to the package parameters are saved.
You can delete user-defined packages. The default package cannot be deleted.

If a traffic flow does not match any filter rule (see Filtering the Traffic Flows), and so is processed by the SCE platform, the SCE platform tries to identify the subscriber responsible for the traffic flow. The SCE platform looks at the IP address or VLAN tag of the traffic flow, and checks its internal database for a subscriber that is identified by this IP Address or VLAN tag. If such a subscriber is not found in the database, the traffic flow is mapped to the Unknown Subscriber Traffic category.
The Unknown Subscriber Traffic category is included in the tree in the Network Traffic tab, but it is not part of the package hierarchy. The Unknown Subscriber Traffic category cannot be deleted.
Unknown Subscriber Traffic is traffic:
That does not match any Filtered Traffic Rule.
and
The IP address or VLAN ID of the flow does not match any subscriber in the database.
Traffic of one unknown subscriber cannot be distinguished from traffic of other unknown subscribers. This gives the following limitations when controlling unknown subscriber traffic:
You cannot define per-subscriber usage limits.
You cannot define subscriber-level metering with subscriber BWCs. You can only use subscriber BWCs to link a selected service to a global controller.
The Unknown Subscriber Traffic category behaves like a package with the following parameters:
Package Name = Unknown Subscriber Traffic.
Package Index = 4999.
An exclusive package usage counter is defined; it is named Unknown Subscriber Traffic Counter and has Counter Index = 1023.
The following procedures are available for the Unknown Subscriber Traffic category:
Editing the Unknown Subscriber Traffic package settings:
Adding extra BWCs (see Editing Package Subscriber BWCs)
Selecting a calendar (see Setting Advanced Package Options)
Editing the default service rule:
Changing the Rule State (see Editing Rules)
Changing per-flow actions for the rule (see Defining Per-Flow Actions for a Rule)
Adding rules to the Unknown Subscriber Traffic package:
Adding rules (see Adding Rules to a Package); editing (see Editing Rules) and deleting (see Deleting Rules) these rules
Adding time-based rules (see Adding Time-Based Rules to a Rule); editing (see Editing Time-Based Rules) and deleting (see Deleting Time-Based Rules) these rules
After you have defined services and basic packages, you can define rules for the package.
You can configure rules to do some or all of the following:
Block the service
Set a quota for the service
Define maximum bandwidth for the service
Define behavior when the quota for this service is breached
A rule usually applies at all times. To allow additional flexibility, you can divide the week into four separate time frames. You can define subrules—time-based rules—for each time frame.
You can view a list of the rules of a package.
The listing for each rule includes an icon, the name of the service or group of services to which the rule applies, whether the rule is enabled or disabled, and a brief description of the rule.
To view the rules of a package:
In the Network Traffic tab, select a package from the package tree.
A list of all rules defined for this package is displayed in the right (Rule) pane.
To see more information about a rule, open the Edit Rule for Service dialog box (see Editing Rules).
To see more information about a time-based rule, open the Edit Time-Based Rule for Service dialog box (see Editing Time-Based Rules).
A default service rule is assigned to every package. It cannot be deleted or disabled.
The default values of this rule are:
Admit (do not block) traffic.
Map traffic to the default BWCs.
Do not limit quotas for either upstream or downstream traffic.
The SCE platform will apply the most specific rule to any flow.
For example, if you define rules for E-Mail and POP3, any flow that is mapped to the POP3 service will be handled according to the POP3 rule—any flow that is mapped to the SMTP or IMAP service will be handled according to the E-Mail rule. This means, for instance, that POP3 can have its own usage limits, whereas SMTP and IMAP must share usage limits.
Note
If you add a rule for a child service, the settings for the parent rule are not copied to the new rule. All new rules start with default values.
Any rule that also applies to child services is indicated by  . Rules that do not apply to any child services are shown by
  .
.
Time-based rules are shown as children of the relevant rule. The icon for a time-based rule also shows if the rule applies to child services ( or
or  ).
).
A default service rule is assigned to every package. You can add additional rules to a package.
Adding time-based rules is described in the section Adding Time-Based Rules to a Rule.
To add a rule to a package:
In the Network Traffic tab, select a package from the package tree.
In the right (Rule) pane, click
(Add Rule).The Add New Rule to Package dialog box appears.
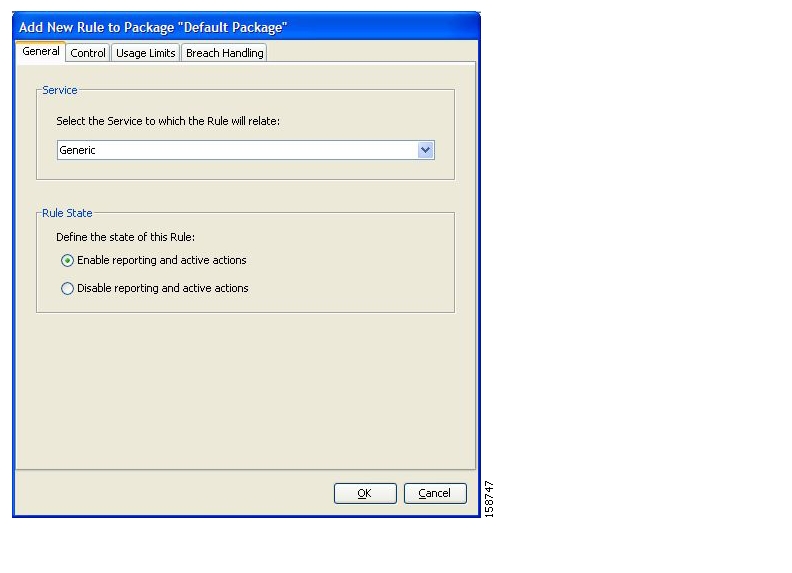
In the Service area of the Add New Rule to Package dialog box, select a service from the Select the Service to Which the Rule will Relate drop-down list.
NoteServices for which a rule is already defined for this package are dimmed.In the Rule State area, select one of the Define the State of this Rule radio buttons:
Enable reporting and active actions
Disable reporting and active actions
NoteYou can enable or disable a rule at any time (see Editing Rules).
To set behavior per traffic flow for this rule, continue with the instructions in the section Defining Per-Flow Actions for a Rule.
Click OK.
The Add New Rule to Package dialog box closes.
The new rule is added to the list of rules displayed in the right (Rule) pane.
Usage limits and breach handling are part of quota management (see Managing Quotas):
To configure parameters in the Usage Limits tab see Selecting Quota Buckets for Rules.
To configure parameters in the Breach Handling tab, see Editing Breach-Handling Parameters for a Rule.
The Control tab of the Add New Rule to Package dialog box allows you to set behavior per traffic flow for sessions that are mapped to the current service.
To define the traffic-flow behavior of the rule:
In the Add New Rule to Package dialog box, click the Control tab.
The Control tab opens.

To control flows that are mapped to the service of this rule, continue at step 5.
To block flows that are mapped to the service of this rule, select the Block the flow radio button.
The Redirect to check box is enabled.
NoteOnly three protocol types support redirection: HTTP, HTTP Streaming, and RTSP.(Optional) To redirect blocked flows, check the Redirect to check box.
The Redirection URL Set drop-down list is enabled.
If the service or service group for this rule includes protocols that cannot be redirected, a Rule Warning message appears.
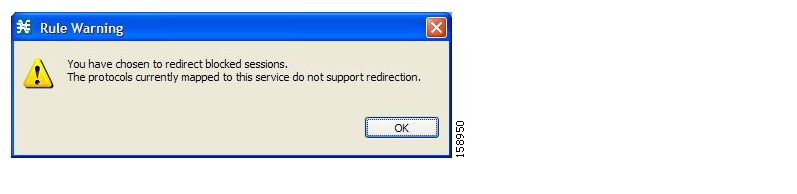
Click OK.
From the Redirection URL Set drop-down list, select a URL set to serve as the redirection target. (URL redirection sets are defined in the System Settings dialog box, see Configuring the Redirection Parameters.)
Continue at step 12.
Select the Control the flow’s characteristics radio button.
The options in the Flow Characteristic area are enabled.
From the upstream Bandwidth Controller drop-down list, select an upstream BWC. This sets up bandwidth metering of all concurrent flows mapped to this rule, based on the characteristics of the selected BWC.
The BWCs in this drop-down list are defined when creating or editing the package (see Editing Package Subscriber BWCs).
NoteImportant Note for time-based rules: If you need different global controller settings for different time frames, define maximum bandwidths per time frame for one global controller (see Setting Maximum Bandwidth of Global Controllers) instead of creating separate global controllers for each time frame and then assigning them to time-based rules.When the mouse is placed over the drop-down list, a tooltip appears containing the BW controller properties of the selected BW controller (Peak Information Rate (PIR), Committed Information Rate (CIR), Global Controller, and Assurance Level).

From the downstream Bandwidth Controller drop-down list, select a downstream BWC.
(Optional) To set a per-flow upstream bandwidth limit, check the Limit the flow’s upstream bandwidth check box and enter a value in the Kbps field.
NotePer-flow bandwidth has a granularity of 1 Kbps up to 57 Mbps.(Optional) To set a per-flow downstream bandwidth limit, check the Limit the flow’s downstream bandwidth check box and enter a value in the Kbps field.
(Optional) To set the maximum number of concurrent flows (mapped to this rule) permitted to a subscriber, check the Limit concurrent flows of this Service check box and enter a value in the associated field.
From the Set CoS for flows of this Service drop-down list, select a class-of-service.
Click OK.
The Add New Rule to Package dialog box closes.
The new rule is added to the list of rules displayed in the right (Rule) pane.
You can edit any rule, including the default service rule.
Note
You cannot disable the default service rule.
To edit a rule:
In the Network Traffic tab, select a package from the package tree.
In the right (Rule) pane, select a rule.
Click
(Edit Rule).The Edit Rule for Service dialog box appears.

In the Rule State area, select one of the Define the State of this Rule radio buttons:
Enable reporting and active actions
Disable reporting and active actions
To change behavior per traffic flow:
Click the Control tab.
The Control tab opens.
Follow the instructions in Defining Per-Flow Actions for a Rule.
To change usage limits:
Click the Usage Limits tab.
The Usage Limits tab opens.
Follow the instructions in Selecting Quota Buckets for Rules.
To define behavior when a quota is breached:
Click the Breach Handling tab.
The Breach Handling tab opens.
Follow the instructions in Editing Breach-Handling Parameters for a Rule.
Click OK.
The Edit Rule for Service dialog box closes.
All changes to the rule are saved.
Note
The tabs of the Edit Rule for Service dialog box are the same as the tabs of the Add New Rule to Package dialog box, except for the General tab—you cannot change the service to which the rule applies.
You can delete any user-defined rule. The default service rule cannot be deleted.
Note
You can disable a rule without losing its profile (see step 4 of Editing Rules). This allows you to enable the rule again later, without having to reset all its parameters. You cannot disable the default service rule.
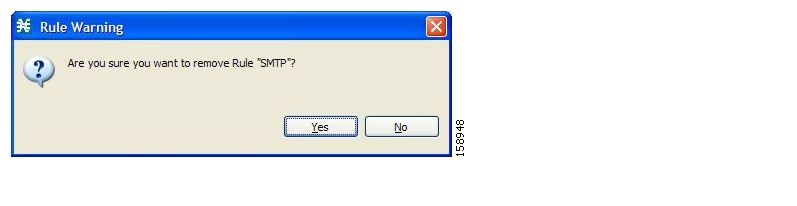
You can define a service as the child of another service (the parent service is a service group). Until you define a separate rule for a child service, the child service is governed by the rule of the parent service. A rule that affects any of a service’s children is indicated in the rules list by a different icon, as illustrated for the default service rule and the P2P rule in the following figure.

You can display all (child) services that are affected by a rule.
Note
The default service rule applies to all services for which a specific rule is not defined.
 (
(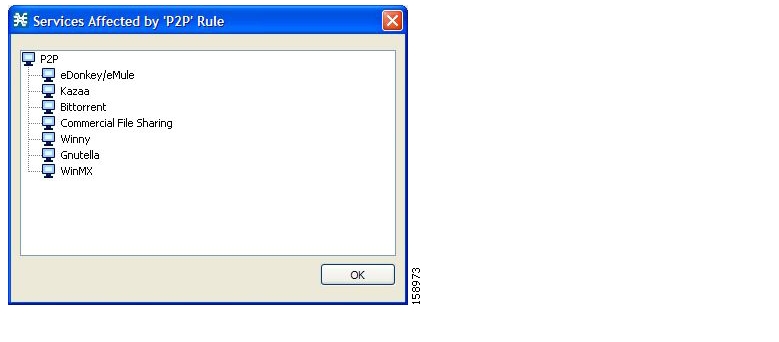
The Console allows you to split the week into four time frames (see Managing Calendars). A time-based rule is a rule that applies to one time frame.
You can add time-based rules to any rule. If a time-based rule is not defined for a time frame, the parent rule is enforced.
Often, you will want the rules for the different time frames to be similar. When you add a time-based rule, the settings of the parent rule are copied to the new time-based rule; you can make any needed changes. Subsequent changes to the parent rule do not affect the time-based rule.
You must define the calendar before defining the related time-based rules.
Adding a time-based rule to a rule allows you to specify alternate rule parameters applicable only for a specific time frame. If a time-based rule is not defined for a time frame, the parent rule is enforced.
Note
When you add a time-based rule, all parameters are initially set to the values defined for the parent rule. Subsequent changes to the parent rule do not change the time-base rule.
To add a time-based rule:
In the Network Traffic tab, select a package from the package tree.
In the right (Rule) pane, select a rule.
Click
 (Add Time-Based Rule).
The Add New Time-Based Rule dialog box appears.
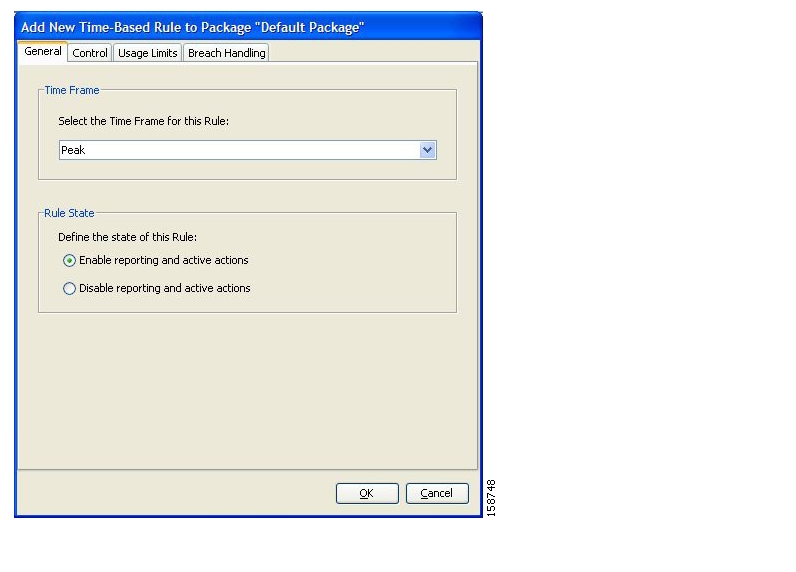
In the Time Frame area, from the Select the Time Frame for this Rule drop-down list, select one of the four time frames.
In the Rule State area, select one of the Define the State of this Rule radio buttons:
Enable reporting and active actions
Disable reporting and active actions
To define behavior per traffic flow:
Click the Control tab.
The Control tab opens.
Follow the instructions in Defining Per-Flow Actions for a Rule.
To change usage limits:
Click the Usage Limits tab.
The Usage Limits tab opens.
Follow the instructions in Selecting Quota Buckets for Rules.
To define behavior when a quota is breached:
Click the Breach Handling tab.
The Breach Handling tab opens.
Follow the instructions in Editing Breach-Handling Parameters for a Rule.
Click OK.
The Add New Time-Based Rule dialog box closes.
The new time-based rule is displayed as a child of the rule in the Rule pane.
Note
The tabs of the Add New Time-Based Rule dialog box are the same as the tabs of the Add New Rule to Package dialog box, except for the General tab. In the Add New Rule to Package dialog box, you select a service; in the Add New Time-Based Rule dialog box, you select a time frame.
A service whose time-based rule affects any of its child services is indicated in the rules list by a modified icon, as illustrated for the Weekend time-based rule of the P2P rule in the following screen capture.
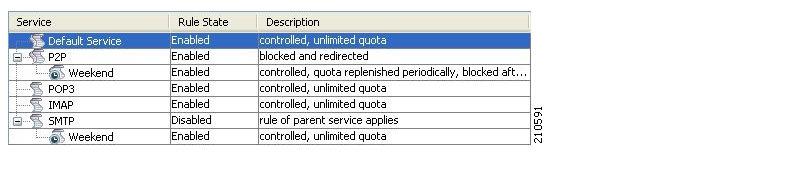
You can edit time-based rules.
To edit a time-based rule:
In the Network Traffic tab, select a package from the package tree.
In the right (Rule) pane, select a time-based rule.
Click
(Edit Rule).The Edit Time-Based Rule for Service dialog box appears.
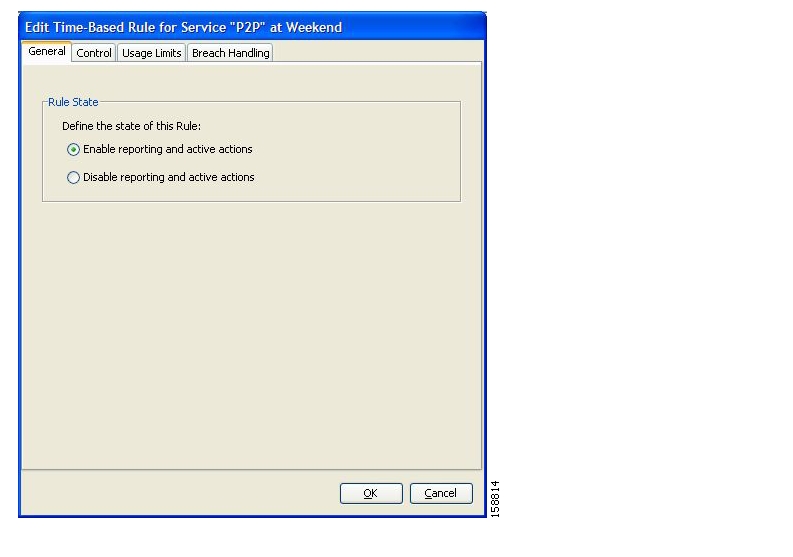
In the Rule State area, select one of the Define the State of this Rule radio buttons:
Enable reporting and active actions
Disable reporting and active actions
To change behavior per traffic flow:
Click the Control tab.
The Control tab opens.
Follow the instructions in Defining Per-Flow Actions for a Rule.
To change usage limits:
Click the Usage Limits tab.
The Usage Limits tab opens.
Follow the instructions in Selecting Quota Buckets for Rules.
To define behavior when a quota is breached:
Click the Breach Handling tab.
The Breach Handling tab opens.
Follow the instructions in Editing Breach-Handling Parameters for a Rule.
Click OK.
The Edit Time-Based Rule for Service dialog box closes.
All changes to the time-based rule are saved.
Note
The tabs of the Edit Time-Based Rule for Service dialog box are the same as the tabs of the Add New Time-Based Rule dialog box, except for the General tab. You cannot change the time frame to which the rule applies.
You can delete any time-based rule.
Note
You can disable a rule without losing its profile (see Editing Time-Based Rules). This allows you to enable the rule again later, without having to reset all its parameters.

Calendars are used to split the hours of the week into four time frames.
After you have configured a calendar, you can add time-based rules to a package that is using the calendar. A time-based rule is a rule that applies to only one time frame. Time-based rules allow you to set rule parameters that will apply only at specific times. You might, for example, want to define different rules for peak, off-peak, nighttime, and weekend usage.
Each service configuration includes one default calendar. You can add nine more calendars, each with a different time-frame configuration. You can use different calendars for different packages. You can also use different calendars where a service provider has customers in more than one time zone by configuring calendars with a one-hour offset from each other.
Managing calendars includes the following:
You can view a list of existing calendars and their time frames.
To view the weekly calendars:
From the Console main menu, choose Configuration > Weekly Calendars.
The Calendar Settings dialog box appears.
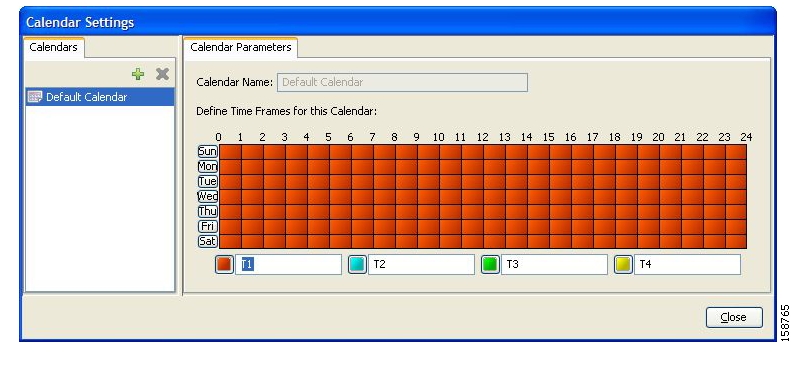
The Calendars tab displays a list of existing calendars. Click a calendar in the list to display its time-frame settings.
The time frames for the selected calendar are displayed and configured in the Calendar Parameters tab.
Click Close.
The Calendar Settings dialog box closes.
Each service configuration includes one default calendar. You can add up to nine more calendars.
To add a calendar:
From the Console main menu, choose Configuration > Weekly Calendars.
The Calendar Settings dialog box appears.
In the Calendar tab, click
(Add).A new calendar is added with the name Calendar (1).
In the Calendar Parameters tab, click in the Calendar Name field and enter the name for this calendar.
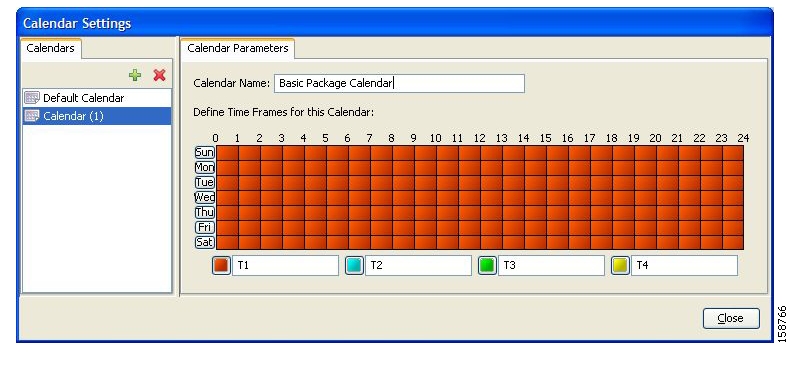
Click Close.
The Calendar Settings dialog box closes, and the new calendar name is saved.
By default, the time frames are named T1, T2, T3, and T4. You can change these names at any time; for example, you may want to name the time frames Peak, Off Peak, Night, and Weekend.
Note
Although you can configure the time frames differently in each calendar, the names of the time frames are the same in all of the calendars. If you change the name when configuring one calendar, the names are also changed for all other calendars.
To rename the time frames:
From the Console main menu, choose Configuration > Weekly Calendars.
The Calendar Settings dialog box appears.
In the Calendar Parameters tab, below the grid, each of the four time frames is listed in a field next to a colored square.
Click in a Time Frame Name field, and enter a new name for the time frame.
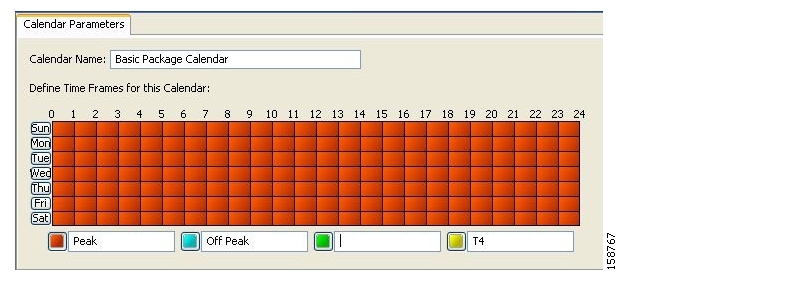
Repeat step 2 for the other three time frames.
Click Close.
The Calendar Settings dialog box closes, and the changes to the names of the time frames are saved.
You can delete any user-added calendar. The default calendar cannot be deleted.
Note
A calendar that is being used by any package cannot be deleted. (When you select the calendar, the Delete icon is dimmed.)
To delete the calendar, you must first select a different calendar for each package that is using the calendar that will be deleted. See Setting Advanced Package Options for information about changing the calendar that is associated with a package.
To delete a calendar:
From the Console main menu, choose Configuration > Weekly Calendars.
The Calendar Settings dialog box appears.
In the Calendar tab, select a calendar and click
(Delete).A Calendar Removal Confirmation message appears.
Click Yes.
The calendar is deleted.
Click Close.
The Calendar Settings dialog box closes.
By default, all the hours of the week belong to one time frame. The Console allows you to assign each of the 168 (24x7) hours of the week to one of four separate time frames. These time frames allow you to supply time-dependent differentiated services and to impose constraints on any service.
You might want, for example, to divide the week as follows:
Peak
Off Peak
Night
Weekend
You can define different time frames for each calendar.
To configure the time frames:
From the Console main menu, choose Configuration > Weekly Calendars.
The Calendar Settings dialog box appears.
In the Calendars tab, select a calendar to configure.
In the Calendar Parameters tab, the selected calendar’s Define Time Frames for this Calendar grid is displayed. The grid, representing one week, is laid out in a format of 24 hours x 7 days. Each cell represents one hour.
Below the grid, the name of each time frame appears next to a colored button.
Click one of the colored buttons.
Select all the cells in the grid that represent hours that will be part of the selected time frame.
You can select a group of cells by holding down the mouse button and dragging across the cells.

The changes are written to the service configuration as you make them.
Repeat steps 3 and 4 for the other time frames until you have mapped the entire grid.
Click Close.
The Calendar Settings dialog box closes.
You have now mapped the week into four different time frames. The following figure illustrates a possible time partition plan:

The upstream and downstream interfaces are each assigned one default global controller. You can add additional global controllers.
A service configuration can contain up to 1024 upstream global controllers and 1024 downstream global controllers (including the default global controllers).
After you have defined global controllers, you can add subscriber BW Controllers (BWCs) to packages, and map these subscriber BWCs to different global controllers.
The upstream and downstream interfaces are each assigned one default global controller that, by default, controls 100% of the link traffic. You can add up to 1023 more global controllers for each interface, and assign a maximum percentage of the total link limit to each global controller separately.
You can also define the bandwidth total link limit to be less than the physical capacity of the SCE platform for each interface separately. When another device that has limited BW capacity is next to the SCE platform on the IP stream, you can have this limitation enforced in a policy-aware manner by the SCE platform, instead of having it enforced arbitrarily by the other device.
Note
Global controller bandwidth is based on Layer 1 volume.
(Accounting, reporting, and subscriber bandwidth control in SCA BB is based on Layer 3 volume.)
To view global controller settings:
From the Console main menu, choose Configuration > Global Controllers.
The Global Controller Settings dialog box appears.
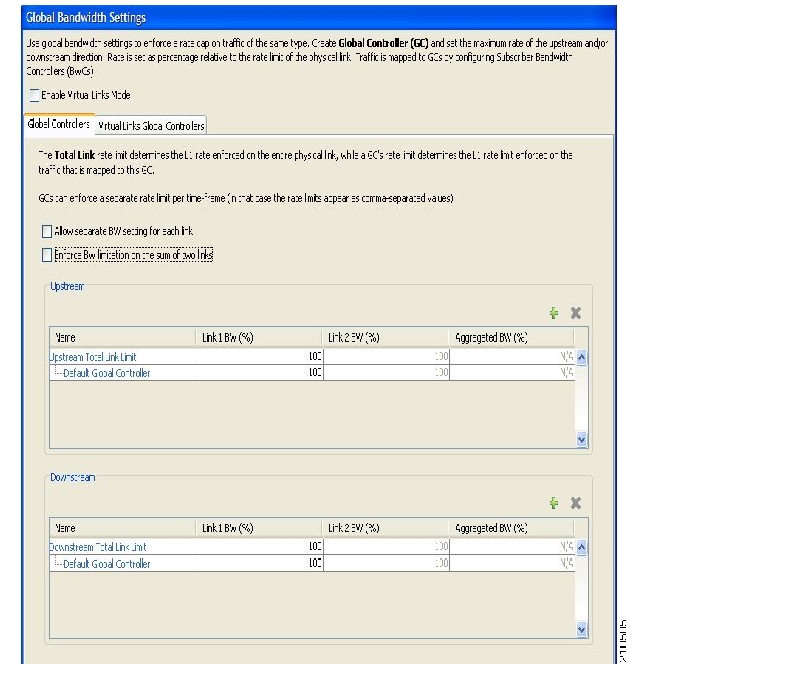
The two check boxes at the top of the Global Controller Settings dialog box are used only in dual-link systems (see Defining Global Controllers in a Dual-Link System).
The main part of the dialog box contains the Upstream area listing upstream global controllers and the Downstream area listing downstream global controllers. Each list has four columns; the third and fourth columns are relevant to dual-link systems:
Name—A unique name assigned to the global controller. The system automatically assigns the names Controller 1, Controller 2, and so on.
Link 1 BW (%)—The maximum percentage of the total link limit permitted to this global controller.
For each global controller you can set different values for the maximum bandwidth for each of the four time frames defined by the default calendar (see Managing Calendars):
A single value in this field indicates that the maximum bandwidth for this global controller is constant.
If each time frame has a different maximum bandwidth, the maximum bandwidth for each time frame is displayed, separated by commas.
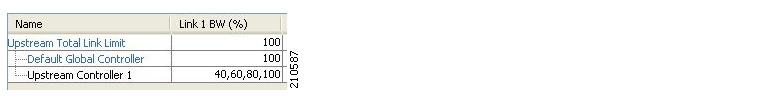
If two time frames have the same maximum bandwidth, the value is not repeated. (So 40,,,100 means that the first three time frames have a maximum bandwidth of 40% of the total link limit, and the fourth time frame has a maximum bandwidth equal to the total link limit.)
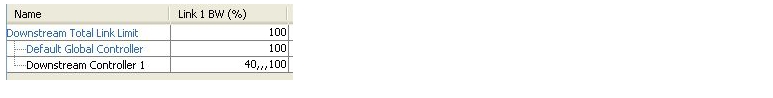
Trailing commas are suppressed. (So 40,100 means that the first time frame has a maximum bandwidth of 40% of the total link limit, and the other three time frames have a maximum bandwidth equal to the total link limit.)
To view the actual maximum bandwidth values, place the cursor over the Link 1 BW (%) cell.
A tooltip appears, showing the actual maximum bandwidth permitted to this global controller, in Mbps. This figure is calculated automatically by the system based on the possible SCE platform types (Gigabit Ethernet or Fast Ethernet), the controller maximum bandwidth percentage, and the total link bandwidth percentage.

Click OK.
The Global Controller Settings dialog box closes.
You can limit the total bandwidth passing through the SCE platform.
For example, if another device sitting next to the SCE platform on the IP stream has limited BW capacity, you can limit the bandwidth passing through the SCE platform to match the capacity of the other device.
The total link limits for upstream and downstream traffic are defined independently.
To edit the total link limit:
From the Console main menu, choose Configuration > Global Controllers.
The Global Controller Settings dialog box appears.
Click in the Link 1 BW (%) cell of the Upstream Total Link Limit or Downstream Total Link Limit, and enter the maximum percentage of the SCE platform capacity that the platform will carry.
The values displayed in the tooltips of all the cells in the Link 1 BW (%) cells change to reflect the new total link limit.
Click OK.
Your changes are saved.
The Global Controller Settings dialog box closes.
You can add up to 1023 upstream global controllers and 1023 downstream global controllers to a service configuration.
To add a global controller:
From the Console main menu, choose Configuration > Global Controllers.
The Global Controller Settings dialog box appears.
Above the area (Upstream or Downstream) of the desired interface, click
(Add).A new global controller is added to the interface global controller list with a maximum bandwidth capacity of 100% of the total link limit.
In the Name cell of the new global controller, enter a meaningful name.
NoteYou can use the default name for the global controller. It is recommended that you enter a meaningful name.To edit the maximum bandwidth of the global controller, continue with the instructions in the section Setting Maximum Bandwidth of Global Controllers.
Click OK.
Your changes are saved.
The Global Controller Settings dialog box closes.
You can edit the maximum bandwidth (as a percentage of the total link limit) that a global controller can carry.
You can set a different maximum bandwidth for each of the four available time frames.
In a dual-link system, you can set different values for each link and for the aggregated BW of the two links.
To set the maximum bandwidth of global controllers:
From the Console main menu, choose Configuration > Global Controllers.
The Global Controller Settings dialog box appears.
Click in a BW (%) cell of a global controller listing.
A Browse button appears in the cell.
Click the Browse button.
The Global Controller Bandwidth Settings dialog box appears.

To set a single value for the maximum percentage of the total link limit that this global controller carries:
Select Enforce a single BW limit, and enter the desired value for the maximum percentage of bandwidth.
To have the maximum percentage of the total link limit that this global controller carries vary according to time frame:
Select Enforce a separate BW limit per Time Frame, and enter the desired value in each BW (%) cell.
NoteThese values will be applied to the time frames of the default calendar.
Click OK.
The Global Controller Bandwidth Settings dialog box closes.
The value in the BW (%) cell changes to reflect the new bandwidth limits.
Repeat steps 2 to 6 for other global controllers.
Click OK.
Your changes are saved.
The Global Controller Settings dialog box closes.
You can delete unused global controllers at any time. The default global controller and the Total Link Limit cannot be deleted.
To delete a global controller:
From the Console main menu, choose Configuration > Global Controllers.
The Global Controller Settings dialog box appears.
Select a global controller.
Click
NoteIf the specified global controller is being used by a subscriber BWC (see Editing Package Subscriber BWCs), a Global Controller cannot be removed message is displayed. The global controller cannot be deleted until you unassign it from all subscriber BWCs. (Delete).The global controller is deleted.
Click OK.
Your changes are saved.
The Global Controller Settings dialog box closes.
In a dual-link system, you can define each global controller’s maximum bandwidth separately for each link.
Alternatively, you can apply bandwidth limitations to the sum of the two links.
To define global controllers separately for each link in a dual-link system:
From the Console main menu, choose Configuration > Global Controllers.
The Global Controller Settings dialog box appears.
Add global controllers, as described in Adding Global Controllers.
Check the Allow separate BW setting for each link check box.
The cells in the Link 2 BW (%) column are enabled.
Each cell has the same value as the parallel cell in the Link 1 BW (%) column.
Define the bandwidth percentages (Link 1 BW (%)) for the global controllers for link 1.
Changes to bandwidth percentages are not copied to the Link 2 tab.
In the Link 2 BW (%) column, define the bandwidth percentages for the global controllers for link 2.
Click OK.
Your changes are saved.
The Global Controller Settings dialog box closes.
To set a single bandwidth limit as the sum of two links in a dual-link system:
From the Console main menu, choose Configuration > Global Controllers.
The Global Controller Settings dialog box appears.
Check the Enforce BW limitation on the sum of two links check box.
The cells in the Aggregated BW (%) column are enabled and contain the value 100.
Click OK.
Your changes are saved.
The Global Controller Settings dialog box closes.
After you have defined global controllers, you can add subscriber BWCs to packages and map these subscriber BWCs to different global controllers.
A Subscriber BWC is a mechanism that supports the control of subscriber bandwidth consumption for upstream or downstream flows. A subscriber BWC allows the control and metering of the bandwidth of an aggregation of traffic flows of a service or group of services.
Each package has its own set of BWCs that determine the bandwidth available per package subscriber for each available service.
There are two Primary BWCs that operate at the subscriber level, one for upstream traffic and one for downstream traffic. The Primary BWCs allocate bandwidth to specific subscribers, depending upon the Committed Information Rate (CIR), Peak Information Rate (PIR), and the Subscriber relative priority settings. You can configure these parameters, but the Primary BWCs cannot be deleted.
There are two default BWCs, one for upstream traffic and one for downstream traffic. By default, all services are mapped to one of these two BWCs. The BWC mechanism controls rate subpartitioning within the default BWC rate control, based on the CIR, PIR, CoS, and AL. You can configure these parameters, but the default BWCs cannot be deleted.
You can add up to 32 user-defined BWCs per package:
Subscriber BWCs operate at the service-per-subscriber level. They allocate bandwidth for each subscriber’s service, based upon the CIR, PIR, Global Controller and Assurance Level (AL) set for the BWC. Each rule defines a link between the service’s flows and one of the BWCs (unless the flows are to be blocked). See Defining Per-Flow Actions for a Rule.
An Extra BWC is a unique capability that also operates at the subscriber level. Extra BWCs are allocated for services that are not included in the Primary BWC. Extra BWCs are defined (based on CIR, PIR, Global Controller, and AL), in addition to the Primary BWC. Define an Extra BWC for services that are not often used but have strict bandwidth requirements, for example, a video conference call. The Extra BWCs are BWCs that control a single service (or service group). BWCs cannot borrow bandwidth from Extra BWCs and vice versa.
Each user-defined BWC controls either downstream or upstream traffic.
Bandwidth control is explained in greater detail in the section Subscriber Bandwidth Control.
The following are the configuration parameters in the Subscriber BW Controllers tab of the Package Settings dialog box:
Name—A unique name for each BWC.
CIR (L3 Kbps)—The minimum bandwidth that must be granted to traffic that is controlled by the BWC.
PIR (L3 Kbps)—The maximum bandwidth allowed to traffic that is controlled by the BWC.
NoteBandwidth for a subscriber BWC has a granularity of 16 Kbps:NoteIf you specify a bandwidth of, for instance, 64 Kbps, the bandwidth will be stable at this value.NoteIf you specify a bandwidth of, for instance, 70 Kbps, the bandwidth will be unstable and oscillate between 64 Kbps and 80 Kbps.Global Controller—The global controller with which this subscriber BWC is associated. The global controllers are virtual queues that are part of the bandwidth control mechanism (see Global Bandwidth Control). Direct traffic with similar bandwidth control properties to the same global controller.
AL—How fast bandwidth decreases from PIR to CIR as congestion builds, or increases from CIR to PIR as congestion decreases. A higher AL ensures a higher bandwidth compared to a similar BWC with a lower AL. 1 is the lowest assurance value, 10 (persistent) is the highest assurance value.
Assurance Level 10 (persistent) has the added quality that it does not ever reduce below the relevant CIR, unless the total line rate cannot sustain this.
Subscriber relative priority—Assurance Level given to the Total BWC of the subscriber. It determines the assurance given to all the subscriber traffic when competing for bandwidth with subscribers to other packages. 1 is the lowest value and 10 is the highest value.
Note
Subscriber bandwidth control (and accounting and reporting) is based on Layer 3 volume.
Global controller bandwidth is based on Layer 1 volume.
To edit the package BWC settings:
Click in the Global Controller cell of the BWC, and click the Browse button that appears.
The Select a Global Controller dialog box appears.
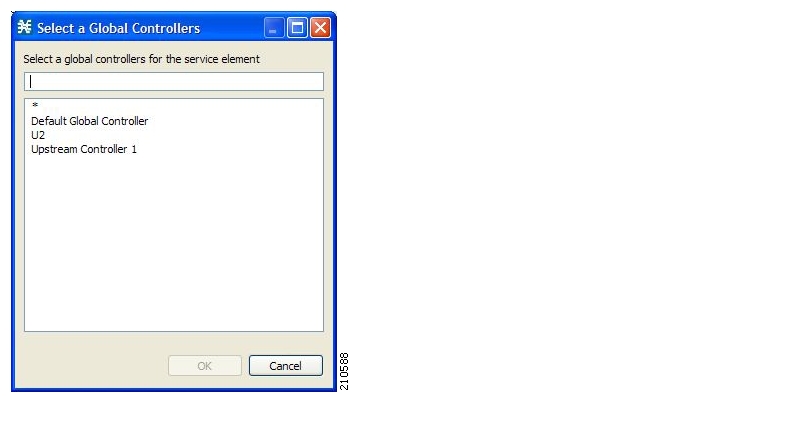
Select a global controller and click OK.
Select a value from the AL drop-down list.
Note1 is the lowest value and Persistent is the highest value.In the Network Traffic tab, select a package from the package tree.
In the Network Traffic tab, click
(Edit Package).The Package Settings dialog box appears.
In the Package Settings dialog box, click the Subscriber BW Controllers tab.
The Subscriber BW Controllers tab opens.

Set your requirements for upstream bandwidth control in the Upstream area of the dialog box:
Select a value from the Subscriber relative priority drop-down list.
Note1 is the lowest priority and 10 is the highest.Set the parameters for the Primary Upstream BWC:
In the CIR field, enter the BWC CIR in Kbps.
In the PIR field, select Unlimited from the drop-down list, or enter the BWC PIR in Kbps.
-
To add BWCs to the package, click
 (Add a sub BW Controller) once for each additional BWC.
 To add Extra BWCs to the package, click
 (Add an extra BW Controller) once for each additional BWC.
Set the parameters for each BWC (including the Primary and Default BWCs):
In the CIR field, enter the BWC CIR in Kbps.
In the PIR field, select Unlimited from the drop-down list, or enter the BWC PIR in Kbps.
To set the global controller with which this BWC is associated:
Repeat step 4 for downstream bandwidth control in the Downstream area of the dialog box.
Click OK.
The Package Settings dialog box closes.
All changes to the BWC settings are saved.
This section explains how to combine the global controllers and subscriber BWCs to achieve effective bandwidth control.
To configure total bandwidth control:
Configure the necessary global controllers.
Try to ascertain which services are likely to be problematic, and what the maximum percentage of total bandwidth should be for each. You do not need to configure services and packages that are unlikely to be problematic; you can include them in the default global controllers.
Configure the subscriber BWCs for the package:
Add a subscriber BWC for each type of upstream or downstream traffic that you want to limit, and configure the Committed Information Rate (CIR) and the Peak Information Rate (PIR) accordingly.
Select an appropriate global controller for each subscriber BWC.
Create a rule for each service that is to have its own BWC.
Select appropriate upstream and downstream BWCs for each service.
Example
To limit P2P and streaming traffic:
- NoteThis example assumes that the traffic flow is bidirectional; you may decide that you only need upstream controllers or downstream controllers.
Define two upstream global controllers and two downstream global controllers and assign the desired percentage of traffic to each global controller.
Upstream Controller 1 and Downstream Controller 1 will be used for P2P traffic, and Upstream Controller 2 and Downstream Controller 2 will be used for streaming traffic.
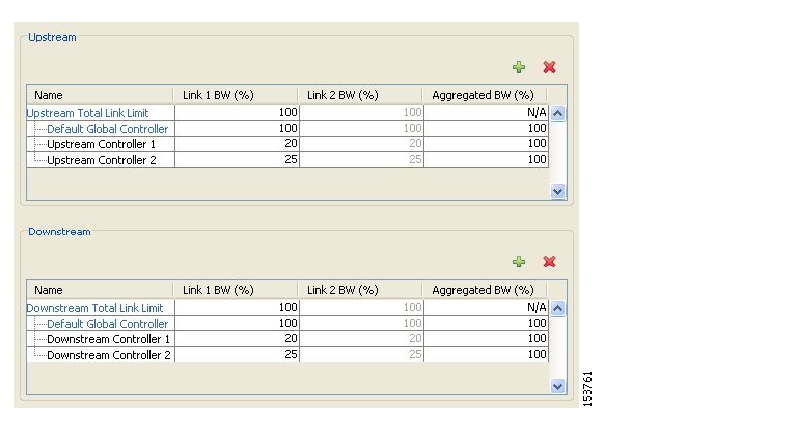
In a package add two upstream BWCs and two downstream BWCs, map them to the appropriate global controllers, and set their parameters (CIR, PIR, AL).
(BWC1 is for upstream P2P traffic and BWC3 is for downstream P2P traffic; BWC2 is for upstream streaming traffic and BWC4 is for downstream streaming traffic.)

Add a rule for the P2P service.
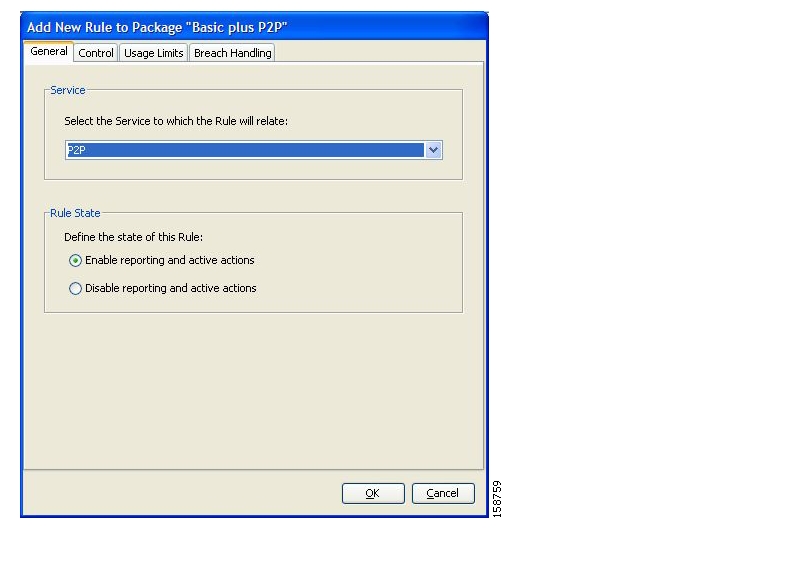
In the Control tab, assign BWC 1 as the upstream BWC and BWC 3 as the downstream BWC.

Repeat steps 3 and 4 for the Streaming service, using BWC 2 and BWC 4.
All subscriber traffic using these services will be added to the virtual queue total for these queues, and, in turn, the bandwidth available to the subscriber for these protocols will fluctuate depending on how “full” these queues are.
Relative priority is the level of assurance that internal BWCs get when competing against other internal BWCs for bandwidth. There are two relative priority options:
Global Prioritization Mode—Flows that go through internal BWCs get their relative priority from the BWC’s assurance level.
Subscriber Prioritization Mode (default)—The relative priority of the flow is determined by the relative priority of the subscriber.
To set the BW Management parameters:
From the Console main menu, choose Configuration > System Settings.
The System Settings dialog box appears.
Click the BW Management tab.
The BW Management tab opens.
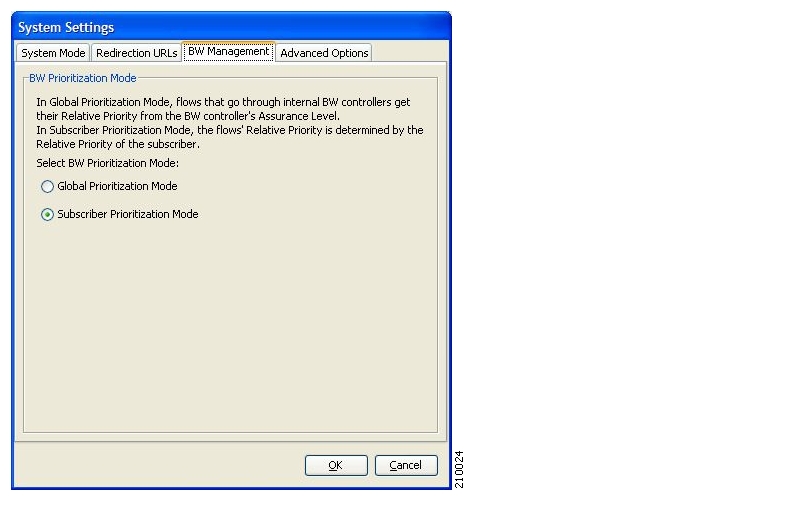
Select one of the BW Prioritization Mode radio buttons:
Global Prioritization Mode
Subscriber Prioritization Mode
Click OK.
The System Settings dialog box closes.
The selected BW management parameter is saved.
You can define whether quota management is performed by an external quota manager, or by SCA BB.
You also define the quota buckets associated with the package. Rules can use quota buckets to set limits to the consumption of particular service groups (see the following section).
To edit the package quota management settings:
In the Network Traffic tab, select a package from the package tree.
In the Network Traffic tab, click
(Edit Package).The Package Settings dialog box appears.
In the Package Settings dialog box, click the Quota Management tab.
The Quota Management tab opens.
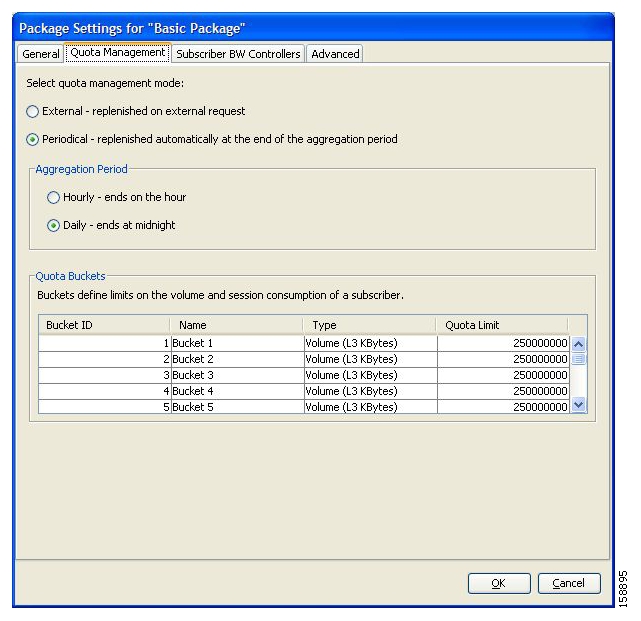
Select one of the Select quota management mode radio buttons:
External—Replenishes on external request
Periodical—Replenishes automatically
If you selected periodical quota management, select one of the Aggregation Period radio buttons to specify when the quota is renewed for the package:
Hourly Resolution—Ends at each hour change
Daily Resolution—Ends at midnight
Configure the quota buckets. Make sure that the configuration of the quota buckets is appropriate to the rules that you will apply to the package. For example, if you do not configure a bucket with Type = Number of sessions, you cannot define a rule with usage limits defined in number of sessions.
To edit a bucket:
Bucket ID—Display only.
Name—Enter a name for the bucket in the Name cell.
NoteYou can use the default name for the protocol. It is recommended that you enter a meaningful name.Type—Click in the Type cell, click the drop-down arrow that appears in the cell, and then select either Volume (L3 Kbytes) or Number of sessions from the drop-down list.
Quota Limit—Define the actual limit for this bucket in kilobytes or number of sessions, depending on the selected Type.
NoteQuota limits can only be set if you selected periodical quota management in step 4.
Click OK.
The Package Settings dialog box closes.
All changes to the quota management settings are saved.
You can select the quota buckets that the flows mapped to a rule will use. The quota buckets in the drop-down lists were defined during package setup (see Editing Package Quota Management Settings). If no quota bucket is appropriate for the rule, add a new quota bucket to the package, or edit an existing bucket.
To select quota buckets for a rule:
In the Network Traffic tab, select a package from the package tree.
In the right (Rule) pane, select a rule.
Click
(Edit Rule).The Edit Rule for Service dialog box appears.
Click the Usage Limits tab.
The Usage Limits tab opens.
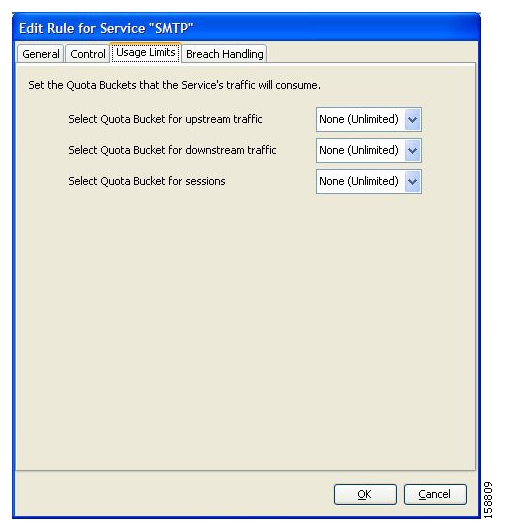
Select the desired bucket from each drop-down list:
Select Quota Bucket for upstream traffic
Select Quota Bucket for downstream traffic
Select Quota Bucket for sessions
NoteSelect None (Unlimited) for unlimited quota.
To define behavior when a quota is breached, if you have selected a quota bucket for any for the options in step 5, continue with the instructions in the following section.
Click OK.
The Edit Rule for Service dialog box closes.
All changes to the rule are saved.
The following are the configuration parameters in the Breach Handling tab of the Edit Rule for Service Settings dialog box.
You determine what happens to flows identified as belonging to this rule when a quota is breached:
No changes to active control—Flows mapped to this rule are not affected when quota is breached. SCA BB can generate Quota Breach RDRs even when this option is selected (see Managing Quota RDRs).
Block the flow—Flows mapped to this rule are blocked when quota is breached.
Redirect to—Redirect the flow to a specified, protocol-dependent URL, where a posted web page explains the reason for the redirection. URL redirection sets are defined in the System Settings dialog box. (See Configuring the Redirection Parameters.) Only three protocol types support redirection: HTTP, HTTP Streaming, and RTSP.
Control the flow characteristics—The behaviors of flows mapped to this rule change when quota is breached:
Select an upstream Bandwidth Controller—Map this rule’s traffic flows to a specific upstream BWC. This sets up bandwidth metering of all concurrent flows mapped to this rule, based on the characteristics of the selected BWC.
Select a downstream Bandwidth Controller—The same functionality as the previous option, but for downstream flow.
Limit the flow’s upstream bandwidth—Set a per-flow upstream bandwidth limit (for flows mapped to the service of this rule).
Limit the flow’s downstream bandwidth—Set a per-flow downstream bandwidth limit.
Limit concurrent flows of this Service—Set the maximum number of concurrent flows (mapped to this rule) permitted to a subscriber.
Activate a Subscriber Notification—Activate a Subscriber Notification when subscribers exceed their quota limit. This notification can, for example, convey the quota breach situation to the subscriber and provide information on how to obtain additional quota.
To define Subscriber Notifications, see Managing Subscriber Notifications.
You can define the SCE platform behavior when an aggregated volume limit or the total number-of-sessions limit is exceeded. You can also notify subscribers when they exceed their quotas.
To define breach-handling behavior for the rule:
In the Network Traffic tab, select a package from the package tree.
In the right (Rule) pane, select a rule.
Click
(Edit Rule).The Edit Rule for Service dialog box appears.
Click the Breach Handling tab.
The Breach Handling tab opens.
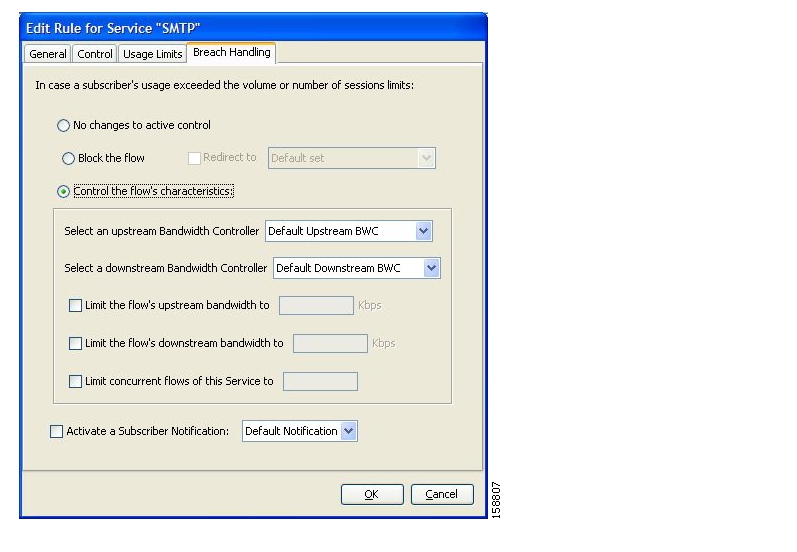
To block the flow when quota is breached, continue at step 7.
To change the flow’s characteristics when quota is breached, continue at step 9.
To leave the flow unchanged when quota is breached, select the No changes to active control radio button.
Continue at step 10.
To block flows that are mapped to the service of this rule:
Select the Block the flow radio button.
The Redirect to check box is enabled.
(Optional) To redirect blocked flows (for HTTP, HTTP Streaming, and RTSP), check the Redirect to check box.
The Redirection URL Set drop-down list is enabled.
NoteIf the service or service group for this rule includes protocols that cannot be redirected, a Rule Warning message appears.NoteClick OK to continue.Select a redirection URL set from the Redirect drop-down list.
Continue at step 10.
Select the Control the flow’s characteristics radio button.
The options in the Flow Characteristic area are enabled:
From the upstream Bandwidth Controller drop-down list, select an upstream BWC.
The BWCs in this drop-down list are defined when creating or editing the package (see Editing Package Subscriber BWCs).
When the mouse is placed over the drop-down list, a tooltip appears containing the properties of the selected BWC (Peak Information Rate (PIR), Committed Information Rate (CIR), Global Controller, and Assurance Level).
From the downstream Bandwidth Controller drop-down list, select a downstream BW Controller.
(Optional) Check the Limit the flow’s upstream bandwidth check box and enter a value in the Kbps field.
(Optional) Check the Limit the flow’s downstream bandwidth check box and enter a value in the Kbps field.
(Optional) Check the Limit concurrent flows of this Service check box and enter a value in the associated field.
(Optional) Activate subscriber notification:
Check the Activate a Subscriber Notification check box and then select the desired subscriber notification from the drop-down list. .
NoteA subscriber notification can be activated in addition to any of the three breach-handling options.
Click OK.
The Edit Rule for Service dialog box closes.
All changes to the rule are saved.
This chapter explains how to use additional, advanced functionality that is available in the Service Configuration Editor.
The Service Security Dashboard allows you to view and control all SCA BB security functionality.
The Dashboard is a gateway to a set of features that help you protect your network from security threats such as worms, DDoS attacks, and spam zombies. It allows configuration of the detection mechanisms (for example, attack thresholds) and of the actions to be taken when an attack is detected.
The Dashboard also allows you to access malicious traffic reports in the Reporter tool.
To view the Service Security Dashboard:
In the Network Traffic tab, select Service Security.
The Service Security Dashboard is displayed in the right pane.
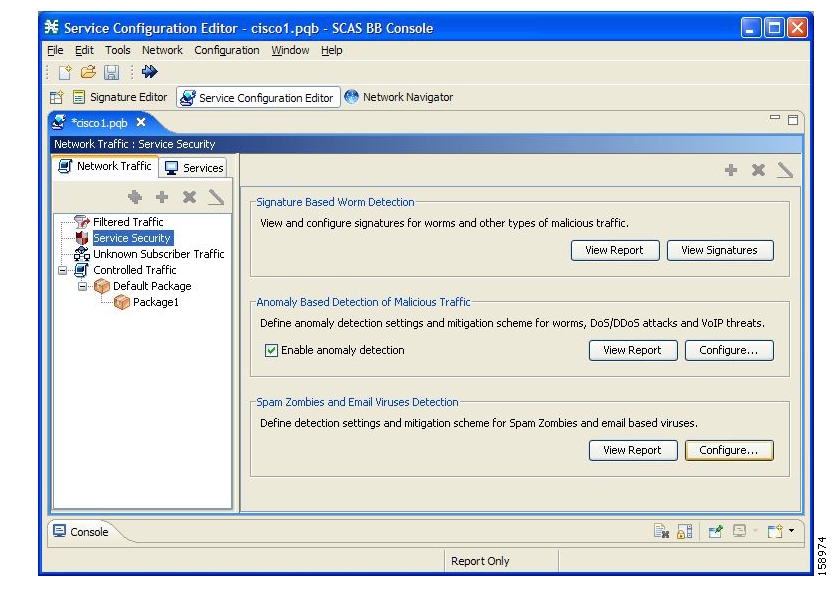
Viewing and configuring the various detection mechanisms and viewing malicious traffic reports are described in the following sections.
SCA BB uses three mechanisms for detecting worms:
Signature based detection—The SCE platform’s stateful Layer 7 capabilities can detect malicious activity that is not easily detectable by other mechanisms. You can add signatures for new worms.
Anomaly based detection—Overall traffic analysis can detect anomalies that might indicate worm activity. See Managing Anomaly Detection.
Mass-mailing based detection—E-mail traffic analysis can detect anomalies that might indicate e-mail-based worms. See Configuring Spam Detection Settings.
To view supported worm signatures:
In the Service Security Dashboard, click View Signatures.
The Signatures Settings dialog box appears, with Worm Signatures selected in the Signature Type drop-down list.
All supported worm signatures are listed.
Click Close.
The Signatures Settings dialog box closes.
To add new worm signatures to a service configuration:
Do one of the following:
Import the latest DSS or SPQI file provided by Cisco.
Create a DSS file containing any worm signatures that you wish to add to the service configuration.
For more information, see Managing Protocol Signatures.
The most comprehensive threat detection method is anomaly detection.
The basic principle of anomaly detection is monitoring successful (correctly established for TCP, bi-directional for other protocols) and unsuccessful (not properly established for TCP, unidirectional for other protocols) connection rates both to and from any IP address viewed by the system, and triggering an anomaly detection condition based of one of the following criteria:
The total connection rate exceeds a predefined threshold.
The suspicious connection rate exceeds a predefined threshold and the ratio of suspicious to unsuspicious connections exceeds a predefined threshold.
The ratio metric is a particularly robust indicator of malicious activity, and together with a rate qualifier serves as a reliable identifier for malicious activity.
Anomaly detection is split into three categories based on the directional nature of the detected anomaly condition. The concepts used for the three categories are identical, but the nature of the detected malicious activity is different for each category.
Scan/Sweep detector—Detects malicious activity that is based on an anomaly in connection rates from an IP address.
DoS detector—Detects an anomaly in the connection rate between a pair of IP addresses: one of them is attacking the other. This can be either an isolated attack or part of a larger scale DDoS attack.
DDoS detector—Detects an anomaly in the connection rate coming to an IP address, which means that it is being attacked. The attack can be by either a single IP address (DoS) or multiple IP addresses.
For all kinds of anomaly detection conditions, maximum flexibility is provided by the ability to define detection thresholds and the trigger actions to be taken for each:
Flow direction
Flow protocol
(Optional) Port uniqueness for TCP and UDP
Note
The GUI configuration described here replaces the CLI command set for configuring the Attack Filtering Module of the SCE platform, which was available in previous releases.
For each anomaly detector category (Scan/Sweep, DoS, DDoS) there is one default detector. You can add additional detectors of each category. Detectors in each category are checked in order; the first match (according to the detector’s threshold settings) triggers detection. You set the order in which detectors are checked; the default detector is checked last.
Anomaly detectors can contain up to 12 anomaly types associated with malicious traffic:
Network initiated—Malicious traffic initiated from the network side:
TCP—Aggregate TCP traffic on all ports
TCP Specific Ports—TCP traffic on any single port
UDP—Aggregate UDP traffic on all ports
UDP Specific Ports—UDP traffic on any single port
ICMP—Aggregate ICMP traffic on all ports
Other—Aggregate traffic using other protocol types on all ports
Subscriber initiated—Malicious traffic initiated from the subscriber side:
TCP
TCP Specific Ports
UDP
UDP Specific Ports
ICMP
Other
NoteICMP and Other anomaly types are not available for DoS attack detectors.
Each anomaly type on a detector has the following attributes associated with it:
Detection thresholds—There are two thresholds, crossing either of them means that an attack is defined to be in progress:
Session Rate threshold—The number of sessions (per second) over specified ports for a single IP address that trigger the anomaly detection condition.
Suspected sessions threshold—Suspected sessions are sessions that are not properly established (for TCP), or that are unidirectional sessions (for other protocols). Exceeding both the Suspected Session Rate and the Suspected Session Ratio will trigger the anomaly detection condition. (A relatively high session rate with a low response rate typically indicates malicious activity.)
Suspected Session Rate—The number of suspected sessions (per second) over specified ports for a single IP address.
Suspected Session Ratio—The ratio (as a percentage) between the suspected session rate and the total session rate. A high ratio indicates that many sessions received no response, an indication of malicious activity.
Actions—Zero or more of the following actions may be taken when an anomaly detection condition is triggered (by default, no action is enabled):
NoteLogging of the anomaly to an on-device log file and generation of RDRs is not configurable per anomaly type.Alert User—Generate an SNMP trap (see the “SCA BB Proprietary MIB Reference” chapter of the Cisco Service Control Application for Broadband Reference Guide for information about the Cisco proprietary MIB) indicating the beginning and end of an anomaly.
Notify Subscriber—Notify the relevant subscriber of the malicious activity, by redirecting his browsing sessions to a captive portal. To configure network attack subscriber notification, see Managing Subscriber Notifications.
Block Attack—Block the relevant sessions. Blocking is performed based on the specification of the malicious traffic that triggered the anomaly detection condition. If subscriber notification is enabled for the anomaly type, blocking is not applied to the port relevant for browsing (by default, this is TCP port 80; see Managing Advanced Service Configuration Options).
User defined detectors can also have one or more of the following attributes:
IP address list—Limit detection to the listed IP address ranges. This applies to the source IP when detecting IP sweeps and port scans. It applies to the destination IP when detecting DoS and DDoS attacks.
TCP port list—Limit detection to the listed destination TCP ports. This list is applied to TCP Specific Ports anomaly types only.
UDP port list—Limit detection to the listed destination UDP ports. This list is applied to UDP Specific Ports anomaly types only.
You can view a list of all anomaly detectors. The anomaly detectors are displayed in a tree, grouped according to detector category (Scan/Sweep, DoS, or DDoS).
For each anomaly detector you can view its associated parameters and see a list of all anomaly types included in the detector, together with their parameters.
To view anomaly detection settings:
In the Service Security Dashboard, in the Anomaly Based Detection of Malicious Traffic pane, click Configure.
The Anomaly Detection Settings dialog box appears.
The detector tree is displayed in the left area of the dialog box; the right area is empty.
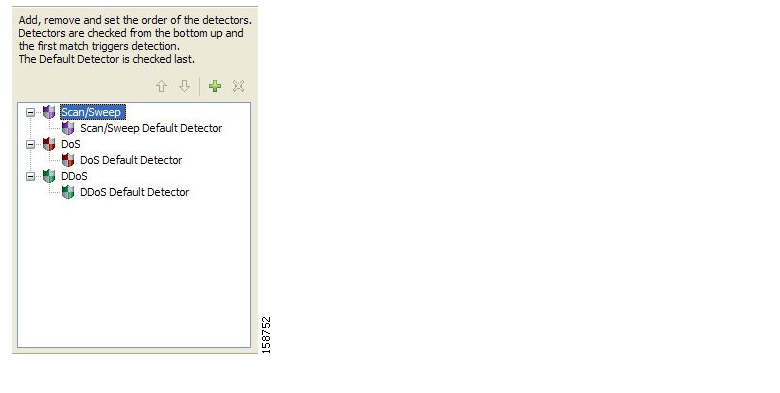
In the detector tree, select a detector.
The detector parameters are displayed in the upper right area of the dialog box.
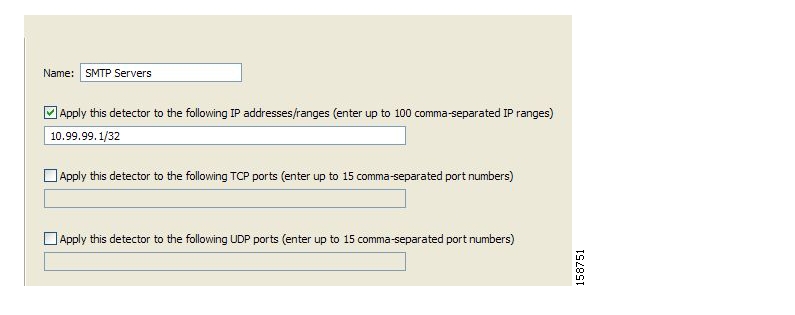
The detector’s defined anomaly types are listed in the lower right area of the dialog box, together with the value of each parameter. The following screen capture shows the default parameter values for the Scan/Sweep default detector.

Click OK.
The Anomaly Detection Settings dialog box closes.
You can add new anomaly detectors. A service configuration can contain up to 100 anomaly detectors.
You define IP address ranges and TCP and UDP ports for the new detector, and one anomaly type.
After you have defined the detector, you can add other anomaly types (see Editing Anomaly Detectors).
To add an anomaly detector:
In the Service Security Dashboard, in the Anomaly Based Detection of Malicious Traffic pane, click Configure.
The Anomaly Detection Settings dialog box appears.
In the detector tree, select a detector category.
Click
.The Anomaly Detector Creation Wizard appears, open to the Malicious Traffic Detector screen.
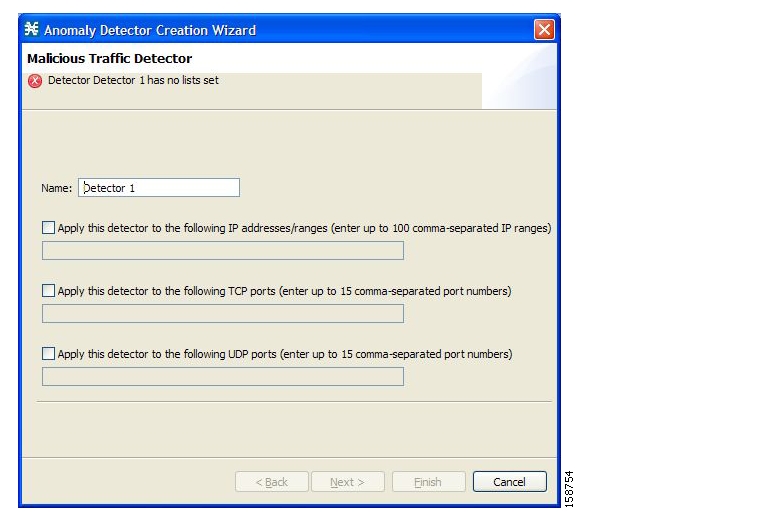
In the Name field, enter a meaningful name for the detector.
Check one or more of the check boxes to limit the scope of the detector.
The relevant fields are enabled.
Enter lists of IP addresses or ports in the relevant fields.
Click Next.
The Malicious Traffic Characteristics for a WORM attack screen of the Anomaly Detector Creation Wizard opens.

If you are defining a Scan/Sweep detector or a DoS detector, select the originating side for the anomaly type you are defining.
If you are defining a DDoS detector, select the target side for the anomaly type you are defining.
Select a transport type for the anomaly type you are defining.
Click Next.
The Anomaly Detection Thresholds screen of the Anomaly Detector Creation Wizard opens.

Do one of the following:
To use the default detector’s settings for this anomaly type, check the Use the Default Detector’s settings check box.
Enter values in the Flow Open Rate, Suspected Flows Rate, and Ratio of Suspected Flow Rate fields.
Click Next.
The Anomaly Detection Action Settings screen of the Anomaly Detector Creation Wizard opens.
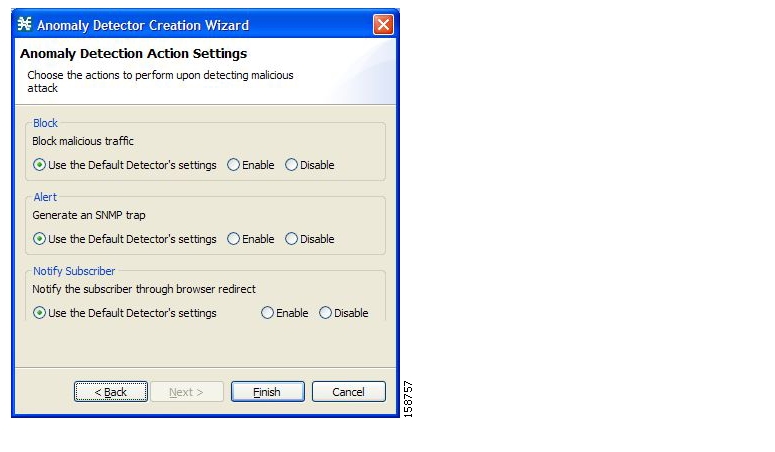
Select Block, Alert, and Notify Subscriber actions.
Click Finish.
The Anomaly Detector Creation Wizard closes.
The new detector is added to the detector tree.
You can now add additional anomaly types to the detector. (See Editing Anomaly Detectors.)
You can perform the following on a user-defined anomaly detector:
Edit detector parameters.
Edit anomaly types.
Add anomaly types.
Delete anomaly types.
Change the order of the detectors in the detector tree.
For each detector category, detectors are checked, bottom-up, in the order that they are listed in the detector tree; the default detector is checked last.
You can edit the anomaly types of the three default detectors.
Edit detector parameters:
In the Service Security Dashboard, in the Anomaly Based Detection of Malicious Traffic pane, click Configure.
The Anomaly Detection Settings dialog box appears.
In the detector tree, select a detector.
The detector parameters are displayed in the upper right area of the dialog box.
In the Name field, enter a new name for the detector.
Check or uncheck the IP address range and ports check boxes.
Enter or modify lists of IP addresses or ports in the relevant fields.
Click OK.
The Anomaly Detection Settings dialog box closes.
Your changes are saved.
To edit an anomaly type:
In the Service Security Dashboard, in the Anomaly Based Detection of Malicious Traffic pane, click Configure.
The Anomaly Detection Settings dialog box appears.
In the detector tree, select a detector.
Information about the anomaly types is displayed in the lower right area of the dialog box.
Double-click an anomaly type.
The Anomaly Detector Creation Wizard appears, open to the Anomaly Detection Thresholds screen (see Adding Anomaly Detectors).
Do one of the following:
To use the default detector’s settings for this anomaly type, check the Use the Default Detector’s settings check box.
Change the values in the Flow Open Rate, Suspected Flows Rate, and Ratio of Suspected Flow Rate fields.
Click Next.
The Anomaly Detection Action Settings screen of the Anomaly Detector Creation Wizard opens.
Change Block, Alert, and Notify Subscriber actions.
Click Finish.
The Anomaly Detector Creation Wizard closes.
The anomaly type is updated with your changes.
Repeat steps 3 to 7 (or steps 2 to 7) for other anomaly types.
Click OK.
The Anomaly Detection Settings dialog box closes.
To add an anomaly type:
In the Service Security Dashboard, in the Anomaly Based Detection of Malicious Traffic pane, click Configure.
The Anomaly Detection Settings dialog box appears.
In the detector tree, select a detector.
The anomaly types are listed in the lower right area of the dialog box.
Click
(Create New Detector Item Under Detector Items Feature).The Anomaly Detector Creation Wizard appears, open to the Malicious Traffic Characteristics for a WORM attack screen (see Adding Anomaly Detectors).
Select an origin for the anomaly type you are defining.
Select a transport type for the anomaly type you are defining.
Click Next.
The Anomaly Detection Thresholds screen of the Anomaly Detector Creation Wizard opens.
Do one of the following:
To use the default detector’s settings for this anomaly type, check the Use the Default Detector’s settings check box.
Enter values in the Flow Open Rate, Suspected Flows Rate, and Ratio of Suspected Flow Rate fields.
Click Next.
The Anomaly Detection Action Settings screen of the Anomaly Detector Creation Wizard opens.
Select Block, Alert, and Notify Subscriber actions.
Click Finish.
The Anomaly Detector Creation Wizard closes.
The new anomaly type is added to the anomaly type list.
Repeat steps 3 to 10 (or steps 2 to 10) for other anomaly types.
Click OK.
The Anomaly Detection Settings dialog box closes.
To delete an anomaly type:
In the Service Security Dashboard, in the Anomaly Based Detection of Malicious Traffic pane, click Configure.
The Anomaly Detection Settings dialog box appears.
In the detector tree, select a detector.
The anomaly types are listed in the lower right area of the dialog box.
In the anomaly type list, select an anomaly type.
Click
.The selected anomaly type is deleted from the anomaly type list.
Repeat steps 3 and 4 (or steps 2 to 4) for other anomaly types.
Click OK.
The Anomaly Detection Settings dialog box closes.
To change the order in which detectors are checked:
In the Service Security Dashboard, in the Anomaly Based Detection of Malicious Traffic pane, click Configure.
The Anomaly Detection Settings dialog box appears.
In the detector tree, select a detector.
The move up arrow, the move down arrow, or both are enabled, depending on the detectors location in the tree.
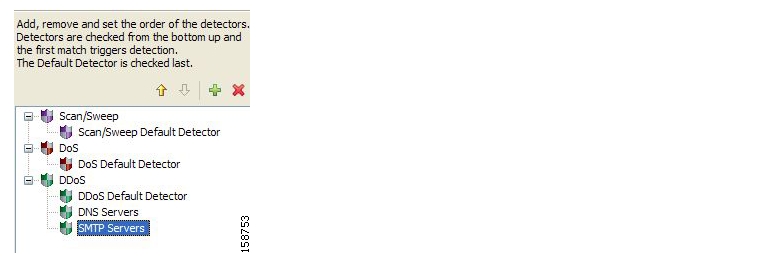
Using these navigation arrows, move the detector to its desired location.
Repeat steps 2 and 3 for other detectors.
Click OK.
The Anomaly Detection Settings dialog box closes.
Your changes are saved.
You can delete any or all user-defined detectors.
You cannot delete the three default detectors.
To delete an anomaly detector:
In the Service Security Dashboard, in the Anomaly Based Detection of Malicious Traffic pane, click Configure.
The Anomaly Detection Settings dialog box appears.
In the detector tree, select one or more user-defined detectors.
Click
.A Confirm Delete message appears.

Click OK.
The selected detectors are deleted and are no longer displayed in the detector tree.
Click OK.
The Anomaly Detection Settings dialog box closes.
The anomalous e-mail detection method monitors SMTP session rates for individual subscribers. A high rate of SMTP sessions from an individual subscriber is usually an indicator of malicious activity that involves sending e-mail (either mail-based viruses or spam-zombie activity).
This method will work only if the system is configured in subscriber-aware or anonymous subscriber mode. This allows the SCE to accurately account the number of SMTP sessions generated per subscriber.
The detection method is based on the following:
Typical broadband subscribers generate a small number of SMTP sessions (at most a single session each time they send an e-mail message).
Typical broadband subscribers normally use the ISP’s SMTP server (as configured in their mail client) as their only mail relay, and do not communicate with off-net SMTP servers.
Spam zombies create many SMTP sessions, mainly to off-net servers (the mail servers of the destined recipient of the messages).
When configuring spam detection, you select an appropriate service to monitor. By default, this is the built-in SMTP service. To improve detection sensitivity, you can create a more specific service to narrow the scope of detection. Two possible services are:
“Outbound SMTP”—SMTP sessions generated by the subscriber.
“OffNet SMTP”—SMTP sessions that are not targeted to the SMTP server of the subscriber’s ISP. Limiting the service to OffNet can avoid accounting for legitimate sessions.
Note
Prominent non-ISP e-mail providers (for example, Google and Yahoo!) now provide SMTP-based service, so OffNet is no longer a very good differentiator between legitimate and illegitimate activity. To refine the OffNet service, you must include an SMTP server list in the “OnNet SMTP” service definition; all other SMTP servers will be OffNet.
To configure spam detection settings:
In the Service Security Dashboard, in the Spam Zombies and Email Viruses Detection pane, click Configure.
The Spam Setting dialog box appears.
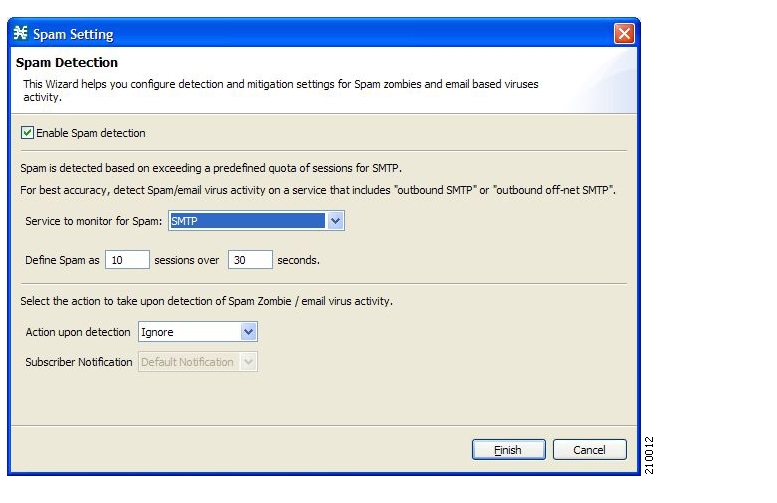
Uncheck the Enable Spam detection check box to disable spam detection.
All other fields are disabled.
Continue at step 7.
From the Service to monitor for Spam drop-down list, select a service.
NoteLeave the default value for the monitored service (SMTP), unless you have defined a more specific service, such as “Outbound SMTP” or “OffNet SMTP”.Define the threshold e-mail session rate for anomalous behavior.
From the Action upon detection drop-down list, select the action to be taken when malicious activity is detected.
Ignore
Block
Notify
Block and notify
If you selected Notify or Block and notify, the Subscriber Notification drop-down list is enabled. Select a subscriber notification.
NoteTo define an appropriate subscriber notification, see Managing Subscriber Notifications.Click Finish.
The Spam Setting dialog box closes.
Information about detected traffic anomalies is stored in the CM database. You can use this information for network trending, detection of new threats, and tracking of malicious hosts or subscribers.
A number of reports dealing with malicious traffic can be displayed in the Reporter tool:
Global reports:
Global Scan or Attack Rate
Global DoS Rate
Infected Subscribers
DoS Attacked Subscribers
Top Scanned or Attacked ports
Individual subscriber or hosts reports:
Top Scanning or Attacking hosts
Top DoS Attacked hosts
Top DoS Attacked Subscribers
Top Scanning or Attacking Subscribers
To view a service security report:
In the Service Security Dashboard, in the relevant pane, click View Report.
A Choose a report dialog box appears, displaying a tree of relevant reports.
Select a report from the report tree.
Click OK.
The Choose a report dialog box closes.
The Reporter tool opens in the Console, and displays the requested report.
For information about manipulating and saving the report, see the “Working with Reports” chapter of the Cisco Service Control Application Reporter User Guide.
Filter rules are part of service configurations. They allow you to instruct the Service Control Engine (SCE) platform to ignore some types of flow based on the flow’s Layer 3 and Layer 4 properties and to transmit the flows unchanged.
When a traffic flow enters the SCE platform, the platform checks whether a filter rule applies to this flow.
If a filter rule applies to this traffic flow, the SCE platform passes the traffic flow to its transmit queues. No RDR generation or service configuration enforcement is performed; these flows will not appear in any records generated for analysis purposes and will not be controlled by any rule belonging to the active service configuration.
It is recommended that you add filter rules for OSS protocols (such as DHCP) and routing protocols (such as BGP) that might traverse the SCE platform. These protocols usually should not be affected by policy enforcement, and their low volume makes them insignificant for reporting.
A number of filter rules are included in every new service configuration.
Note
By default, some, but not all, of the predefined filter rules are active.
You can view a list of the filter rules included in a service configuration.
The listing for each filter rule includes the name, the status, and a brief description (generated by the system) of the rule.
To see more information about a filter rule, open the Edit Filter Rule dialog box (see Editing Filter Rules).

The Add Filter Rule wizard guides you through the process of adding a filter rule.
To add a filter rule:
In the Network Traffic tab, select the Filtered Traffic node.
Click
(Add Rule) in the right (Rule) pane.The Add Filter Rule wizard appears.

Click Next.
The Transport Type and Direction screen of the Add Filter Rule wizard opens.

Select the transport type and initiating side, and click Next.
The Subscriber-Side IP Address screen of the Add Filter Rule wizard opens.
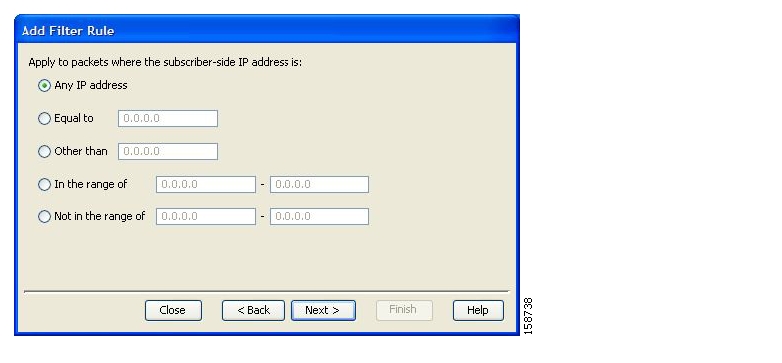
Define the subscriber-side IP address and click Next.
The Network-Side IP Address screen of the Add Filter Rule wizard opens.

Define the network-side IP address and click Next.
If the transport type selected in step 4 was not TCP or UDP, the ToS screen of the Add Filter Rule wizard opens. Go to step 9.
If the transport type selected in step 4 was TCP or UDP, the Subscriber-Side Port screen of the Add Filter Rule wizard opens.

Define the subscriber-side port and click Next.
The Network-Side Port screen of the Add Filter Rule wizard opens.

Define the network-side port and click Next.
The ToS screen of the Add Filter Rule wizard opens.

Define the ToS and click Next.
NoteAcceptable values for ToS are 0 to 63.The Action and Class-of-Service screen of the Add Filter Rule wizard opens.
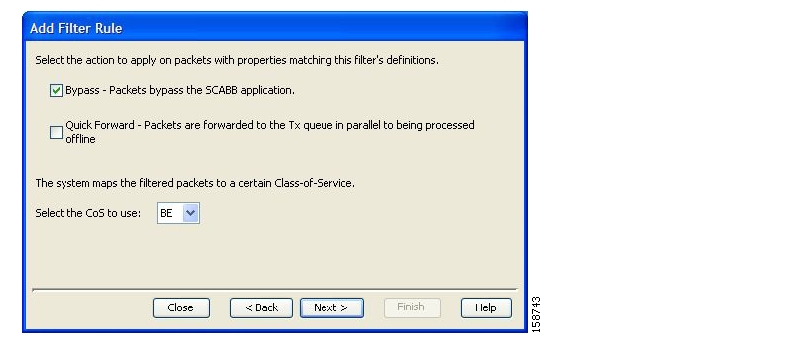
Bypass—Packets that match this filter rule are not passed to SCA BB.
Quick Forward—The SCE platform ensures low latency for packets that match this filter rule (use for delay sensitive flows). Packets are duplicated and passed to SCA BB for processing.
Bypass and Quick Forward—The SCE platform ensures low latency for packets that match this filter rule (use for delay sensitive flows). Packets are not passed to SCA BB.
Check or uncheck required actions and select a Class-of-Service value, and click Next.
The Finish screen of the Add Filter Rule wizard opens.
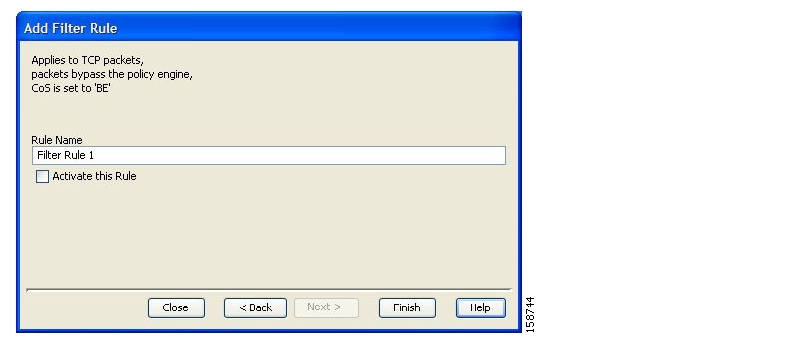
In the Rule Name field, enter a unique name for the new filter rule.
NoteYou can use the default name for the filter rule. It is recommended that you enter a meaningful name.(Optional) To activate the filter rule, check the Activate this rule check box. Traffic is filtered according to the rule only when it is activated.
Click Finish.
The Add Filter Rule wizard closes.
The filter rule is added and is displayed in the Filter Rule table.
You can view and edit the parameters of a filter rule.
To edit a filter rule:
In the Network Traffic tab, select the Filtered Traffic node.
A list of all filter rules is displayed in the right (Rule) pane.
Select a rule in the Filter Rule table.
Click
(Edit Rule).The Introduction screen of the Edit Filter Rule wizard appears.
The Edit Filter Rule Wizard is the same as the Add Filter Rule wizard.
Follow the instructions in the section Adding Filter Rules, steps 4 to 11.
Click Finish.
The filter rule is changed and relevant changes appear in the Filter Rule table.
You can delete filter rules. This is useful, for example, when you want the system to resume handling the IP addresses and their attributes according to the individual rules that were previously defined for each subscriber IP address.
To delete a filter rule:
In the Network Traffic tab, select the Filtered Traffic node.
A list of all filter rules is displayed in the right (Rule) pane.
Select a rule in the Filter Rule table.
Click
(Delete Rule).A Filter Rule Warning message appears.

Click Yes.
The filter rule is deleted and is no longer displayed in the Filter Rule table.
You can activate or deactivate filter rules at any time. Deactivating a filter rule has the same effect as deleting it, but the parameters are retained in the service configuration, and you can reactivate the filter rule at a later date.
To change the status of a filter rule:
In the Network Traffic tab, select the Filtered Traffic node.
A list of all filter rules is displayed in the right (Rule) pane.
Select a rule in the Filter Rule table.
To activate the rule, check the Active check box.
To deactivate the rule, uncheck the Active check box.
Repeat steps 3 to 5 for other rules.
The subscriber notification feature pushes web-based messages to a subscriber by redirecting the subscriber HTTP traffic to relevant web pages. These web pages contain information relevant to the subscriber, such as notifications of quota depletion. HTTP redirection starts when the subscriber notification is activated and ceases when the notification is dismissed.
The Cisco Service Control Application for Broadband (SCA BB) supports a maximum of 31 subscriber notifications, including the default notification and the Network Attack Notification.
A subscriber notification is defined by the following parameters:
Name—Each subscriber notification must have a unique name.
NoteYou cannot change the name of the Default Notification or the Network Attack Notification.Destination URL—A configurable destination URL to which the subscriber’s HTTP flows are redirected after redirection is activated. This web page usually contains the message that needs to be conveyed to the subscriber.
Notification Parameters—The query part of the destination URL, which can be optionally added upon redirection.
The format of the notification parameters to be added to the destination URL is:
?n=<notification-ID>&s=<subscriber-ID>where <notification-ID> is the ID of the notification that redirected the subscriber and <subscriber-ID> is the subscriber name.
The destination web server can use these parameters to carry a more purposeful message to the subscriber.
Dismissal method—Indicates when to dismiss, or deactivate, the notification state. May be any one of the following:
Subscriber browses to destination URL (default)—As soon as the subscriber browses to the destination URL, they are considered as notified and the notification state is dismissed.
For example, if a subscriber has exceeded their quota, the notification state is dismissed as soon as they browse to the destination URL that informs them of this fact (even though the subscriber still remains in a breach state).
The condition that activated the notification no longer holds—The dismissal of the notification state is dependent on the resolution of the condition, rather than on the subscriber.
For instance, if a subscriber has exceeded their quota, the notification state is dismissed only when they have completed the procedure to refresh their quota.
NoteThis option is not available for the Network Attack Notification. A subscriber must respond to the notification before the notification is dismissed.Subscriber browses to dismissal URL—The notification state is not dismissed until the subscriber proceeds from the destination URL to a different, final URL.
All HTTP flows are redirected until the notification is dismissed, which takes place when the subscriber accesses the dismissal URL. By default, the destination URL is also the dismissal URL, and a notification is dismissed as soon as the first redirection takes place. However, you can define a different dismissal URL, so that the subscriber must acknowledge the notification.
For instance, if a subscriber has exceeded their quota, the web page at the destination URL may ask the subscriber to press an Acknowledge button after reading the message. The acknowledge URL would be defined as the dismissal URL and would deactivate further notifications.
The dismissal URL is composed of the URL hostname and the URL path, separated by a colon, in the following format:
[*]<hostname>:<path>[*]
<hostname>may optionally be preceded by a wildcard (*), to match all hostnames with the same suffix.The path element must always start with “/”.
<path>may be followed by a wildcard, to match all paths with common prefix.
For example, the entry:
*.some-isp.net:/redirect/*
matches all the following URLs:
www.some-isp.net/redirect/index.htmlsupport.some-isp.net/redirect/info/warning.aspnoquota.some-isp.net/redirect/acknowledge.aspx?ie=UTF-8
List of Allowed URLs—A list of URLs that will not be blocked and redirected even though redirection is activated.
After redirection is activated, all HTTP flows, except flows to the destination URL and to the dismissal URL, are blocked and redirected to the destination URL. However, subscribers can be permitted to access an additional set of URLs. This is useful, for example, to give subscribers access to additional support information.
Allowed URLs have the same format as the dismissal URL.
These parameters are defined when you add a new subscriber notification (see Adding Subscriber Notifications). You can modify them at any time (see Editing Subscriber Notifications).
To view subscriber notifications:
From the Console main menu, choose Configuration > Subscriber Notifications.
The Subscriber Notifications Settings dialog box appears.
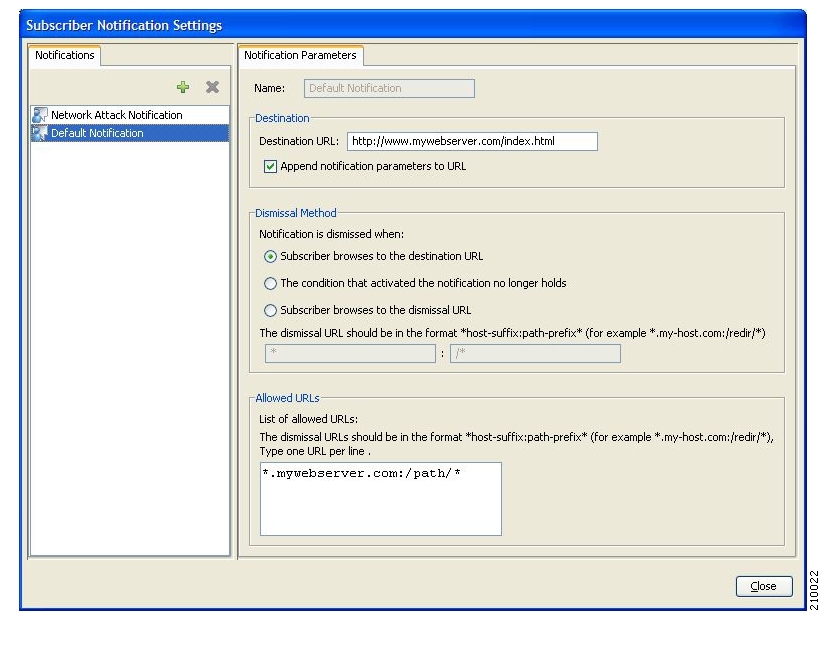
The Notifications tab displays a list of all subscriber notifications.
Click a subscriber notification in the list to display its parameters.
The parameters of the subscriber notification are displayed in the Notification Parameters tab.
Click Close.
The Subscriber Notifications Settings dialog box closes.
You can add up to 29 subscriber notifications to a service configuration.
To add a subscriber notification:
From the Console main menu, choose Configuration > Subscriber Notifications.
The Subscriber Notifications Settings dialog box appears.
Click
(Add).In the Name field, enter a unique name for the new subscriber notification.
NoteYou can use the default name for the subscriber notification. It is recommended that you enter a meaningful nameIn the Destination URL field, enter the destination URL.
(Optional) If notification parameters will be appended to the destination URL, check the Append notification parameters to URL check box.
Select the dismissal method by clicking a Dismissal Method radio button:
Subscriber browses to the destination URL
The condition that activated the notification no longer holds
Subscriber browses to the dismissal URL
If you selected Subscriber browses to the dismissal URL in step 6, enter the dismissal URL host-suffix and path-prefix in the fields provided.
Enter any allowed URLs, one per line, in the Allowed URLs text box.
Click Close.
The Subscriber Notifications Settings dialog box closes.
Note
Creating a subscriber notification does not activate the subscriber notification feature. After the subscriber notification is defined, it must be activated for a particular package. (See Editing Breach-Handling Parameters for a Rule.)
You can modify notification parameters at any time.
To edit a subscriber notification:
From the Console main menu, choose Configuration > Subscriber Notifications.
The Subscriber Notifications Settings dialog box appears.
Click a subscriber notification in the Notifications tab to display its parameters.
Edit the parameters of the subscriber notification in the Notification Parameters tab.
Click Close.
The Subscriber Notifications Settings dialog box closes.
You can delete subscriber notifications at any time.
You cannot delete the default notification or the Network Attack Notification.
To delete a subscriber notification:
From the Console main menu, choose Configuration > Subscriber Notifications.
The Subscriber Notifications Settings dialog box appears.
Click a subscriber notification in the Notifications tab.
Click
(Delete).A Subscriber Notification Confirmation message appears.
Click Yes.
If the specified subscriber notification is being used by a rule, a Subscriber Notification Deletion Error message is displayed.
NoteThe subscriber notification cannot be deleted until you unassign it or deactivate it in all service rules. (See Editing Breach-Handling Parameters for a Rule.)
The selected subscriber notification is deleted.
Click Close.
The Subscriber Notifications Settings dialog box closes.
Subscriber notification informs a subscriber in real-time about current attacks involving IP addresses mapped to that subscriber. (Enabling these notifications is described in The Service Security Dashboard.) SCA BB notifies the subscriber about the attack by redirecting HTTP flows originating from the subscriber to a server that supplies information about the attack.
One subscriber notification, Network Attack Notification, is dedicated to providing these notifications; it cannot be deleted. A Network Attack Notification is not dismissed at the end of an attack; subscribers must respond to it.
To allow redirection when blocking traffic, the system is configured to leave open one specified TCP port (by default, port 80). See Managing Advanced Service Configuration Options.
Caution
In earlier versions of SCA BB, configuring network attack notifications was performed using CLI commands. CLI commands should no longer be used for this purpose.
When a network attack is detected, HTTP flows of the subscriber are redirected to a configurable destination URL. This web page should display the warning that needs to be conveyed to the subscriber.
Optionally, the destination URL can include a query part containing notification parameters. The destination web server can use these parameters to create a more specific warning to the subscriber.
The query part of the URL has the following format:
?ip=<ip>&side=<side>&dir=<dir>&prot=<protocol>&no=<open-flows>&nd=<suspected-flows>&to=<open-flows-threshold>&td=<suspected-flows-threshold>&ac=<action>&nh=<handled-flows>
The meaning of each field in the tail is described in the following table:
Table 10.1. Description Tail Fields
|
Field |
Description |
Possible Values |
|---|---|---|
|
ip |
Detected IP address |
|
|
side |
|
|
|
dir |
|
|
|
protocol |
|
|
|
open-flows |
Number of open flows |
|
|
suspected flows |
Number of attack-suspected flows |
|
|
open-flows-threshold |
Threshold for open flows |
|
|
suspected-flows-threshold |
Threshold for attack-suspected flows |
|
|
action |
|
|
|
handled-flows |
Number of flows handled since the attack began (Non-zero only during and at the end of an attack) |
|
Example of URL with description tail:
http://www.someisp.net/warning?ip=80.178.113.222&side=s&dir=s&prot=TCP&no=34&nd=4&to=34&td=10&ac=B&nh=100The Console allows you to determine various system parameters that control:
The operational state of the system
The redirection URLs for protocols that support redirection
BW prioritization mode (see Setting BW Management Prioritization Mode)
Advanced service configuration options
The Console allows you to select the operational mode of the system. This feature defines how the system handles network traffic.
Note
Each rule has its own operational mode (state). If this differs from the system mode, the “lower” of the two modes is used. For example, if a rule is enabled, but the system mode is report-only, the rule will only generate RDRs.
The three System Modes are:
Full Functionality—The system enforces active rules on the network traffic and performs reporting functions (that is, generates RDRs).
Report Only—The system generates RDRs only. No active rule enforcement is performed on the network traffic.
Transparent—The system does not generate RDRs and does not enforce active rules on the network traffic.
To configure the system mode parameter:
From the Console main menu, choose Configuration > System Settings.
The System Settings dialog box appears.

Select one of the operational mode buttons:
Transparent
Report only
Full functionality
Click OK.
The System Settings dialog box closes.
The new System Mode setting is saved.
The rules for a package may deny access to selected protocols. When a subscriber to the package tries to access a protocol that is blocked, the traffic flow can be redirected to a server where a posted web page explains the reason for the redirection (for example, a “Silver” subscriber trying to access a service that is available only to “Gold” subscribers). This web page can offer subscribers the opportunity to upgrade their packages. You configure which redirection set to use when defining rules (see Defining Per-Flow Actions for a Rule).
The Console Redirection feature supports only three protocols:
HTTP Browsing
HTTP Streaming
RTSP Streaming
Each redirection set contains one redirection option for each of these three protocols. The system provides a default redirection set, which cannot be deleted. You can add up to 49 additional sets.
Each redirection URL includes the URL specified name, the Subscriber ID, and the Service ID in the following format:
<URL>?n=<subscriber-ID>&s=<service-ID>
You can add up to 49 redirection sets.
To add a redirection set:
From the Console main menu, choose Configuration > System Settings.
The System Settings dialog box appears.
Click the Redirection URLs tab.
The Redirection URLs tab opens.

Click
(Add).A new redirection set containing the default redirection URLs is added to the redirection set list.
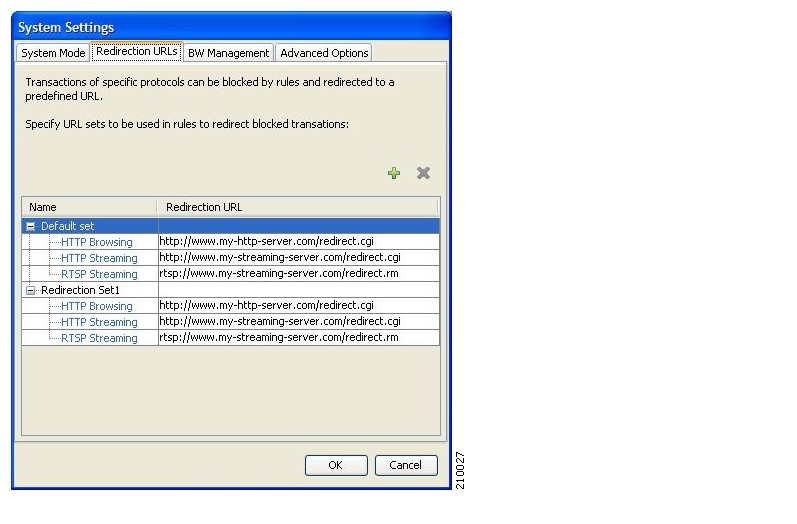
In the Name field, enter a unique name for the new redirection set.
NoteYou can use the default name for the redirection set, but it is recommended that you enter a meaningful name.Enter new values in the Redirection URL cells of the new redirection set.
Click OK.
The System Settings dialog box closes.
The Redirection group is added to the redirection set list.
To edit an existing set of Redirection URLs:
From the Console main menu, choose Configuration > System Settings.
The System Settings dialog box appears.
Click the Redirection URLs tab.
The Redirection URLs tab opens.
Click a URL in the Redirection URL column.
Enter a new URL.
Click OK.
The System Settings dialog box closes.
The Redirection settings are saved.
To delete a redirection set:
From the Console main menu, choose Configuration > System Settings.
The System Settings dialog box appears.
Click the Redirection URLs tab.
The Redirection URLs tab opens.
Click the name of a redirection set.
Click
(Delete).A Redirection Warning message appears.

Click Yes.
The redirection set is deleted.
Click OK.
The System Settings dialog box closes.
Advanced service configuration options control the more sophisticated and less frequently changed attributes of the system. It is recommended that you do not change these options.
The following table lists these options:
Table 10.2. Advanced Service Configuration Properties
|
Property |
Default Value |
Description |
|---|---|---|
|
Classification | ||
|
Classification based on recent classification history enabled |
True |
Recent classification history is a heuristic mechanism used to classify flows according to previous traffic classification decisions. This mechanism improves the classification of Warez, Skype, and Winny2 flows. |
|
Guruguru detailed inspection mode enabled |
False |
The Guruguru protocol is used by the Guruguru file-sharing application that is popular in Japan. SCA BB provides two inspection modes for classification of this protocol:
|
|
Kuro detailed inspection mode enabled |
False |
The Kuro protocol is used by the Kuro file-sharing application that is popular in Japan. SCA BB provides two inspection modes for classification of this protocol:
|
|
Soribada detailed inspection mode enabled |
False |
The Soribada protocol is used by the Soribada file-sharing application that is popular in Japan. SCA BB provides two inspection modes for classification of this protocol:
|
|
TCP destination port signatures |
1720:H323 |
TCP destination port numbers for signatures that require a port hint for correct classification. Valid values are comma-separated items, each item in the form <port-number>:<signature-name>. Applicable signature names are: H323, Radius Access, Radius Accounting, and DHCP. |
|
UDP destination port signatures |
67:DHCP, 1812:Radius Access, 1645:Radius Access, 1813:Radius Accounting, 1646:Radius Accounting |
UDP destination port numbers for signatures that require a port hint for correct classification. Valid values are comma-separated items, each item in the form <port-number>:<signature-name>. Applicable signature names are: H323, Radius Access, Radius Accounting, and DHCP. |
|
UDP ports for which flow should be opened on first packet |
5060, 5061, 67, 69, 1812, 1813, 1645, 1646, 2427, 2727, 9201, 9200, 123, 1900 |
Enhanced flow-open mode is disabled on the specified UDP ports, to allow classification according to the flow’s first packet. |
|
UDP source port signatures |
1812:Radius Access, 1645:Radius Access, 1813:Radius Accounting, 1646:Radius Accounting |
UDP source port numbers for signatures that require a port hint for correct classification. Valid values are comma-separated items, each item in the form <port-number>:<signature-name>. Applicable signature names are: H323, Radius Access, Radius Accounting, and DHCP. |
|
V-Share detailed inspection mode enabled |
False |
The V-Share protocol is used by the V-Share file-sharing application that is popular in Japan. SCA BB provides two inspection modes for classification of this protocol:
|
|
Winny detailed inspection mode enabled |
False |
The Winny P2P protocol is used by the Winny file-sharing application that is popular in Japan. SCA BB provides two inspection modes for classification of this protocol:
|
|
Generic Upload/Download | ||
|
Accelerated packet skip used in detection of behavioral patterns |
True |
Specifies whether to skip the first packet by waiting for the next packet or by going into bypass mode. |
|
Detection of generic upload/download based on behavioral patterns enabled |
False |
Specifies whether to use the generic download search. |
|
Minimal average size of the sampled TCP packets (bytes) |
1200 |
The minimum size of a TCP packet allowed when looking for generic download flow. |
|
Minimal average size of the sampled UDP packets (bytes) |
1200 |
The minimum size of a UDP packet allowed when looking for generic download flow. |
|
Minimal up:down volume ratio of the sampled TCP packets (10:N) |
500 |
The minimum upload:download ratio allowed (after sampling all packets) for TCP flows. |
|
Minimal up:down volume ratio of the sampled UDP packets (10:N) |
500 |
The minimum upload:download ratio allowed (after sampling all packets) for UDP flows. |
|
Malicious Traffic | ||
|
Malicious Traffic RDRs enabled |
True |
Specifies whether to generate Malicious Traffic RDRs. |
|
Number of seconds between Malicious Traffic RDRs on the same attack |
60 |
A Malicious Traffic RDR is generated when an attack is detected. Malicious Traffic RDRs are then generated periodically, at user-configured intervals, for the duration of the attack. |
|
TCP port that should remain open for Subscriber Notification |
80 |
You can choose to block flows that are part of any detected network attack, but this may hinder subscriber notification of the attack. The specified TCP port will not be blocked to allow notification of the attack to be sent to the subscriber. |
|
Policy Check | ||
|
Ongoing policy check mode enabled |
True |
Specifies whether policy changes affect flows that are already open. |
|
Time to bypass between policy checks |
30 |
Maximum time (in seconds) that may pass before policy changes affect flows that are already open. |
|
Quota Management | ||
|
Grace period before first breach |
2 |
The time (in seconds) to wait after a quota limit is breached before the breach action is performed. Policy servers should use this period to provision quota to a subscriber that just logged in. |
|
Length of the time frame for quota replenish scatter (minutes) |
0 |
The size of the window across which to randomly scatter the periodic quota replenishment. |
|
Time to bypass between policy checks for quota limited flows |
30 |
Maximum time (in seconds) that may pass before a quota breach affects flows that are already open. |
|
Volume to bypass between policy checks for quota limited flows |
0 |
Maximum flow volume (in bytes) that may pass before a quota breach affects flows that are already open. A value of zero means that unlimited volume may pass. |
|
Reporting | ||
|
Media Flow RDRs enabled |
True |
Specifies whether to generate Media Flow RDRs. |
|
Reporting of P2P file extensions enabled |
False |
For some P2P applications, SCA BB can extract file extensions of P2P file downloads and report them in Transaction RDRs. This information is used by the SCA Reporter to produce a new Top P2P File Extensions report. |
|
Subscriber Accounting RDR enabled |
False |
Specifies whether to generate Subscriber Accounting RDRs. The Subscriber Accounting RDR is used for SM-ISG integration. For more information, see the ISG documentation in the “Managing the SCMP” chapter of the Cisco Service Control Engine (SCE) Software Configuration Guide. |
To edit the advanced service configuration options:
From the Console main menu, choose Configuration > System Settings.
The System Settings dialog box appears.
Click the Advanced Options tab.
The Advanced Options tab opens.

Click Advanced Service Configuration Options.
The Advanced Service Configuration Options dialog box opens.
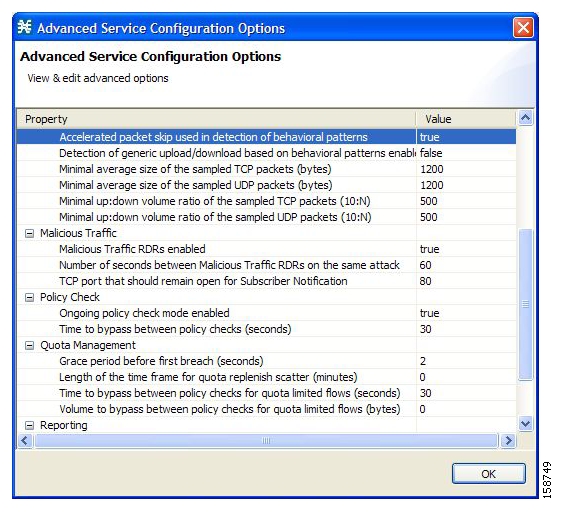
Make your changes to the configuration options.
Click OK.
The Advanced Service Configuration Options dialog box closes.
The changes to the advanced options are saved.
Click OK.
The System Settings dialog box closes.
Traffic forwarding to Value Added Services (VAS) servers allows you to use an external expert system (VAS server) for additional traffic processing, such as intrusion detection and content filtering to subscribers. After processing, flows are sent back to the SCE platform, which then sends them to their original destinations.
The flows to be forwarded are selected based on the subscriber package and the flow type (IP protocol type and destination port number).
VAS traffic forwarding has the following limitations:
Only the SCE 2000 4xGBE platform supports VAS traffic forwarding.
A single SCE platform can support up to eight VAS servers.
A service configuration can contain up to 64 traffic-forwarding tables.
A traffic-forwarding table can contain up to 64 table parameters.
Note
Because of the complexity of the VAS traffic-forwarding feature, VAS flows are not subject to global bandwidth control.
To use VAS traffic forwarding, you must also configure VAS services on the SCE platform. Additional information is available in the “Value Added Services (VAS) Traffic Forwarding” chapter of the Cisco Service Control Engine (SCE) Software Configuration Guide.
By default, VAS traffic forwarding is disabled. You can enable it at any time.
To enable VAS traffic forwarding:
From the Console main menu, choose Configuration > VAS Settings.
The VAS Settings dialog box appears.

Check the Enable Traffic Forwarding to VAS Servers check box.
NoteThe VAS Traffic Forwarding Table drop-down list in the Advanced tab of the Package Settings dialog box is enabled (see Setting Advanced Package Options).Click Close.
The VAS Settings dialog box closes.
An SCE platform can forward flows to up to eight different VAS server groups. By default, the eight server groups are named “Server Group n”, where n takes a value from 0 to 7. Give the server groups meaningful names; the names you give will appear in the drop-down list in the Advanced tab of the Package Settings dialog box (see Setting Advanced Package Options) and in the Server Group field of the table parameters added to each traffic-forwarding table (see Managing VAS Table Parameters).
To rename VAS server groups:
From the Console main menu, choose Configuration > VAS Settings.
The VAS Settings dialog box appears.
In the table in the Server Groups Table area, double-click in a cell containing a server group name.
Enter a meaningful name in the cell.
Repeat steps 2 and 3 for other server groups you wish to rename.
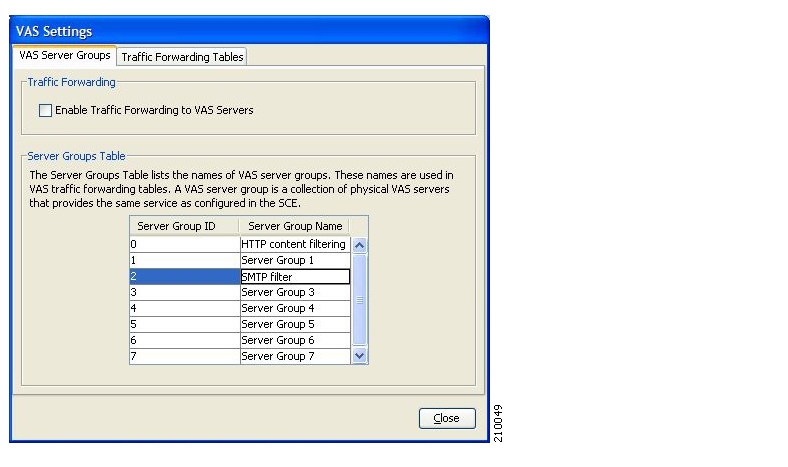
Click Close.
The VAS Settings dialog box closes.
SCA BB decides whether a flow passing through an SCE platform should be forwarded to a VAS server group based on a traffic-forwarding table. Each entry (table parameter) in a traffic-forwarding table defines to which VAS server group the specified flows should be forwarded.
To view VAS traffic-forwarding tables:
From the Console main menu, choose Configuration > VAS Settings.
The VAS Settings dialog box appears.
Click the Traffic Forwarding Tables tab.
The Traffic Forwarding Tables tab opens.
A list of all traffic-forwarding tables is displayed in the Traffic Forwarding Tables area.
Click a table in the list of traffic-forwarding tables to display its table parameters.
A list of all table parameters defined for this traffic-forwarding table opens in the Table Parameters tab.
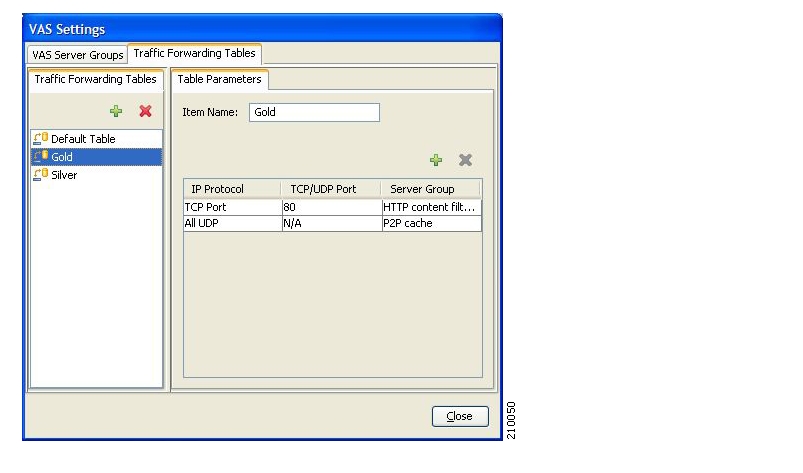
Click Close.
The VAS Settings dialog box closes.
You can delete all user-created traffic-forwarding tables. The default traffic-forwarding table cannot be deleted.
Note
A traffic-forwarding table cannot be deleted while it is associated with a package.
To delete a VAS traffic-forwarding table:
From the Console main menu, choose Configuration > VAS Settings.
The VAS Settings dialog box opens.
Click the Traffic Forwarding Tables tab.
The Traffic Forwarding Tables tab opens.
From the list of traffic-forwarding tables in the Traffic Forwarding Tables area, select a table.
Click
(Delete).A VAS Warning message appears.
Click Yes.
The selected table is deleted and is no longer displayed in the list of traffic-forwarding tables.
Click Close.
The VAS Settings dialog box closes.
A default traffic-forwarding table is included in the service configuration. You can add up to 63 more traffic-forwarding tables, and then assign different traffic-forwarding tables to different packages.
To add a VAS traffic-forwarding table:
From the Console main menu, choose Configuration > VAS Settings.
The VAS Settings dialog box appears.
Click the Traffic Forwarding Tables tab.
The Traffic Forwarding Tables tab opens.
In the Traffic Forwarding Tables area, click
(Add).A new table named Table (n), where n is a value between 1 and 63, is added to the list of traffic-forwarding tables in the Traffic Forwarding Tables area.
The table name is also displayed in the Item Name box in the Table Parameters tab.
In the Item Name field, enter a unique and relevant name for the traffic-forwarding table.
You can now add table parameters to the new traffic-forwarding table, see Adding VAS Table Parameters.
A table parameter is an IP protocol type, an associated TCP/UDP port (where applicable), and a VAS server group or a range of IP addresses.
A traffic-forwarding table is a collection of related table parameters.
A traffic-forwarding table can contain up to 64 table parameters.
You can add up to 64 table parameters to a traffic-forwarding table.
To add a VAS traffic-forwarding table:
From the Console main menu, choose Configuration > VAS Settings.
The VAS Settings dialog box appears.
Click the Traffic Forwarding Tables tab.
The Traffic Forwarding Tables tab opens.
From the list of traffic-forwarding tables in the Traffic Forwarding Tables area, select a table.
In the Table Parameters tab, click
(Add).A new table parameter is added to the list of table parameters in the Table Parameters tab.
NoteEach new table parameter has the following default values:Note IP Protocol = TCP PortNote TCP/UDP Port = 80Note Server Group = Server Group 0You can now edit the new table parameter, as described in the following section.
Click Close.
The VAS Settings dialog box closes.
To edit a VAS traffic-forwarding table:
From the Console main menu, choose Configuration > VAS Settings.
The VAS Settings dialog box appears.
Click the Traffic Forwarding Tables tab.
The Traffic Forwarding Tables tab opens.
From the list of traffic-forwarding tables in the Traffic Forwarding Tables area, select a table.
In the table in the Table Parameters tab:
Click in a cell in the IP Protocol column, and, from the drop-down list that opens, select an IP protocol type.
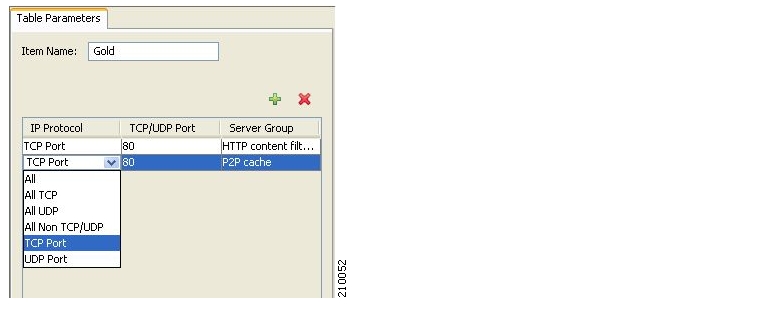
If you select All, All TCP, All UDP, or All Non TCP/UDP, “N/A” will appear in the TCP/UDP Port cell when you move to another cell in the table.
If you selected TCP Port or UDP Port, double-click in the cell in the TCP/UDP Port column, and enter the port number.
NoteYou cannot enter a range of ports in the TCP/UDP Port cell; you must add a separate table parameter for each port.Click in the cell in the Server Group column, and, from the drop-down list that opens, select a server group.

Click Close.
The VAS Settings dialog box closes.
To delete a VAS table parameter:
From the Console main menu, choose Configuration > VAS Settings.
The VAS Settings dialog box appears.
Click the Traffic Forwarding Tables tab.
The Traffic Forwarding Tables tab opens.
From the list of traffic-forwarding tables in the Traffic Forwarding Tables area, select a table.
From the list of table parameters in the Table Parameters tab, select a table parameter.
Click
(Delete).The selected table parameter is deleted and is no longer displayed in the list of table parameters.
Click Close.
The VAS Settings dialog box closes.
This chapter describes how to use the Subscriber Manager (SM) GUI tool to configure subscribers in the Cisco Service Control Management Suite (SCMS) Subscriber Manager (SM) database.
The SM GUI tool is especially useful when the SCMS-SM holds a static list of subscribers. It is not applicable when the Cisco Service Control Application for Broadband (SCA BB) is operating in subscriberless mode or in anonymous subscriber mode (see Subscribers and Subscriber Modes).
The SM GUI tool allows you to manage subscribers on an SCMS-SM. The SCMS-SM functions as middleware software that bridges between the OSS and the Service Control Engine (SCE) platforms. SCE platforms use the subscriber information to provide subscriber-aware functionality, per-subscriber reporting, and policy enforcement. Subscriber information is stored in the SCMS-SM database and can be distributed between multiple platforms according to actual subscriber placement.
You can use the SM GUI tool to import and export subscriber files, and to perform operations on individual subscribers, such as adding a new subscriber, editing parameters of an existing subscriber, and deleting a subscriber.
Note
To access an SCMS-SM from the SM GUI tool, you must first add the SCMS-SM to the Site Manager tree in the Network Navigator tool (see Adding SM Devices to a Site).
The SM GUI tool provides only a subset of the functionality that is provided by the SM Command-Line Utility. For more information about the SCMS-SM, see the Cisco Service Control Management Suite Subscriber Manager User Guide.
You can connect to an SCMS-SM:
From the Network Navigator tool
From anywhere else in the Console
From the Subscriber Manager GUI tool
Note
The SM GUI tool performs authentication on the SCMS-SM by opening a PRPC connection to port 14374 and attempting to log in using the username and password that you entered in the Password Management dialog box. If a PRPC server with this user is not running on the SCMS-SM, authentication will fail.
To connect to an SCMS-SM from the Network Navigator:
In the Site Manager tree in the Network Navigator tab, right-click an SM device.
A popup menu appears.
From the menu, select Manage Subscribers.
A Password Management dialog box appears.
Enter the appropriate password. (For more information, refer to Password Management.)
Click Connecting.
The Password Management dialog box closes.
A Connecting to progress bar appears.
The system connects to the SCMS-SM.
 (Import subscribers from CSV file),
  (Export subscribers to CSV file), and
  (Disconnect from SM) are enabled.
To connect to an SCMS-SM from the Console:
(If you are already in the SM GUI tool, start at step 3.)
From the Console main menu, choose Tools > Subscriber Manager.
The SM GUI tool opens.
A Subscriber Manager is not connected message appears.
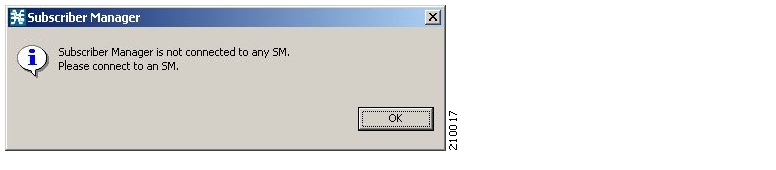
Click OK.
The Subscriber Manager is not connected message closes.
In the SM GUI toolbar, click
 (Connect to an SM).
If more than one SCMS-SM device is configured in the Network Navigator, the Choose SM Devices dialog box appears.

Select a device and click OK.
A Password Management dialog box appears.
Enter the appropriate password. (For more information, refer to Password Management.)
Click Connecting.
The Password Management dialog box closes.
A Connecting to progress bar appears.
The system connects to the SCMS-SM.
(Import subscribers from CSV file), (Export subscribers to CSV file), and (Disconnect from SM) are enabled.
To disconnect from the current SCMS-SM:
In the SM GUI toolbar, click
(Disconnect from SM).The Console disconnects from the SCMS-SM, but the SM GUI tool remains open.
(Import subscribers from CSV file), (Export subscribers to CSV file), and (Disconnect from SM) are dimmed.The subscriber list is empty.
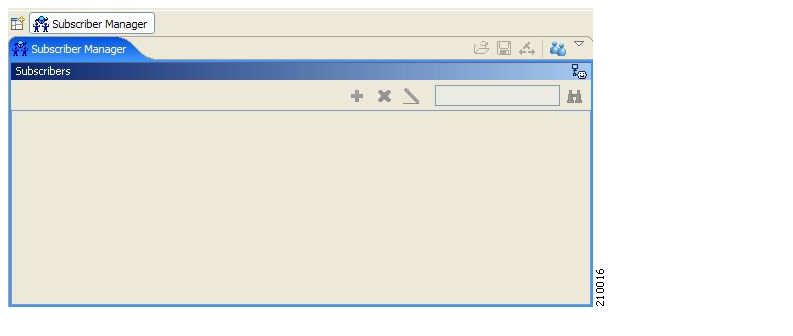
Because of the large number of subscribers that must be introduced into the system, it is not feasible to enter subscriber information manually. Subscriber information is usually generated by a Radius server (or some similar source) and imported into the SM GUI tool.
You can also export updated subscriber information to a CSV file.
The format of subscriber CSV files is described in the “CSV File Formats” chapter of the Cisco Service Control Application for Broadband Reference Guide.
You can import subscriber data that was exported to a CSV file into the SM GUI tool.
To import subscriber information from a CSV file:
In the SM GUI toolbar, click
(Import subscribers from CSV file).An Import from File dialog box appears.
Browse to the file that is to be imported, and click Open.
An Import Warning message appears.

Click Yes.
The Import from File dialog box closes.
The selected file is imported into the SM GUI tool; the imported subscribers are listed in the subscriber list.
You can export subscriber information to a CSV file (for example, when data in the SCMS-SM database is updated).
To export subscriber information to a CSV file:
Select the subscribers whose data you want to save (see Selecting Subscribers).
In the SM toolbar, click
(Export subscribers to CSV file).An Export to File dialog box appears.
Browse to the folder in which you want to save the exported file.
In the File name field, enter a file name.
Click Save.
The Export to File dialog box closes.
The selected subscribers are saved to the CSV file.
After importing subscribers into the system, you can maintain and update the database.
You can perform the following operations:
Add subscribers.
Edit information for existing subscribers.
Delete subscribers.
All subscribers currently introduced into SCA BB are displayed in a list in the SM GUI tool. Use this list to manage individual subscribers or groups of subscribers. Use the Find function to display a subset of the subscribers (see Finding Subscribers).
The subscriber list has the following columns:
Subscriber ID—Name of the subscriber in the system.
Subscriber Domain—Domain to which the subscriber is assigned. The names of the SCE platforms that belong to each domain appear in square brackets.
Network Mappings—IP address, range of IP addresses, or VLAN tag mapped to the subscriber.
Package—Package ID assigned to the subscriber. The name of the package is shown in square brackets.
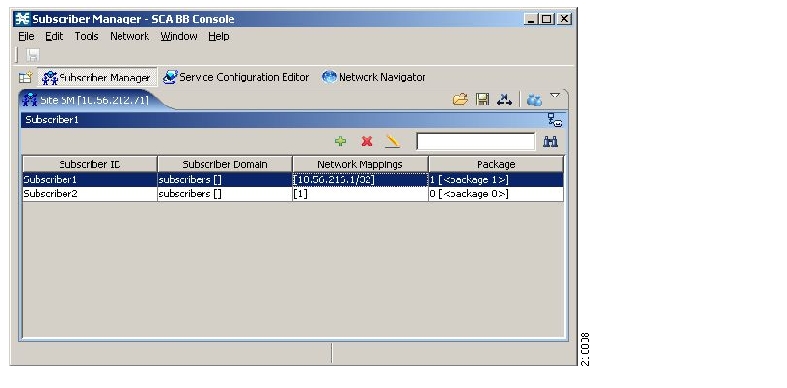
For ease of use, the SM GUI tool incorporates two standard features:
Find—Search for a specific subscriber.
Multiple Select—Select a range of subscribers or a number of individual subscribers.
Use this feature to find a specific subscriber or a group of subscribers according to a subscriber ID prefix. This is useful for editing the parameters of either a specific subscriber or a group of subscribers (see Editing Subscribers).

 (
(You can edit, export, or delete a group of subscribers at one time by selecting subscribers displayed in the subscriber list. The group may be either of the following:
A range of contiguous subscribers
A number of noncontiguous subscribers
To select a range of subscribers:
Select the first subscriber in the range.
Press the Shift key and click the last subscriber in the range.
All subscribers in the range are selected.
You can combine this function with the search function; search to display specific subscribers and then select the entire range.
You can add additional individual subscribers to the SCMS-SM.
To add large number of subscribers, export their information from a Radius (or DHCP) server to a CSV file, and then import the CSV file (see Working with Subscriber CSV Files).
To add a subscriber:
In the SM toolbar, click
(Add Subscriber).The Add A New Subscriber dialog box appears.

In the Subscriber ID field, enter text that identifies the subscriber.
From the Subscriber Domain drop-down list, select the appropriate domain for the new subscriber.
From the Subscriber Package drop-down list, select a package to assign to this subscriber.
The contents of the list depend on the selected subscriber domain.
To activate subscriber real-time monitoring, check the Activate Subscriber Real-time Monitoring check box. This causes the SCE application to generate Real-Time Subscriber Usage RDRs for this subscriber. For more information, see Managing Real-Time Subscriber Usage RDRs.
If you are not going to define network mappings for this subscriber, continue at step 11.
Click the Network Mappings tab.
The Network Mappings tab opens.
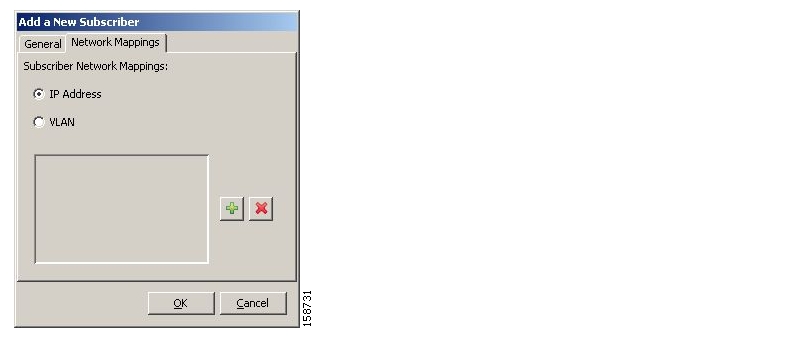
The system supports either IP addresses or VLAN tags as network identification for subscribers.
Select one of the Subscriber Network Mappings radio buttons:
IP Address
VLAN
Click
(Add) to add a network mapping of the type selected in the previous step.A new network-mapping entry is added to the subscriber network mappings list, displaying a default value.
Edit the network-mapping entry.
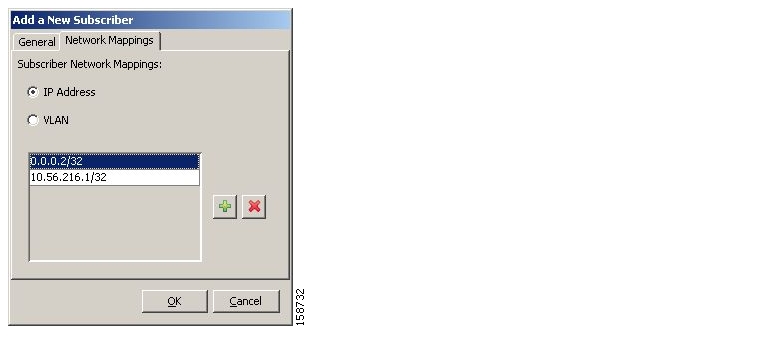
Repeat steps 8 and 9 for other network mappings.
Click OK.
The Add A New Subscriber dialog box closes.
The new subscriber is added to the database, and to the subscriber list displayed in the SM GUI tool.
You can edit parameters of single or multiple subscribers.
To edit subscriber information:
Find and select a subscriber.
In the SM toolbar, click
(Edit Subscriber).The Edit Subscriber dialog box appears.
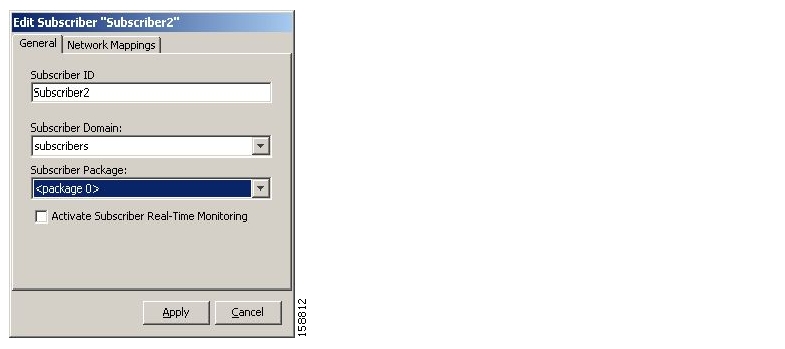
Modify subscriber details:
Edit the entry in the Subscriber ID field.
From the Subscriber Domain drop-down list, select a subscriber domain.
From the Subscriber Package drop-down list, select a package to assign to this subscriber.
The contents of the list depend on the selected subscriber domain.
Check or uncheck the Activate Subscriber Real-time Monitoring check box.
If you are not editing the network mappings for this subscriber, continue at step 6.
Click the Network Mappings tab.
The Network Mappings tab opens.
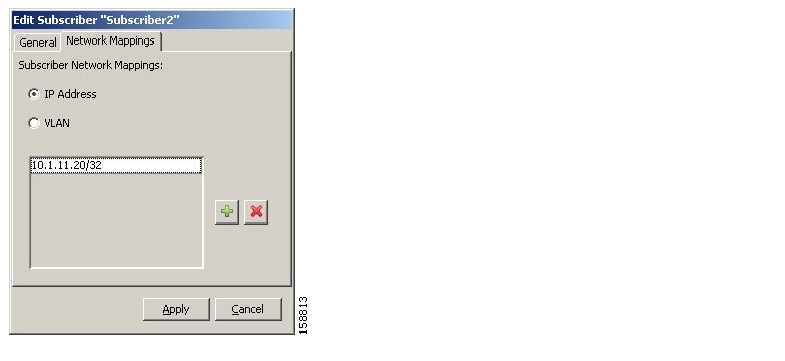
Modify subscriber network mappings:
Select one of the Subscriber Network Mappings radio buttons:
IP Address
VLAN
To add a new network mapping to the list, click
(Add), and edit the network-mapping field that is added to the Subscriber Network Mappings list.To delete a network mapping from the list, select an entry in the subscriber network mappings list and click
(Delete).
Click Apply.
The Edit Subscriber dialog box closes.
The modified subscriber information is saved to the database and displayed in the subscriber list in the SM GUI tool.
You can assign the same package or domain to many subscribers at one time.
To edit details for a group of subscribers:
Select a group of subscribers to modify (see Selecting Subscribers).
In the SM toolbar, click
(Edit).The Edit Multiple Subscribers dialog box appears.
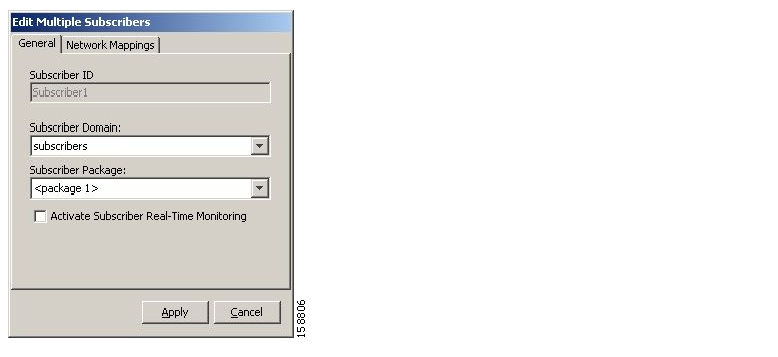
The Subscriber ID field is dimmed and the Network Mappings tab is disabled.
Modify fields in the General tab:
From the Subscriber Domain drop-down list, select a subscriber domain.
From the Subscriber Package drop-down list, select a package to assign to this subscriber.
The contents of the list depend on the selected subscriber domain.
Check or uncheck the Activate Subscriber Real-time Monitoring check box.
Click Apply.
The Edit multiple Subscribers dialog box closes.
The modified subscriber information is saved to the database and displayed in the subscriber list in the SM GUI tool.
You can delete subscribers from the database.
To delete a subscriber from the database:
Select a single subscriber or a group of subscribers (see Selecting Subscribers).
In the SM toolbar, click
(Delete Subscriber).The system asks for confirmation before deleting the selected subscribers:

Click Yes to confirm.
The selected subscribers are deleted from the database and removed from the subscriber list displayed in the SM GUI tool.
The Signature Editor tool allows you to create and modify Dynamic Signature Script (DSS) files that can add and modify protocols and protocol signatures in the Cisco Service Control Application for Broadband (SCA BB), based on your knowledge of new network protocols that are not yet supported by SCA BB.
Installing new signatures to an active service configuration is described in Installing Protocol Packs.
Working with signatures in the Service Configuration Editor is described in Managing Protocol Signatures.
Using servconf, the Server Configuration Utility, to apply signatures is described in The SCA BB Service Configuration Utility.
The DSS file components, and the creation and editing of DSS files, are explained in the following sections.
The DSS file components are displayed in the Script pane of the Signature Editor, in a tree structure. By selecting the appropriate node of the DSS component tree, you can define the properties associated with the node in the Property pane.
The DSS file components are described in the following sections.
The DSS file name is the root node of the DSS file component tree.
When you select the root node, you can define the following properties for the DSS file:
Script Name—Enter a meaningful name for this script.
Script Description—Enter the reason for creating this script and describe its contents.
Script Version (Major)
Script Version (Minor)
Script Build Number (Major)
Script Build Number (Minor)
Created for Application Version—Select from a list of predefined values.
The following screen capture shows the default values for the DSS file properties.
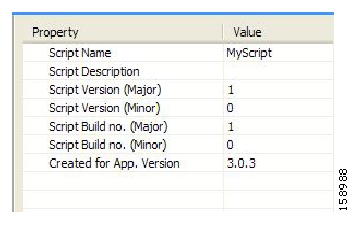
The DSS file contains a single protocol list.
The protocol list has no properties to define. It contains all the protocols that are being added, modified, or enhanced.
When you select a Protocol node in the DSS file component tree, you can define the following properties of the protocol:
Basic:
Protocol Name—See Setting Protocol Name and ID.
Protocol Description
Protocol ID—See Setting Protocol Name and ID.
Protocol Category:
Buddy Protocol—See The Buddy Protocol.
Protocol Families—Assign the protocol to one or more protocol families:
P2P
SIP
VOIP
Worm
Associating a protocol with a protocol family allows reports about the family to include the new protocol.
The following screen capture shows the default values for the protocol properties.
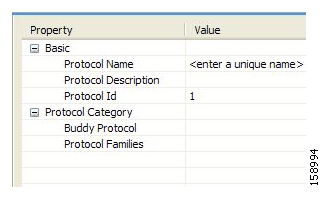
Protocols contain signatures.
A DSS can include two types of protocols:
A protocol that is new to SCA BB—The protocol is being defined in the DSS.
A protocol that SCA BB already supports—The protocol identification is being enhanced or modified in the DSS.
Selecting a name and ID is different for the two cases:
For a protocol that is new to SCA BB, the name must not match any of the protocol names that SCA BB already supports. To see a list of supported-protocol names, open the Protocol Settings dialog box in the Service Configuration Editor (see Viewing Protocols). Assign the protocol a unique ID in the range 5000 to 9998.
For an existing protocol, the protocol name and ID in the DSS must be identical to the protocol name and ID in the service configuration. Locate the name and ID in the Protocol Settings dialog box in the Service Configuration Editor (see Viewing Protocols).
To simplify the configuration of new protocols added by a DSS, the DSS may specify a Buddy Protocol for a new protocol. If, when importing a DSS to a service configuration, the application encounters service elements referring to the Buddy Protocol, it automatically duplicates the set of service elements that use the Buddy Protocol and replaces all references to the Buddy Protocol with references to the new protocol. The association of the new protocol to services will match that of the Buddy Protocol.
A protocol may contain as many different signatures as necessary.
Four different types of signatures may be added to a protocol:
String Match Signatures
Payload Length Signatures
HTTP User Agent Signatures
HTTP x-Header Signatures
Each of the four signature types tests different conditions against the first payload packet of the flows.
These signature types and their conditions are described in the following subsections.
String Match Signatures and Payload Length Signatures can contain deep inspection clauses. A signature whose first payload packet conditions are met will accept a flow if the conditions of any of its deep inspection clauses are also met.
When you select a String Match Signature node in the DSS file component tree, you can define the following properties of the signature:
Signature Name—A unique name
Signature Description
Signature ID—A value in the range 0xC010000 to 0xC0100FF (decimal 201392128 to 201392383)
First Payload Packet Conditions:
Fixed Size Byte String—(Display only) Shows the string formed by the next four fields:
[0]—Enter the ASCII code for the first byte of the string, or enter “*” to indicate that any value is acceptable.
[1]—Enter the ASCII code for the second byte of the string, or enter “*” to indicate that any value is acceptable.
[2]—Enter the ASCII code for the third byte of the string, or enter “*” to indicate that any value is acceptable.
[3]—Enter the ASCII code for the fourth byte of the string, or enter “*” to indicate that any value is acceptable.
String Position—The position of the Fixed Size Byte String in the packet. The position is the location of the first byte of the string, counting from the first byte in the packet. To match the string with the beginning of the packet, this value should be zero. The value must be an integer divisible by four.
Packet Direction—The initiating side of the first packet in the flow that has a payload. This field can have one of three values:
From Server
From Client
Don’t Care (either side)
Port Range—(Display only) The port range formed by the next two fields. The default value is the entire port range: 0 to 65535.
From Port—Lower bound of the port range (inclusive)
To Port—Upper bound of the port range (inclusive)
Check before PL—Toggles between the values
trueandfalse.This field indicates whether to test the signature before or after the execution of the SCA BB built-in PL (Protocol Library) classification. Testing this signature before the execution of the built-in classification means that if the flow matches this signature, the PL classification will be skipped. If this field is set to “false”, this signature will be tested only if the PL classification fails to identify any of its supported protocol signatures.
Caution
Set Check before PL to true only if the signature identifies the protocol according to the first payload packet only. If the signature also uses a Deep Inspection Condition that looks into later packets, and the signature does not match the flow, the PL classification will not perform properly.
The following screen capture shows the default values for the String Match Signature properties.
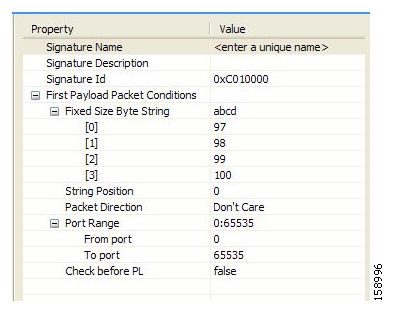
A flow that matches the first payload packet conditions of a String Match Signature will then be compared against the deep inspection conditions of the signature (see DSS Deep Inspection Conditions).
When you select a Payload Length Signature node in the DSS file component tree, you can define the following properties of the signature:
Signature Name—A unique name
Signature Description
Signature ID—A value in the range 0xC010000 to 0xC0100FF (decimal 201392128 to 201392383)
First Payload Packet Conditions:
Packet Direction—The initiating side of the first packet in the flow that has a payload. This field can have one of three values:
From Server
From Client
Don’t Care (either side)
Payload Length—The number of bytes in the payload packet.
Port Range—(Display only) The port range formed by the next two fields. The default value is the entire port range: 0 to 65535.
From Port—Lower bound of the port range (inclusive)
To Port—Upper bound of the port range (inclusive)
Check before PL—Toggles between the values true and
false.This field indicates whether to test the signature before or after the execution of the SCA BB built-in PL (Protocol Library) classification. Testing this signature before the execution of the built-in classification means that if the flow matches this signature, the PL classification will be skipped. If this field is set to “false”, this signature will be tested only if the PL classification fails to identify any of its supported protocol signatures.
Caution
Set Check before PL to true only if the signature identifies the protocol according to the first payload packet only. If the signature also uses a Deep Inspection Condition that looks into later packets, and the signature does not match the flow, the PL classification will not perform properly.
The following screen capture shows the default values for the Payload Length Signature properties.

A flow that matches the first payload packet conditions of a Payload Length Signature will then be compared against the deep inspection conditions of the signature (see DSS Deep Inspection Conditions).
When you select an HTTP User Agent Signature node in the DSS file component tree, you can define the following properties of the signature:
Signature Name—A unique name
Signature Description
Signature ID—A value in the range 0xC010000 to 0xC0100FF (decimal 201392128 to 201392383)
Conditions:
User Agent—The value of the User Agent field in the HTTP header
The following screen capture shows the default values for the HTTP User Agent signature properties.

When you select an HTTP x-Header Signature node in the DSS file component tree, you can define the following properties of the signature:
Signature Name—A unique name
Signature Description
Signature ID—A value in the range 0xC010000 to 0xC0100FF (decimal 201392128 to 201392383)
Conditions:
x-Header Field Name—A name of a field in the x-Header of the HTTP header
The following screen capture shows the default values for the DSS file properties.
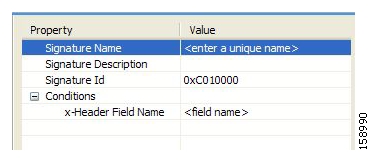
A deep inspection clause is a conjunctive clause of deep inspection conditions—a signature will accept a flow only if all conditions in a clause are met.
Note
If a signature has multiple deep inspection clauses, the clauses (and the deep inspection conditions making up each clause) are tested in an order based on the value of the Packet Number property of the deep inspection conditions.
After the first payload packet is accepted by the first payload packet conditions, the clause containing the condition with the lowest Packet Number is tested. The other conditions in this clause are checked in ascending Packet Number order. Thus, the Packet Number of any condition in a clause cannot be less than the largest Packet Number in the clause it succeeds.
A deep inspection condition is a set of conditions that are checked against flows that pass the first payload packet conditions screening of String Match Signatures or Payload Length Signatures.
When you select a Deep Inspection Condition node in the DSS file component tree, you can define the following properties of the deep inspection condition:
Packet Direction—The initiating side of the first packet in the flow that has a payload. This field can have one of three values: From Server, From Client or Don’t Care (either side).
Packet Number—The number of the packet in the flow. The payload packets are numbered from zero; packets are counted in both directions.
Payload Length—The length of the packet in bytes. Enter zero to indicate that any value is acceptable.
Printable Characters—Test if the inspected packet contains only printable characters. This field can have one of three values: Printable Characters Only, At Least One Non-Printable, or Don’t Care.
Substring Search—Match a search string with a specific location in the packet. Leave the Search String fields empty if this condition is irrelevant.
Position Offset—The position from which to start searching for the search string in the packet. The offset is relative to the location specified in the Start Search From field.
Start Search From—This field can have one of two values:
Packet beginning
Last match
Last match means that the search for this search string starts where the last search match ended. The last match may be from a previous substring search or from the last string-based first payload packet condition.
Searchable Range—Search in this number of bytes for the search string.
Search Packets—This field can have one of two values:
This packet only
Multiple packets
Multiple Packets means that the search may span across packets, as long as the overall number of bytes is less than the number specified in the Searchable Range field.
Search String—Enter the search string in one of the following three fields (the other two fields will be updated automatically):
ASCII Codes—Enter the ASCII codes for the characters of the search string. Separate each code by a comma.
Byte String—Enter the actual search string.
Hex Values—Enter the hexadecimal values of the ASCII codes for the characters of the search. string. Separate each code by a comma.
Transport Protocol—This field can have one of three values:
TCP
UDP
Don’t Care (either TCP or UDP)
The following screen capture shows the default values for the deep inspection condition properties.
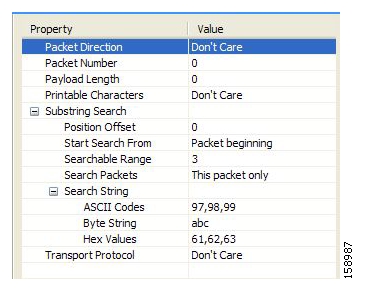
The structure of deep inspection conditions is the same for String Match Signatures and Payload Length Signatures.
Caution
If you have a DSS file open in the Signature Editor, save it before you create a new DSS file. All unsaved changes will be lost.
To create a new DSS file:
From the toolbar, click
(Create a New DSS File).A DSS component tree containing a DSS File node, a Protocol List node, and a Protocol node, is displayed in the Script tab.
The default properties of the new DSS file are displayed in the Properties tab.

Edit the DSS file properties (see The DSS File for an explanation of the properties).
Click the Protocol node.
The protocol properties appear in the Properties tab.
Edit the protocol properties (see DSS Protocols for an explanation of the properties).
Click the drop-down arrow next to the
button.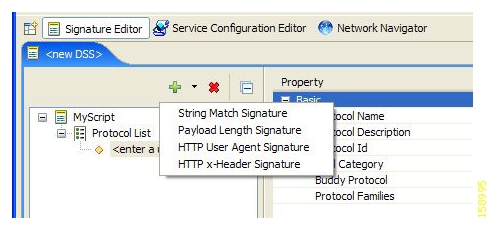
From the drop-down menu that appears, select a signature type.
A Signature node is added under the Protocol node.
If you selected a String Match Signature or a Payload Length Signature, a Deep Inspection Clause node and a Deep Inspection Condition node are also added.
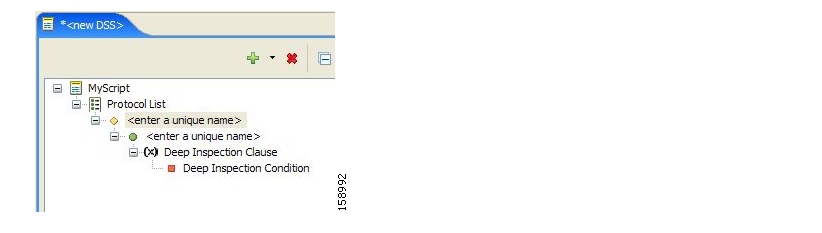
Click the Signature node.
The signature properties appear in the Properties tab.
Edit the signature properties (see DSS Signatures for an explanation of the properties).
If you selected a String Match Signature or a Payload Length Signature:
Click the Deep Inspection Condition node.
The deep inspection condition properties appear in the Properties tab.
Edit the deep inspection condition properties (see DSS Deep Inspection Conditions for an explanation of the properties).
Add additional deep inspection conditions, deep inspection clauses, signatures, and protocols as needed.
From the toolbar, click
(Save).If there are duplicate protocol names or protocol IDs, a Validation Error message appears.

Click OK, remove the duplication, and then click
(Save) again.
A Save As dialog box appears.
Browse to the folder where you want to save the new DSS file.
In the File name field, enter an appropriate name for the DSS file.
Click Save.
The Save As dialog box closes.
The DSS file is saved.
You can edit an existing DSS file, and add new protocols, or modify or delete existing protocols.
Caution
If you have a DSS file open in the Signature Editor, save it before you open a different DSS file. All unsaved changes will be lost.
To edit an existing DSS file:
From the toolbar, click
 (Open a DSS File).
An Open dialog box appears.
Browse to the DSS file that you want to edit.
Click Open.
The Open dialog box closes.
The DSS Component tree of the selected file is displayed in the Script tab.
The DSS File node is selected, and the properties of the DSS file are displayed in the Properties tab.
Add, edit, or delete DSS file components. (See the subsections of DSS File Components for an explanation of the properties of the different components.)
Save the modified DSS file:
To overwrite the current DSS file with the changes you have made:
From the toolbar, click
(Save).The changes to the DSS file are saved.
To save the modified DSS file with a new name:
From the File > Save As.
A Save As dialog box appears.
Browse to the folder where you want to save the new DSS file.
In the File name field, enter an appropriate name for the DSS file.
Click Save.
The Save As dialog box closes.
The modified DSS file is saved with the new name.
You can import DSS files into the file you are currently editing.
To import a DSS file:
From the Console main menu, choose File > Import.
The Import dialog box appears.
From the import source list, select Import protocols from one DSS file to another DSS.
Click Next.
The second screen of the Import dialog box opens.
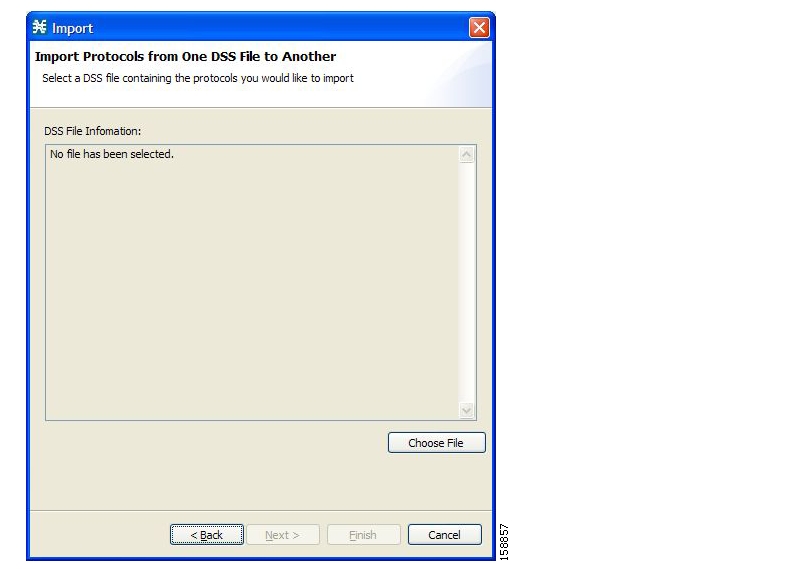
Click Choose File.
An Open dialog box appears.
Browse to the DSS file to import.
Click Open.
The Open dialog box closes.
Information about the DSS file that you have chosen is displayed in the DSS File Information area.
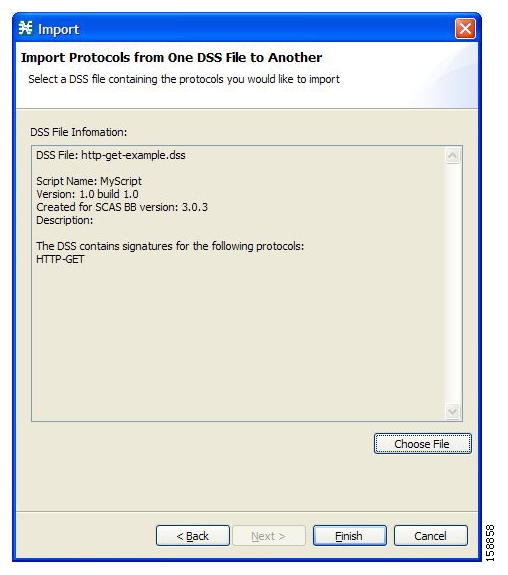
Click Finish.
The Import dialog box closes.
The content of the selected DSS file is imported into the Signature Editor.
Note
Importing signatures may create duplication of protocol names or protocol IDs.
The Cisco Service Control Application for Broadband (SCA BB) Service Configuration Utility (servconf) is a command-line utility (CLU) for applying and retrieving service configurations. Use it in a scripting environment to automate service configuration tasks on multiple Service Control Engine (SCE) platforms.
The Service Configuration Utility can run in Windows, Solaris, and Linux environments.
For installation instructions, see Installing the SCA BB Configuration Utilities.
The command-line syntax of the SCA BB Service Configuration Utility is:
servconf <operation> [<option>] [<option>] ...The following tables list the servconf operations and options.
Table 13.1. servconf Operations
|
Operation |
Abbreviation (if applicable) |
Description |
|---|---|---|
|
|
|
Copies the specified service configuration file to the specified SCE platforms and activates it |
|
|
|
Retrieves the current service configuration |
|
|
|
Updates a Cisco Service Control Management Suite (SCMS) Collection Manager (CM) with service configuration values |
|
|
|
Shows the service configuration status on the SCE platform |
|
|
|
Updates the SCE platform with a new protocol pack |
|
|
|
Updates the SCE platform with a new SPQI protocol pack |
|
|
|
Shows information about the Dynamic Signature Script (DSS) file |
|
|
|
Displays help, then exits |
|
|
|
Displays the program version number, then exits |
Table 13.2. servconf File Options
|
File Option |
Abbreviation |
Description |
|---|---|---|
|
|
|
Specifies a service configuration file or DSS file |
|
|
|
Specifies the directory to which to save the retrieved PQB file before applying a new protocol pack |
Table 13.3. servconf Connection Options
|
File Option |
Abbreviation |
Description |
|---|---|---|
|
|
|
Specifies the IP address of the destination SCE platform. To specify multiple SCE platforms, list the IP addresses separated by semicolons (see Example 1 in the following section). When using a semicolon in a Unix command line, the command-line argument must be enclosed in quotation marks. |
|
|
|
Specifies the IP address of the destination SCMS-CM platform (required only for the |
|
|
|
Specifies the password for connecting to the SCE platform. |
|
|
|
Specifies the username for connecting to the SCE platform. If this option is not specified, the following default values are used:
|
Table 13.4. servconf Reference SCE Option
|
File Option |
Description |
|---|---|
|
|
Specifies the IP address of the SCE platform to which the service configuration values refer (required only for |
Table 13.5. servconf Apply Options
|
File Option |
Description |
|---|---|
|
|
(Optional) Specifies that the |
|
|
Applies the service configuration without adding the default DSS to it. |
|
|
Forces the replacement of the DSS in the retrieved PQB with the default DSS, even if the signatures of the existing DSS are mapped to services. Without this flag, trying to update a PQB containing a DSS will fail. |
Table 13.6. servconf Update Signature Option
|
File Option |
Description |
|---|---|
|
|
Forces replacement of the DSS in the retrieved PQB, even if the signatures of the existing DSS are mapped to services. Without this flag, trying to update a PQB containing a DSS will fail. |
Example 1
To copy the service configuration file config.pqb from the local machine to two SCE platforms (at 63.111.106.7 and 63.111.106.12), and activate this configuration:
servconf ”--se=63.111.106.7;63.111.106.12” --username Alice --password *****
--apply --file config.pqb
Example 2
To retrieve the current service configuration from the SCE platform at 63.111.106.7, and save it in file my_files\config.pqb on the local machine:
servconf -S 63.111.106.7 -U Bob -P ***** --retrieve --file my_files\config.pqbExample 3
To update the SCMS-CM at 63.121.116.17 with service configuration values from file config.pqb, as if they were applied to the SCE platform at 63.111.106.7 (but without actually applying them to the SCE platform):
servconf -D 63.121.116.17 -U Alice -P ***** --update-dc
--refer-se 63.111.106.7 --file config.pqb
Example 4
To distribute the protocol pack file new_signature.spqi to the SCE platforms at 10.56.216.33 and 10.56.216.36:
servconf --update-signature-pqi -f new_signature.spqi
-S ”10.56.216.33;10.56.216.36” -U user123 -P *****SNMP-based monitoring tools, such as MRTG, allow network administrators to monitor the activity and health of network devices in real time. SCA BB includes an SNMP-based real-time monitoring solution, which is implemented using MRTG and a graphics utility (RRDTool).
The SCA BB Real-Time Monitoring Configuration Utility (rtmcmd) is a command-line utility (CLU) for automating the production of the files required by the MRTG tool.
For installation instructions, see Installing the SCA BB Configuration Utilities. For more information about installing and using the SCA BB SNMP-based real-time monitoring solution, see the Cisco SCA BB SNMP Real-Time Monitoring User Guide.
The command-line syntax of the SCA BB Real-Time Monitoring Configuration Utility is:
rtmcmd --sce <SCE (SNMP) addresses> {--file <PQB filename> | (--pqb-sce
<SCE (PQB) addresses> --username <username> --password <password>)}
--source-dir <dir> --dest-dir <dir> --config-file <file>
The following table lists the rtmcmd options.
Table 13.7. rtmcmd Options
|
Option |
Abbreviation |
Description |
|---|---|---|
|
|
|
Specifies the IP address or hostname of the SCE platform from which SNMP data will be collected. To specify multiple SCE platforms, list the IP addresses separated by semicolons. When using a semicolon in a Unix command line, the command-line argument must be enclosed in quotation marks. |
|
|
|
(Required if If this option is specified, the |
|
|
|
(Required if This option requires the |
|
|
|
(Required if |
|
|
|
(Required if |
|
|
|
Specifies the location of the report template files. |
|
|
|
Specifies the directory where the processed report templates should be stored. |
|
|
|
Specifies the user configuration file. |
You can invoke additional operations to display information about the rtmcmd using the following syntax:
rtmcmd <operation>The following table lists these additional rtmcmd operations.
Table 13.8. rtmcmd Operations
|
Operation |
Description |
|---|---|
|
|
Displays the program version number, then exits |
|
|
Displays help, then exits |
Example 1
To use the service configuration file servicecfg.pqb to create configuration and report files for the collecting and reporting of SNMP information from two SCE platforms (at 63.111.106.7 and 63.111.106.12):
rtmcmd --sce="63.111.106.7;63.111.106.12" --file=servicecfg.pqb
--source-dir=/rtm-templates --dest-dir=/rtm-output -c ./rtmcmd.cfg
Example 2
To use the service configuration loaded on the SCE platform at 63.111.106.7 to create configuration and report files for the collecting and reporting of SNMP information from two SCE platforms (at 63.111.106.7 and 63.111.106.12):
rtmcmd -S "63.111.106.7;63.111.106.12" -U user123 -P ****
--pqb-sce=63.111.106.7 --source-dir=/rtm-templates
--dest-dir=/rtm-output -c ./rtmcmd.cfg
The user configuration file contains user-specific information required by the rtmcmd utility. The SCA BB utilities distribution package contains a sample configuration file, named rtmcmd.cfg. You should edit this file according to the details of your setup.
The following table lists the configuration parameters that should be present in the user configuration file:
Table 13.9. User Configuration File Parameters
|
Parameter |
Description |
Default Value |
Required/ Optional |
|---|---|---|---|
|
rrdtool_bin_dir |
The absolute path to the directory where RRDTool and RRDCGI binary files are installed. |
|
Required |
|
rtm_dir |
The absolute path to the directory where RRD archives and CGI files are stored. This is under the web server web directory. |
|
Required |
|
mrtg_bin_dir |
The absolute path to the directory where MRTG binary files are installed. This location is used to create MRTG invocation commands in the crontab sample file. |
|
Required |
|
snmpCommunityString |
The SNMP community string to use when accessing the SCE platforms. |
Public |
Required |
The configuration text file is a listing of key-value pairs, where the key is one of the parameters listed above, in the following format:
Each key-value pair is on a separate line.
A key-value pair may be extended across several adjacent lines by putting a backslash character, “\”, at the end of each line.
To use an actual backslash in the value (as in directory names on Windows), the backslash should be escaped with a second backslash, like this: “\\” (or use a slash “/”).
To comment a line, add “#” or “!” at the beginning of the line.
For example:
# This is a comment line.
# Directory names should use escape backslashes:
rtm_dir=D:\\PROGRA~1\\APACHE~1\\Apache2.2\\htdocs#The absolute path to the RRD tool's execution files folder
#Use '\\' or '/' as path separator
rrdtool_bin_dir=C:/rrdtool-1.2.15/rrdtool/Release
#The absolute path where RTM files will be placed.
#This path will be used by MRTG to create and update the RRD files
#Note: path must not contain white spaces!
rtm_dir=C:/PROGRA~1/APACHE~1/Apache2.2/htdocs
#The absolute path to the MRTG bin folder.
#This path will be used to create file crontab.txt
mrtg_bin_dir=C:/mrtg-2.14.5/bin
#The SCE's community string
snmpCommunityString=publicThe SCA BB Signature Configuration Utility (sigconf) is a command-line utility for installing and managing the default DSS.
The signature configuration utility can run in Windows, Solaris, and Linux environments.
For installation instructions, see Installing the SCA BB Configuration Utilities.
The command-line syntax of the SCA BB Signature Configuration Utility is:
sigconf <operation> [--file <filename>]The following tables list the sigconf operations and options.
Table 13.10. sigconf Operations
Operation
Abbreviation
Description
--set-default-dynamic-signature
-d
Installs the default DSS on this workstation
--remove-default-dynamic-signature
Uninstalls the default DSS from this workstation
--get-default-dynamic-signature
Fetches the default DSS installed on this workstation
--help
Displays help, then exits
Table 13.11. sigconf File Option
File Option
Abbreviation
Description
--file=filename
-f
Specifies DSS file
You can install a SCA BB PQI file on an SCE platform using the SCE platform Command-Line Interface (CLI).
To install a SCA BB PQI file on an SCE platform:
Do one of the following:
Locate the PQI file on the SCE platform.
Upload the appropriate PQI file to the SCE via FTP.
At the SCE platform CLI prompt (
SCE#), typeconfigure.Press Enter.
The
SCE(config)#prompt appears.Type
interface linecard 0.Press Enter.
The
SCE(config if)#prompt appears.Type
pqi install file engXXXXX.pqi.Monitor the installation progress until it is completed.
The PQI file is now installed.
Note
After you install the Console, you can use the Network Navigator tool to install PQI files. See Installing PQI Files on SCE Devices.
You can install a SCA BB PQI file on a Cisco Service Control Management Suite (SCMS) Subscriber Manager (SM) using the SM Command-Line Utility (CLU).
To install a SCA BB PQI file on an SM device:
Upload the appropriate PQI file to the SM via FTP.
Open a Telnet session to the SM.
Go to the SM
bindirectory and typep3inst --install --file=sm_engXXXXX.pqi.Press Enter.
Monitor installation progress until installation is completed.
The PQI file is now installed.
Note
After you install the Console, you can use the Network Navigator tool to install PQI files. See Installing PQI Files on SM Devices.
Cisco provides complete network FCAPS (Fault, Configuration, Accounting, Performance, Security) Management.
Two interfaces are provided for network management:
Command-line interface (CLI)—Accessible through the Console port or through a Telnet connection, the CLI is used for configuration and security functions.
SNMP (Simple Network Management Protocol)—Provides fault management (via SNMP traps) and performance monitoring functionality.
SNMP is a set of protocols for managing complex networks. SNMP works by sending messages, called protocol data units (PDUs), to different parts of a network. SNMP-compliant devices, called agents, store data about themselves in Management Information Bases (MIBs) and return this data to the SNMP requesters.
The SCE platform operating system includes an SNMP agent. Configuring the SNMP agent parameters and enabling the SNMP interface is described in the “Configuring the Management Interface and Security” chapter of the Cisco Service Control Engine (SCE) Software Configuration Guide.
Management Information Bases (MIBs) are databases of objects that can be monitored by a network management system. SNMP uses standardized MIB formats that allow standard SNMP tools to monitor any device defined by a MIB.
The SCE platform supports the following MIBs:
MIB-II—Defined in RFC 1213, Management Information Base for Network Management of TCP/IP-based Internets
Cisco Service Control Enterprise MIB—Described by a number of MIB files
The Cisco proprietary MIB allows external management systems to retrieve general information regarding the SCE platform operating status and resources utilization, extract real-time measurements of bandwidth utilization and network statistics, and receive notifications of critical events and alarms.
The part of the Cisco proprietary MIB that provides configuration and runtime status for SCA BB is documented in the “SCA BB Proprietary MIB Reference” chapter of the Cisco Service Control Application for Broadband Reference Guide. Other parts of the Cisco proprietary MIB are documented in the “Proprietary MIB Reference” appendix of the Cisco Service Control Engine (SCE) Software Configuration Guide. These books also explain the order in which the MIB must be loaded.
Traps are unsolicited messages generated by the SNMP agent that resides inside the SCE platform. Traps are generated when an event occurs. When the Network Management System receives the trap message, it can take suitable actions, such as logging the occurrence or ignoring the signal.
The SCE platform supports two general categories of traps:
Standard SNMP traps—As defined in RFC 1157 and using the conventions defined in RFC 1215
Proprietary Cisco Service Control Enterprise traps—As defined in the Cisco proprietary MIB
For a description of the SNMP traps and an explanation of how to configure the SNMP trap managers, see “SNMP Configuration and Management” in the “Configuring the Management Interface and Security” chapter of the Cisco Service Control Engine (SCE) Software Configuration Guide.
Other components of the Cisco Service Control solution offer alternatives for subscriber management (as opposed to using the Subscriber Manager GUI tool in the Console):
The Cisco Service Control Management Suite (SCMS) Subscriber Manager (SM) has options that are not available from the Console.
The SCE platform has a wide range of subscriber-related functions.
This section gives an overview of these alternatives, with emphasis on the SCA BB-specific subscriber management options. For in-depth explanations, see the appropriate Service Control documentation.
An anonymous subscriber is one with a name that is generated automatically by the SCE platform according to an anonymous subscriber group specification. An anonymous subscriber is always mapped to a single IP address. The actual identity of the customer is unknown to the system. (See Subscribers and Subscriber Modes.)
An anonymous group is a specified IP range, possibly assigned a subscriber template. If an anonymous group is configured, the SCE platform generates anonymous subscribers for that group when it detects traffic with an IP address that is in the specified IP range. If a subscriber template is assigned to the group, the anonymous subscribers generated have properties defined by that template. If no subscriber template is assigned, the default template is used, which cannot be changed by template import operations. Initially, 32 templates are preconfigured, one for each package ID.
Anonymous subscriber groups and subscriber templates are managed using the SCE platform Command-Line Interface (CLI). You can enter CLI commands via a Telnet session. For more information, see the Cisco Service Control Engine (SCE) CLI Command Reference.
Use the following commands to import anonymous subscriber groups and subscriber templates from CSV files and to export subscriber data to these files:
subscriber anonymous-group import csv-file subscriber anonymous-group export csv-file subscriber template import csv-file subscriber template export csv-fileNote
The preceding CLI commands are line interface configuration commands. You must enter line interface configuration mode and see the
SCE(config if)#prompt displayed before entering a command.Use the following commands to delete anonymous groups or subscriber templates from the system.
no subscriber anonymous-group [all] [name <groupname>] clear subscriber anonymous default subscriber template allNote
The preceding CLI commands are line interface configuration commands. You must enter line interface configuration mode and see the
SCE(config if)#prompt displayed before entering a command.Use the following commands to display anonymous subscriber information:
show interface linecard 0 subscriber templates [index] show interface linecard 0 subscriber anonymous-group [all] [name <groupname>] show interface linecard 0 subscriber amount anonymous [name <groupname>] show interface linecard 0 subscriber anonymous [name <groupname>]
Real-Time Subscriber Usage RDRs report the network activity of a single subscriber per service per metric, in real-time. You must enable the generation of these subscriber usage RDRs separately for each subscriber that you wish to monitor.
Caution
Generating and collecting Real-Time Subscriber Usage RDRs for many subscribers can cause performance penalties. Enable Real-Time Subscriber Usage RDR generation only for those subscribers that must actually be monitored by the system.
Generation of Real-Time Subscriber Usage RDRs is controlled by the monitor subscriber property. By default, generation of these RDRs is disabled (monitor = 0). To enable generation of the RDRs, change the value of the property to 1.
You can modify this property for selected subscribers using either the SM Command-Line Utility (CLU) or the SCE platform CLI.
You can enable or disable the generation of the Real-Time Subscriber Usage RDRs using the SM p3subs utility. You can also create a file that processes a batch of subscribers. For more information, see the Cisco Service Control Management Suite Subscriber Manager User Guide.
To enable subscriber monitoring for subscriber Smith:
Run the following from the command line:
sm/server/bin/p3subs --set --subscriber Smith --property monitor=1
To disable subscriber monitoring for subscriber Smith:
Run the following from the command line:
sm/server/bin/p3subs --set --subscriber Smith --property monitor=0
To enable subscriber monitoring for a group of subscribers:
Create a text file (named monitor.txt in this example) containing the sequence of CLU invocations. The file would look something like this:
p3subs --set --subscriber Jerry --property monitor=1
p3subs --set --subscriber George --property monitor=1
p3subs --set --subscriber Elaine --property monitor=1
p3subs --set --subscriber Kramer --property monitor=1
p3subs --set --subscriber Newman --property monitor=1
Run the following from the command line:
sm/server/bin/p3batch -f monitor.txt
You can check to see whether subscriber monitoring is enabled for a specific subscriber.
You can also enable or disable the generation of the Real-Time Subscriber Usage RDRs using the SCE platform. For more information, see the Cisco Service Control Engine (SCE) CLI Command Reference.
(The prompt is included in these examples to illustrate how it changes. You must see the SCE(config if)# prompt to invoke the actual subscriber command.)
To enable subscriber monitoring for subscriber “Smith”:
Run the following from the command line:
SCE#configureSCE(config)#interface LineCard 0SCE(config if)#subscriber name Smith property monitor value 1
To disable subscriber monitoring for subscriber “Smith”:
Run the following from the command line:
SCE#configureSCE(config)#interface LineCard 0SCE(config if)#subscriber name Smith property monitor value 0
To enable subscriber monitoring for a group of subscribers:
Create a text file (named monitor.txt in this example) containing the sequence of CLI invocations, including the commands to access the appropriate CLI mode. The file would look something like this:
configure
interface LineCard 0
subscriber name Jerry property monitor value 1
subscriber name George property monitor value 1
subscriber name Elaine property monitor value 1
subscriber name Kramer property monitor value 1
subscriber name Newman property monitor value 1
Run the following from the command line:
SCE#script run monitor.txt
You can check to see whether subscriber monitoring is enabled for a specific subscriber.
To see whether subscriber monitoring is enabled for subscriber “Smith”:
Run the following from the command line:
SCE#show interface LineCard 0 subscriber name Smith propertiesThe properties are displayed; monitor is the relevant parameter.
Subscriber smith properties:
subscriberPackage=0
monitor=1
Subscriber 'smith' read-only properties
In subscriber-aware mode, each subscriber is a specific customer with an externally generated name. This externally generated name allows the subscriber to be mapped to more than one IP address and still be identified. Each traffic session (single IP flow, or a group of related IP flows) processed by the SCE platform is assigned to a recognized subscriber on the basis of the configured subscriber mappings.
There are three options for introducing and managing these subscribers:
Use the following commands to import subscriber data from CSV files and to export subscriber data to these files:
Note
The following CLI commands are line interface configuration commands. You must enter line interface configuration mode and see the SCE(config if)# prompt displayed.
subscriber import csv-file
subscriber export csv-file
Note
The preceding CLI commands are line interface configuration commands. You must enter line interface configuration mode and see the SCE(config if)# prompt displayed before entering a command.
Use the following command to remove subscribers from the system.
no subscriber [all] [name <subscriber-name>]Note
The preceding CLI command is a line interface configuration command. You must enter line interface configuration mode and see the SCE(config if)# prompt displayed before entering the command.
Use the following commands to display subscribers meeting various criteria:
show interface linecard 0 subscriber [amount]
[prefix <prefix>] [property <propertyname> equals|greater-than|less-than <property-val>]
show interface linecard 0 subscriber [amount] prefix <prefix>
show interface linecard 0 subscriber [amount] suffix <suffix>
show interface linecard 0 subscriber mapping IP <iprange>
show interface linecard 0 subscriber [amount] mapping intersecting IP <iprange>
show interface linecard 0 subscriber mapping VLANid <vlanid>
Use the following commands to display information about a specific subscriber:
show interface linecard 0 subscriber properties
show interface linecard 0 subscriber name <name>
show interface linecard 0 subscriber name <name> mappings
show interface linecard 0 subscriber name <name> counters
show interface linecard 0 subscriber name <name> propertiesUse the p3subs SM utility to manage subscribers. You can add or remove subscribers. You can also manage subscriber properties and mappings with this utility.
For more information, see the Cisco Service Control Management Suite Subscriber Manager User Guide.
To manage subscribers:
At the Solaris shell prompt, enter a command having the following general format:
p3subs <operation> --subscriber=<Subscriber-Name> [--ip=<IP-address>]
[--property=<property-name=value>] [--domain=<domain-name>] [--overwrite]
The following table lists the p3subs operations relevant to managing subscribers.
Table 13.12. p3subs Subscriber Operations
|
Operation |
Description |
|---|---|
|
|
Adds a subscriber or replaces the existing subscriber configuration |
|
|
Updates mappings and properties for the specified subscriber |
|
|
Removes the specified subscriber |
|
|
Displays information for specified subscriber |
Use the p3subsdb SM utility to import and export subscriber CSV files. You can import subscriber information for a group of subscribers from a CSV file into the SM database. You can also export subscriber information from the SM database to a CSV file.
For more information, see the Cisco Service Control Management Suite Subscriber Manager User Guide.
CSV file structure is described in the “CSV File Formats” chapter of the Cisco Service Control Application for Broadband Reference Guide.
To import CSV files:
At the Solaris shell prompt, enter a command having the following general format:
p3subsdb --importfilename
To export CSV files:
At the Solaris shell prompt, enter a command having the following general format:
p3subsdb --exportfilename
Example:
To export subscribers with filtering options to a specified CSV file:
p3subsdb --export --prefix=a -–output=silverSubscriberFile.csv