
 |  |
13.5. Performance Tuning
Before thinking much about performance tuning, get your code working. Once you have working code, you can then locate the slow bits. If you try to optimize your code while writing it, you'll discover that optimized code tends to be more difficult to read and to take more time to write. If you spend that time on a section of code that isn't actually causing a problem, that's time that was wasted, especially when it comes time to maintain that code, and you can no longer read it.
Once you get your code working, you may find that it needs some optimization. Optimizing code tends to fall within one of two areas: shortening execution times and lessening memory requirements.
Before you begin optimization, ask yourself whether you need to optimize at all. Too many programmers have wasted hours wondering whether a complex series of string function calls are faster or slower than a single Perl regular expression, when the page that this code is in is viewed once every five minutes. Optimization is necessary only when a page takes so long to load that the user perceives it as slow. Often this is a symptom of a very popular site—if requests for a page come in fast enough, the time it takes to generate that page can mean the difference between prompt delivery and server overload.
Once you've decided that your page needs optimization, you can move on to working out exactly what is slow. You can use the techniques in Section 13.5.2 to time the various subroutines or logical units of your page. This will give you an idea of which parts of your page are taking the longest time to produce—these parts are where you should focus your optimization efforts. If a page is taking 5 seconds to produce, you'll never get it down to 2 seconds by optimizing a function that accounts for only 0.25 seconds of the total time. Identify the biggest time-wasting blocks of code and focus on them. Time the page and the pieces you're optimizing, to make sure your changes are having a positive and not negative effect.
Finally, know when to quit. Sometimes there is an absolute limit for the speed at which you can get something to run. In these circumstances, the only way to get better performance is to throw new hardware at the problem. The solution might turn out to be faster machines, or more web servers with a reverse-proxy cache in front of them.
13.5.1. Benchmarking
If you're using Apache, you can use the Apache benchmarking utility, ab, to do high-level performance testing. To use it, run:
$ /usr/local/apache/bin/ab -c 10 -n 1000 http://localhost/info.php
This command tests the speed of the PHP script info.php 1,000 times, with 10 concurrent requests running at any given time. The benchmarking tool returns various information about the test, including the slowest, fastest, and average load times. You can compare those values to a static HTML page to see how quickly your script performs.
For example, here's the output from 1,000 fetches of a page that simply calls phpinfo( ):
This is ApacheBench, Version 1.3d <$Revision: 1.4 $> apache-1.3
Copyright (c) 1996 Adam Twiss, Zeus Technology Ltd,
http://www.zeustech.net/
Copyright (c) 1998-2001 The Apache Group, http://www.apache.org/

Benchmarking localhost (be patient)
Completed 100 requests
Completed 200 requests
Completed 300 requests
Completed 400 requests
Completed 500 requests
Completed 600 requests
Completed 700 requests
Completed 800 requests
Completed 900 requests
Finished 1000 requests
Server Software:        Apache/1.3.22
Server Hostname:        localhost
Server Port:            80

Document Path:          /info.php
Document Length:        49414 bytes

Concurrency Level:      10
Time taken for tests:   8.198 seconds
Complete requests:      1000
Failed requests:        0
Broken pipe errors:     0
Total transferred:      49900378 bytes
HTML transferred:       49679845 bytes
Requests per second:    121.98 [#/sec] (mean)
Time per request:       81.98 [ms] (mean)
Time per request:       8.20 [ms] (mean, across all concurrent requests)
Transfer rate:          6086.90 [Kbytes/sec] received

Connnection Times (ms)
              min  mean[+/-sd] median   max
Connect:        0    12   16.9      1    72
Processing:     7    69   68.5     58   596
Waiting:        0    64   69.4     50   596
Total:          7    81   66.5     79   596

Percentage of the requests served within a certain time (ms)
  50%     79
  66%     80
  75%     83
  80%     84
  90%    158
  95%    221
  98%    268
  99%    288
 100%    596 (last request)
If your PHP script uses sessions, the results you get from ab will not be representative of the real-world performance of the scripts. Since a session is locked across a request, results from the concurrent requests run by ab will be extremely poor. However, in normal usage, a session is typically associated with a single user, who isn't likely to make concurrent requests.
Using ab tells you the overall speed of your page but gives you no information on the speed of individual functions of blocks of code within the page. Use ab to test changes you make to your code as you attempt to improve its speed—we show you how to time individual portions of a page in the next section, but ultimately these microbenchmarks don't matter if the overall page is still slow to load and run. The ultimate proof that your performance optimizations have been successful comes from the numbers that ab reports.
13.5.2. Profiling
PHP does not have a built-in profiler, but there are some techniques you can use to investigate code that you think has performance issues. One technique is to call the microtime( ) function to get an accurate representation of the amount of time that elapses. You can surround the code you're profiling with calls to microtime( ) and use the values returned by microtime( ) to calculate how long the code took.
For instance, here's some code you can use to find out just how long it takes to produce the phpinfo( ) output:
<?php
 ob_start( );
 $start = microtime( );
 phpinfo( );
 $end = microtime( );
 ob_end_clean( );

 echo "phpinfo( ) took " . ($end-$start) . " seconds to run.\n";
?>
Reload this page several times, and you'll see the number fluctuate slightly. Reload it often enough, and you'll see it fluctuate quite a lot. The danger of timing a single run of a piece of code is that you may not get a representative machine load—the server might be paging as a user starts emacs, or it may have removed the source file from its cache. The best way to get an accurate representation of the time it takes to do something is to time repeated runs and look at the average of those times.
The Benchmark class available in PEAR makes it easy to repeatedly time sections of your script. Here is a simple example that shows how you can use it:
<?php
 require_once 'Benchmark/Timer.php';

 $timer = new Benchmark_Timer;

 $timer->start( );
 sleep(1);
 $timer->setMarker('Marker 1');
 sleep(2);
 $timer->stop( );

 $profiling = $timer->getProfiling( );

 foreach($profiling as $time) {
     echo $time['name'] . ': ' .  $time['diff'] . "<br>\n";
 }
 echo 'Total: ' . $time['total'] . "<br>\n";
?>
The output from this program is:
Start: -
Marker 1: 1.0006979703903
Stop: 2.0100029706955
Total: 3.0107009410858
That is, it took 1.0006979703903 seconds to get to marker 1, which is set right after our sleep(1) call, so it is what you would expect. It took just over 2 seconds to get from marker 1 to the end, and the entire script took just over 3 seconds to run. You can add as many markers as you like and thereby time various parts of your script.
13.5.3. Optimizing Execution Time
Here are some tips for shortening the execution times of your scripts:
-
Avoid printf( ) when echo is all you need.
-
Avoid recomputing values inside a loop, as PHP's parser does not remove loop invariants. For example, don't do this if the size of $array doesn't change:
for ($i=0; $i < count($array); $i++) { /* do something */ }Instead, do this:
$num = count($array); for ($i=0; $i < $num; $i++) { /* do something */ } -
Include only files that you need. Split included files to include only functions that you are sure will be used together. Although the code may be a bit more difficult to maintain, parsing code you don't use is expensive.
-
If you are using a database, use persistent database connections—setting up and tearing down database connections can be slow.
-
Don't use a regular expression when a simple string-manipulation function will do the job. For example, to turn one character into another in a string, use str_replace( ), not preg_replace( ).
13.5.4. Optimizing Memory Requirements
Here are some techniques for reducing the memory requirements of your scripts:
-
Use numbers instead of strings whenever possible:
for ($i="0"; $i < "10"; $i++)      // bad
for ($i=0; $i < 10; $i++)          // good
-
When you're done with a large string, set the variable holding the string to an empty string. This frees the memory to be reused.
-
Only include or require files that you need. Use include_once and require_once instead of include and require.
-
If you are using MySQL and have large result sets, consider using the MySQL-specific database extension, so you can use mysql_unbuffered_query( ). This function doesn't load the whole result set into memory at once—instead, it fetches it row by row, as needed.
13.5.5. Reverse Proxies and Replication
Adding hardware is often the quickest route to better performance. It's better to benchmark your software first, though, as it's generally cheaper to fix software than to buy new hardware. This section discusses three common solutions to the problem of scaling traffic: reverse-proxy caches, load-balancing servers, and database replication.
13.5.5.1. Reverse-proxy cache
A reverse proxy is a program that sits in front of your web server and handles all connections from client browsers. Proxies are optimized to serve up static files quickly, and despite appearances and implementation, most dynamic sites can be cached for short periods of time without loss of service. Normally, you'll run the proxy on a separate machine from your web server.
Take, for example, a busy site whose front page is hit 50 times per second. If this first page is built from two database queries and the database changes as often as twice a minute, you can avoid 5,994 database queries per minute by using a Cache-Control header to tell the reverse proxy to cache the page for 30 seconds. The worst-case scenario is that there will be a 30-second delay from database update to a user seeing this new data. For most applications that's not a very long delay, and it gives significant performance benefits.
Proxy caches can even intelligently cache content that is personalized or tailored to the browser type, accepted language, or similar feature. The typical solution is to send a Vary header telling the cache exactly which request parameters affect the caching.
There are hardware proxy caches available, but there are also very good software implementations. For a high-quality and extremely flexible open source proxy cache, have a look at Squid at http://www.squid-cache.org. See the book Web Caching by Duane Wessels (O'Reilly) for more information on proxy caches and how to tune a web site to work with one.
A typical configuration, with Squid listening on the external interface on port 80 and forwarding requests to Apache (which is listening on the loopback), looks like Figure 13-2.
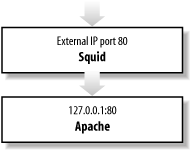
Figure 13-2. Squid caching
The relevant part of the Squid configuration file to set up Squid in this manner is:
httpd_accel_host 127.0.0.1
httpd_accel_port 80
httpd_accel_single_host on
httpd_accel_uses_host_header on
13.5.5.2. Load balancing and redirection
One way to boost performance is to spread the load over a number of machines. A load-balancing system does this by either evenly distributing the load or sending incoming requests to the least loaded machine. A redirector is a program that rewrites incoming URLs, allowing fine-grained control over the distribution of requests to individual server machines.
Again, there are hardware HTTP redirectors and load-balancers, but redirection and load balancing can also be done effectively in software. By adding redirection logic to Squid through something like SquidGuard (http://www.squidguard.org), you can do a number of things to improve performance.
Figure 13-3 shows how a redirector can load-balance requests either over multiple backend web servers or across separate Apache instances running on different ports on the same server.
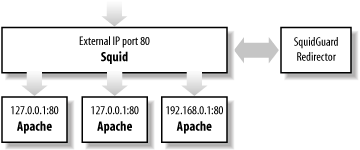
Figure 13-3. Load balancing with SquidGuard
13.5.5.3. MySQL replication
Sometimes the database server is the bottleneck—many simultaneous queries can bog down a database server, resulting in sluggish performance. Replication is the solution. Take everything that happens to one database and quickly bring one or more other databases in sync, so you end up with multiple identical databases. This lets you spread your queries across many database servers instead of loading down only one.
The most effective model is to use one-way replication, where you have a single master database that gets replicated to a number of slave databases. All database writes go to the master server, and database reads are load-balanced across multiple slave databases. This technique is aimed at architectures that do a lot more reads than writes. Most web applications fit this scenario nicely.
Figure 13-4 shows the relationship between the master and slave databases during replication.
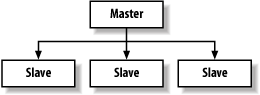
Figure 13-4. Database replication
Many databases support replication, including MySQL, PostgreSQL, and Oracle.
13.5.5.4. Putting it all together
For a really high-powered architecture, pull all these concepts together into something like the configuration shown in Figure 13-5.
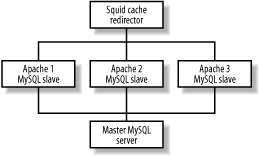
Figure 13-5. Putting it all together
Using five separate machines—one for the reverse proxy and redirector, three web servers, and one master database server—this architecture can handle a huge number of requests. The exact number depends only on the two bottlenecks—the single Squid proxy and the single master database server. With a bit of creativity, either or both of these could be split across multiple servers as well, but as it is, if your application is somewhat cachable and heavy on database reads, this is a nice approach.
Each Apache server gets its own read-only MySQL database, so all read requests from your PHP scripts go over a Unix-domain local socket to a dedicated MySQL instance. You can add as many of these Apache/PHP/MySQL servers as you need under this framework. Any database writes from your PHP applications will go over a TCP socket to the master MySQL server.
|  | |
| 13.4. Error Handling |  | 14. Extending PHP |

Copyright © 2003 O'Reilly & Associates. All rights reserved.