
Appendix A. Using Input and Output Octets
To be SNMP-compatible, an IP device must support MIB-II (iso.org.dod.internet.mgmt.mib-2) objects. MIB-II contains the interfaces table (mib-2.interfaces.ifTable.ifEntry), which is one of the most useful objects for network monitoring. This table contains information about the system's network interfaces. Some of its objects are:
- ifMtu
-
The size of the largest packet that can be sent over the interface
- ifPhysAddress
-
The low-level (hardware) address of the interface
- ifInOctets
-
The number of octets received by the interface
- ifOutOctets
-
The number of octets sent by the interface
In many environments, this information is crucial. Companies such as Internet service providers (ISPs) make their livelihoods by providing usable bandwidth to their customers, and thus spend huge amounts of time and money monitoring and measuring their interfaces, circuits, etc. When these pipes fill up or get clogged, customers get upset. So the big question is, how can you monitor bandwidth effectively? Being able to answer this question is often a life and death issue.
The information you need to answer this question comes in a few parts. First, you must know what type of line you are trying to monitor. Without this information, the numbers don't mean much. Then you must find the line's maximum speed and determine whether it is used in full- or half-duplex mode. In most cases, you can find both of these pieces of information using SNMP. The ifSpeed object defined in MIB-II's interfaces table provides "an estimate of the interface's current bandwidth in bits per second." You can poll this object to find the line's maximum speed, or at least what the agent thinks the line's maximum speed should be. Note, though, that you must watch for some pitfalls. For example, Cisco routers have default maximum bandwidths for various types of links, but these defaults may not have much to do with reality: for instance, the default bandwidth for a serial line is 1.544 Mbps, regardless of the actual line speed. To get meaningful data, you must configure the router to report the maximum bandwidth correctly. (Sometimes, network administrators intentionally set the interface bandwidth to an incorrect number to nudge routing paths a different way. If this is the case, you're going to have trouble getting meaningful data out of SNMP.)
It's easier to get reliable information about the line's duplex mode. Serial lines operate in full-duplex mode. This means they can send and receive information at the same time (e.g., a 56 Kbps serial line can upload and download at 56 Kbps simultaneously, for a total of 112 Kbps). Other types of lines, such as 10BaseT Ethernet, can handle only half duplex. In a typical 10BaseT environment, the distinction between uploading and downloading data is meaningless; total bandwidth through the line is limited to 10 Mbps of input and output combined. Some devices have 10/100 cards in them, which makes identification even harder.
Many vendors have private MIBs that return the duplex state. For example, the following Cisco object returns the duplex state for an interface on the model 2900 switch: iso.org.dod.internet.private.enterprises.cisco.ciscoMgmt.ciscoC2900MIB .c2900MIBObjects.c2900Port.c2900PortTable.c2900PortEntry.c2900PortDuplexStatus.
The table to which this object belongs also contains an object that can be used to switch an interface's duplex state. This object is useful if you have a device that is incorrectly negotiating half duplex instead of full duplex; you can use it to force the port into the correct duplex state.
Once you find the line's maximum speed and duplex mode, you can calculate its utilization percentage. Many NMS products let you create expressions, which are named formulas that use MIB objects as variables. OpenView allows you to define expressions in the file $OV_CONF/mibExpr.conf. The syntax used in this file is complicated. Expressions are written in postfix notation.[72] The file contains some entries by default; these expressions are often useful, and may not need any tweaking[73] to work for your environment. Here is the default definition of the expression If%util:
[72]Also referred to as "reverse Polish notation." Instead of writing "1 + 2", you would write "1 2 +".
[73]The recommended way to modify $OV_CONF/mibExpr.conf is to use xnmcollectwith the -delExpr or -loadExpr switch.
If%util \
"Percent of available bandwidth utilized on an interface\n\
Computed by:\n\
    (Received byte rate + transmitted byte rate) * 8\n\
    ------------------------------------------------\n\
                    interface link speed\n\
then converted to a percentage."\
.1.3.6.1.2.1.2.2.1.10. \
.1.3.6.1.2.1.2.2.1.16. \
+ \
8 \
* \
.1.3.6.1.2.1.2.2.1.5. \
/ \
100 \
*Once we have defined If%util, we can use it to plot utilization with xnmgraph:
This displays a graph of the percent utilization for every interface on the device CiscoRouter14a. Note that you can use an expression name as the first of the colon-separated arguments in the xnmgraph command.$ /opt/OV/bin/xnmgraph -monochrome -c public -poll 5 -title Ifutil_Formula -mib \ If%util:CiscoRouter1a::::.1.3.6.1.2.1.2.2.1.2:::" CiscoRouter14a
Before you start using If%util to measure your entire organization, notice that this expression measures only half-duplex lines -- that is, it compares the sum of the input and output octets to the line's capacity. Any full-duplex line graphed with this calculation will look wrong. To prove this point, consider a full-duplex serial line with a maximum speed of 500 Kbps in each direction that is currently sending 125 Kbps and receiving 125 Kbps. The formula for If%util gives us a utilization of 50%, which is incorrect: the line is really at 25% of capacity. For a full-duplex line, it makes more sense to make separate computations for incoming and outgoing data. This gives you a better representation of what your network is doing, since in full-duplex mode the incoming data rate isn't affected by the outgoing data. Here are revised expressions for send utilization (WANIF%SendUtil) and receive utilization (WANIF%RecvUtil):
Now let's take a look at some actual graphs. We graphed different expressions and MIB objects at the same time for a 10BaseT (half-duplex) Ethernet interface. We then created some traffic on the interface and captured the results. Here is the script that generates the graphs:WANIf%SendUtil \ "% interface utilization from (ifOutOctets * 8 * 100) / ifSpeed"\ .1.3.6.1.2.1.2.2.1.16. \ 8 \ * \ 100 \ * \ .1.3.6.1.2.1.2.2.1.5. \ / WANIf%RecvUtil \ "% interface utilization from (ifInOctets * 8 * 100) / ifSpeed"\ .1.3.6.1.2.1.2.2.1.10. \ 8 \ * \ 100 \ * \ .1.3.6.1.2.1.2.2.1.5. \ /
Figure A-1 shows the MIB objects .iso.org.dod.internet.private.enterprises.cisco.local.linterfaces.lifTable.lifEntry.locIfInBitsSec and .iso.org.dod.internet.private.enterprises.cisco.local.linterfaces.lifTable.lifEntry.locIfOutBitsSec. These are private Cisco MIB objects that report the data rate in and out of an interface, in bits per second./opt/OV/bin/xnmgraph -monochrome -c public -poll 5 -title \ Cisco_Private_Local_Mib -mib \ ".1.3.6.1.4.1.9.2.2.1.1.6:CiscoRouter1a:4:::.1.3.6.1.2.1.2.2.1.2:::,\ .1.3.6.1.4.1.9.2.2.1.1.8:CiscoRouter1a:4:::.1.3.6.1.2.1.2.2.1.2:::" \ CiscoRouter1a & /opt/OV/bin/xnmgraph -monochrome -c public -poll 5 -title Ifutil_Formula \ -mib "If%util:CiscoRouter1a:4:::.1.3.6.1.2.1.2.2.1.2:::" CiscoRouter1a & /opt/OV/bin/xnmgraph -monochrome -c public -poll 5 -title \ WANIfRecvUtil_Formula -mib \ "WANIf%RecvUtil:CiscoRouter1a:4:::.1.3.6.1.2.1.2.2.1.2:::" CiscoRouter1a & /opt/OV/bin/xnmgraph -monochrome -c public -poll 5 -title WANIfSendUtil_Formula -mib \ "WANIf%SendUtil:CiscoRouter1a:4:::.1.3.6.1.2.1.2.2.1.2:::" CiscoRouter1a & /opt/OV/bin/xnmgraph -monochrome -c public -poll 5 -title ifInOctets -mib \ ".1.3.6.1.2.1.2.2.1.10:CiscoRouter1a:4:::.1.3.6.1.2.1.2.2.1.2:::" \ CiscoRouter1a & /opt/OV/bin/xnmgraph -monochrome -c public -poll 5 -title ifOutOctets -mib \ ".1.3.6.1.2.1.2.2.1.16:CiscoRouter1a:4:::.1.3.6.1.2.1.2.2.1.2:::" \ CiscoRouter1a &
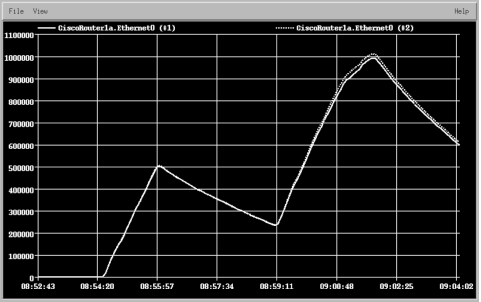
Figure A-1. Graph of Cisco private MIB objects
The next graph, shown in Figure A-2, shows the expression If%util. It's surprisingly different. The difference arises because Cisco uses a five-minute decaying average for these two objects. This can be both good and bad. The decaying average can prevent you from seeing local peaks and valleys in usage. In this example, we see two usage peaks, which the decaying average smears over a longer period of time. When using vendors' private MIBs, be sure to find out how they calculate their numbers.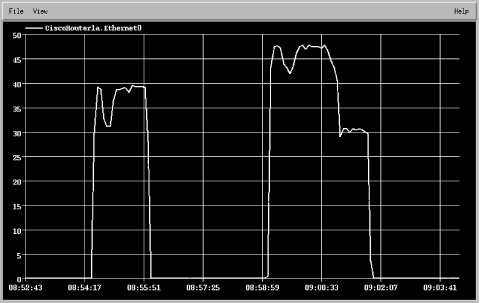
Figure A-2. Graph of If%util
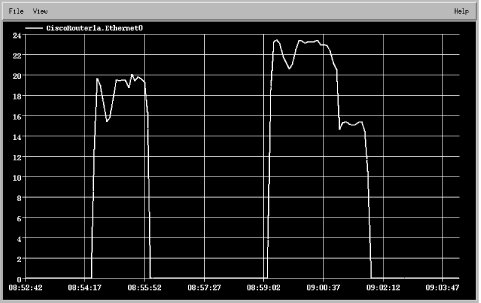
Figure A-3. Graph of WANIf%RecvUtil
Figures A-3 and A-4 show the WANIf%RecvUtil and WANIf%SendUtil expressions. Since this is a half-duplex interface we don't need to look at each direction (in and out) separately, but it may help to verify whether the receive path or the send path is maxed out. Comparing Figure A-3 with Figure A-4 shows that we are sending a bit more traffic than we are receiving.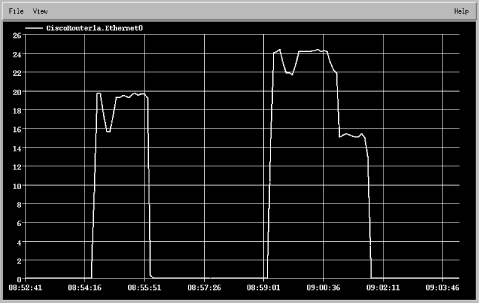
Figure A-4. Graph of WANIf%SendUtil
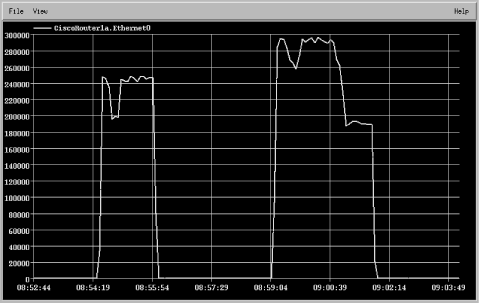
Figure A-5. Graph of ifInOctets
The standard MIB-II objects ifInOctets and ifOutOctets are graphed in Figure A-5 and Figure A-6. Remember that these do not show bits per second. Again, these graphs show that we are sending more traffic than we are receiving. The octet graphs in Figures A-5 and A-6 show a real-time picture, like the WAN expressions but unlike Cisco's private MIB objects.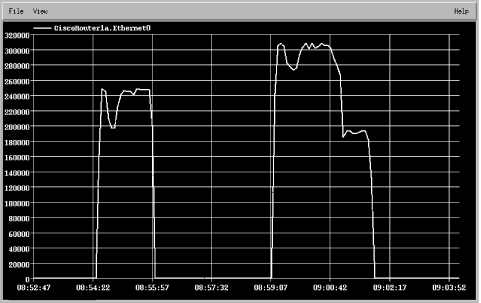
Figure A-6. Graph of ifOutOctets
Try to get a feel for what you are looking for before you start writing expressions. Are you trying to find someone who is flooding the network, or just looking for a weekly average? No matter what you are graphing, be sure to research the device's MIB objects before you start generating graphs that may look good but contain meaningless data. Recheck the variables each time you create new graphs.Keep in mind that some devices have the ability to switch from full to half duplex automatically. You should be aware of your interface's saturation point, which is the point at which no more traffic can be sent or received. This saturation point is indicated in your graphs by a sustained horizontal ceiling line and can really be seen only over extended periods of time. Thus, while there are some horizontal lines in the graphs in this appendix, we are obviously not close to the interface's capacity.
If you plan to use graphs like these, be sure to plan for the average and not for the exceptions (peaks). All networks have traffic spikes here and there; unless you like spending a lot more on telecommunications than you need to, you should plan your network so that it is geared toward servicing your average day-to-day activities, not the occasional peak.
 |  |  |
| 13.6. Getting Help |  | B. More on OpenView's NNM |

Copyright © 2002 O'Reilly & Associates. All rights reserved.